
Thermodynamic equilibrium calculation on preparation of copper oxalate precursor powder
FAN You-qi(樊友奇), ZHANG Chuan-fu(张传福), ZHAN Jing(湛 菁), WU Jian-hui(邬建辉)
School of Metallurgical Science and Engineering, Central South University, Changsha 410083, China
Received 27 February 2007; accepted 9 November 2007
Abstract: According to the principles of simultaneous equilibrium and mass balance, a series of thermodynamic equilibrium equations of  system at ambient temperature were deduced theoretically and the logarithm concentration versus pH value (lg[Cu2+]T―pH) diagrams at different solution compositions were drawn. The results show that when pH is below 5.0, copper ion reacts with
  directly and the morphology of copper precursor powder is of pie-shape; when pH is above 5.0, copper ion coordinates with ammonia, and the precipitation proceeds slowly accompanying with the release of copper ions from the multi-coordinated
  (n =1, 2, ???, 5) and the morphologies of copper precursor powder are respectively of rod aggregation shape (when 5.0<pH<8.0) and of rod-shape (when pH>8.0). Some experiments were performed to confirm the relation between the total concentration of copper ion and pH value. It is shown that the thermodynamic mathematical model is correct and the calculated values are basically accurate.
Key words: thermodynamic equilibrium; copper oxalate precursor; ultrafine copper powder; morphology
1 Introduction
Ultrafine copper powder is a versatile material, and many applications have been found in industrial fields. Because of its good surface activity and electrical conductivity, copper powder is widely used as powder metallurgy material[1], friction and antifriction material [2-6], catalyst[7-9], conducting coat or film[10-14], electromagnetic shielding material[10], etc.
The basic methods available for ultrafine copper powder preparation include gas-phase vapor method[15], electrolytic process[16], liquid phase reducing[17], and so on. ZHANG et al[18] reported that fibrous nickel powder was prepared by liquid phase precipitation and thermal decomposition method. Through a series of experiments, it was found that this method was also adapted to copper powder preparation. In contrast to the other methods, it is better for its simple process, low cost, controllable morphology and good quality of the products. For the method, once the powders are formed in the precipitation process, their basic characteristics, such as morphology, will be maintained. It is clear that the precipitation has great effects on the properties of the final products. ZHAN et al[19] have reported the thermo- dynamic analysis on the preparation of fibrous NiO precursor powders with oxalate precipitation process. But until now, there is no theoretical study on the thermodynamic analysis of Cu2+- NH3-
NH3-  H2O system. So it is well worth paying more attention to theoretical research of precipitation process for preparing high quality copper powder.
This research focuses on the thermodynamic equilibrium calculation on preparation of copper oxalate precursor powder. According to the principles of simultaneous equilibrium and mass balance, a series of thermodynamic equilibrium equations of Cu2+- NH3-H2O system at ambient temperature are deduced theoretically. By applying the results of thermodynamic calculation to guide the experiments, copper oxalate precursor powders with certain characteristics are produced.
2 Thermodynamic calculation of Cu2+-  NH3-NH4+-H2O system
2.1 Principle of calculation
In the system of Cu2+-NH3-H2O, there exist not only precipitation reactions, but also coordination reactions. For the reaction of Cu2+ with  it can be expressed as
 =
=
Ksp(CuC2O4(s))= (1)
(1)
For the reaction of Cu2+ with OH-,
Cu2++2OH-=Cu(OH)2(s)
Ksp(Cu(OH)2(s))=[Cu2+][OH-]2 (2)
Therefore, the practical concentration of free Cu2+ in the solution is deduced:
 (3)
(3)
2.2 Thermodynamic data and equilibrium equations
In the system of Cu2+- NH3-H2O, the main chemical reactions are involved in the coordination of Cu2+ with ammonia and
  hydrolysis of Cu2+, compounding of Cu2+ with and dissociation of weak acids and alkaline. The relevant reactions are listed in Table 1. For a certain precipitation process in the solution, the variables such as temperature, pressure are usually constant, so in the present study, the diagrams of lg[Cu2+]T vs pH at different solution compositions are drawn for further discussion.
Table 1 Equilibrium equations and constants of Cu2+- NH3-
NH3- H2O system (T=298 K)[20]

2.3 Mathematical model of lg[Cu2+]T vs pH value
Based on the principles of simultaneous equilibrium and mass balance, the mathematical models of lg[Cu2+]T vs pH value at different solution compositions are deduced. Here, [Cu2+], [Cu2+]T, [N]T, and [C]T stand for the free concentration of Cu2+, the total concentration of Cu2+, the total concentration of ammonia, and the total concentration of respectively.
The total concentration of coordination of Cu2+ with ammonia is expressed as [CuNH3]T in solution:
[CuNH3]T=[Cu(NH3)2+]+ +
+ +
+
 +
+ =
=
[Cu2+](104.31[NH3]+107.98[NH3]2+
1011.02[NH3]3+1013.32[NH3]4+1012.86[NH3]5)
(4)
The total concentration of coordination of Cu2+ with OH- is expressed as [CuOH]T in solution:
[CuOH]T=[Cu(OH)+]+[Cu(OH)2(aq.)]+ +
+
 =
=
[Cu2+](10pH-7.0+102pH-14.32+103pH-25.0+104pH-37.5)
(5)
Thus, the expressions of the total concentrations of NH3, Cu2+, namely [C]T, [N]T, [Cu2+]T can be obtained by:
[C]T= +
+ +[H2C2O4]=
(1+104.27-pH+105.54-2pH) (6)
[N]T=[NH3]+ +[Cu(NH3)2+]+
 +
+
 +
+ +
+ =
=
[NH3](1+109.24-pH+104.31[Cu2+]+2×107.98[Cu2+][NH3]+
3×1011.02[Cu2+][NH3]2+4×1013.32[Cu2+][NH3]3+
5×1012.86[Cu2+][NH3]4) (7)
[Cu2+]T=[Cu2+]+[CuOH]T+[CuNH3]T=
[Cu2+](1+10pH-7.0+102pH-14.32+103pH-25.0+
104pH-37.5 + 104.31[NH3]+107.98[NH3]2+
1011.02[NH3]3+1013.32[NH3]4+1012.86[NH3]5)
(8)
3 Calculated results and discussion
The relations among the seven variables of [Cu2+]T, [Cu2+], [N]T, [NH3], [C]T, and pH are confined by Eqns.(3)-(8). For given values of [C]T and [N]T at a certain pH value, other variables can be obtained from the above mentioned simultaneous equations by the computer program compiled by ourselves. The calculation results are plotted in Figs.1-4.
Fig.1 shows the lg[Cu2+]T―pH curves for Cu2+- NH3-H2O system (T=298 K) at different total concentrations of ammonia with [C]T being 0.4 mol/L. When pH is less than 4.0, the total concentration of copper ions in the solution, namely [Cu2+]T decreases with pH increasing. When pH value ranges from 4.0 to 5.0, [Cu2+]T almost reaches the minimum value. In the pH range of 5.0-8.0, the total concentration of copper ions in the solution increases sharply with pH increasing due to the strong coordination of copper ions with ammonia. The higher the concentration of ammonia in the solution is, the higher the [Cu2+]T value in the solution is. Then [Cu2+]T almost keeps constant at the maximum value when 8.0<pH<10.5. When pH is larger than 10.5, [Cu2+]T decreases again because copper ammonia compound will dissociate to copper ions under such high alkaline condition and copper ions precipitate from the solution, which leads to the decrease of total concentration of copper ions in the solution.

Fig.1 lg[Cu2+]T―pH curves for Cu2+-NH3-H2O system at different total concentrations of ammonia (T = 298K)
Fig.2 shows the lg[Cu2+]T―pH curves for Cu2+-NH3-H2O system at different total concentrations of  (T=298 K) with [N]T being 1.0 mol/L. The results show that the total concentration of Cu2+ in the solution decreases with the increasing of the total concentration of
  That’s because the degree of precipitation of Cu2+ with is much complete. When pH<8, the effects of the total concentration of C2O42- are more obvious than that when pH>8. Therefore, the total concentration of in the precipitated range of pH value should be considered in experiments. In order to reduce the total concentration of copper ions in the filtrate, the concentration of is as 1.1 times as the concentration of copper ions in the solution.

Fig.2 lg[Cu2+]T―pH curves for Cu2+-NH3-H2O system at different total concentrations of  (T=298 K)
Fig.3 and Fig.4 show the lgC―pH curves for each copper species and copper ammonia species in solution system (T=298 K), respectively. From Fig.3, it can be found that free copper ions are dominant in the solution when pH is less than 5.0. When 5.0<pH<8.0, the concentration of free copper ions decreases with the concentration of ammonia increasing and most of the copper ions coordinate with the ammonia as the different complex in solution. At the same time, the concentration of copper hydroxide compounds increases gradually with pH increasing. It should be noted that the total concentration of copper species in the solution increases and reaches the maximum value due to the concentration of copper ammonia complex. When pH>8.0, the concentration of copper hydroxide compounds and copper ammonia complex plays important roles on the total concentration of copper ions. Fig.4 indicates the change trends of concentration of different copper ammonia compounds, which further illuminates the result of the above figures.

Fig.3 lgC―pH curves for each copper species in Cu2+- NH3-H2O system under [N]T=1.0 mol/L and [C]T = 0.4 mol/L conditions (T=298 K)
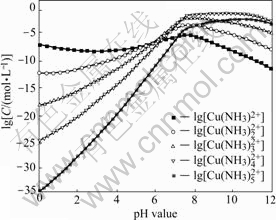
Fig.4 lgC―pH curves for copper ammonia species in Cu2+- NH3-H2O system under [N]T=1.0 mol/L and [C]T=0.4 mol/L conditions (T=298 K)
4 Experimental results and discussion
The reagents used in the experiment, including CuCl2・2H2O, NH3・H2O, ethanol, oxalic acid were all analytically pure and used without further purification. All the solutions were prepared by distilled water. Firstly, 100 mL H2C2O4 (0.2-1.0 mol/L) solution and 100 mL CuCl2 solution were both heated to certain temperature between 30 and 80 ℃, and then, the latter was dripped into the former at the rate of 3.0 mL/min. During the precipitation reaction, the suspension was kept at constant temperature, constant pH value and constant stirring speed. The suspension was stirred for 1 h after the reagent addition. Finally, the produced precipitation, so called precursor, was washed with distilled water and alcohol for several times to remove the possible adsorbed ions, and then dried in vacuum box at 100-120 ℃.
In the previous experiments, it was found that the morphology of the precipitated powder changed greatly as pH was around 5.0 or 8.0. Here, the corresponding relationship between the morphology of the precipitated powders and pH value based on the experimental and theoretical results is shown in Fig.5. From Fig.5, it can be seen that when pH is below 5.0, the pie-shape particles are obtained; however, when pH is between 5.0 and 8.0, the rod aggregation shape particles are produced; furthermore, when pH is above 8.0, rod-shape particles are yielded. This can probably attribute to the rise of free ammonia amount combined with copper oxalate in solution when pH value varies from 0 to 12. It is indicated from Fig.4 that the concentration of free ammonia, as well as various copper ammonia complexes increases gradually with the rise of pH value. As a result, the process of particle nucleation and growth is distinct and diverse morphologies of powder are obtained at different pH values. Undoubtedly, the different solution composition leads to the formation of these three kinds of particles with different shapes. In order to obtain certain copper precursor powders, the pH value should be adjusted to the corresponding range during the experimental process.
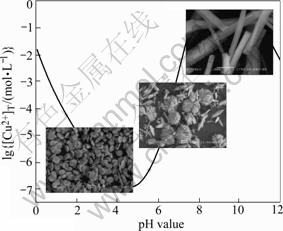
Fig.5 Relationship between morphology of precipitated particles and corresponding formation conditions in solution of Cu2+-NH3-H2O system
Fig.6 shows lg[Cu2+]T―pH curve of confirmation experiment. By considering the influence of metallic impurity in the process of pH controlling, ammonia is used as pH controlling agent instead of sodium hydroxide. And when pH value is more than 10.0, due to the effect of large amount of ammonia added to control pH, there is almost no precipitation in solution. So lg[Cu2+]T―pH curve is drawn only in the pH range of 2-9. From Fig.6, it can be seen that the changing trend of the total concentration of metal ions is in accordance with the theoretical curves, but the experimental values are slightly larger than theoretically calculated values in the pH range of 2.0-9.0. One of the main reasons is the influence of pH controlling agent, ammonia, which leads to more free copper ions combined with free ammonia in solution. Furthermore, during the theoretical calculation, all used constants are deduced at ambient temperature while the experiments are carried out at reaction temperature of 323 K. Finally, the complex reaction of Cu2+ ion and  ion is not concerned in the theoretical calculation. According to Fig.6, when pH value is less than 5.5, [Cu2+]T decreases gradually; when pH value is about 5.5, the total concentration of copper ions in solution reaches the minimum, namely, the precipitation rate of copper ions is the maximum; when pH value is higher than 5.5, the total concentration of copper ions in solutions increases gradually; at the same time, when pH value is higher than 9.0, copper ion concentration in filtrate is too high and precipitation of copper ions is incomplete.
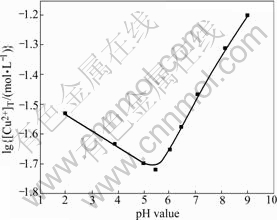
Fig.6 lg[Cu2+]T―pH curves of confirmation experiment ( 0.4 mol/L; [NH3]T=4.0 mol/ L; T=323 K)
5 Conclusions
1) Based on the principles of simultaneous equilibrium and mass balance, a series of thermodynamic equilibrium equations of the complex system of Cu2+- NH3-H2O at ambient temperature are deduced theoretically and the relationship between lg[Me2+]T and pH at different solution compositions is established quantitatively in precipitation process.
2) The theoretical calculation and experimental results show that, when pH value in solution is less than 5.0, free Cu2+ is the dominant metal ion in the solution, leading to the formation of pie-shape precursor; while pH value is larger than 5.0, most of the copper ions coordinate with the ammonia as the complex in the solution, which leads to the formation of rod aggregation shape precursor (when 5.0<pH<8.0) and rod-shape precursor (when pH>8.0) respectively.
3) The confirmation experiments are carried out and the experimental results basically agree with the theoretical analysis.
References
[1] MOUSTAFA S F, ABDEL-HAMID Z, ABD-ELHAY A M. Copper matrix SiC and Al2O3 particulate composites by powder metallurgy technique [J]. Materials Letters, 2002, 53(4/5): 244-249.
[2] ZHANG Y S, HAN Z, WANG K, LU K. Friction and wear behaviors of nanocrystalline surface layer of pure copper [J]. Wear, 2006, 260(9/10): 942-948.
[3] XIA Yan-qiu, QIAO Yu-lin. Friction and wear of nano-particles in tribology―A review [J]. Journal of Shenyang University of Technology, 2002, 24(4): 279-282.
[4] HO S C, CHERN-LIN J H, JU C P. Effect of phenolic content on tribological behavior of carbonized copper-phenolic based friction material [J]. Wear, 2005, 258(11/12): 1764-1774.
[5] YASAR I, CANAKCI A, ARSLAN F. The effect of brush spring pressure on the wear behaviour of copper-graphite brushes with electrical current [J]. Tribology International, 2007, 40(9): 1381-1386.
[6] MOHANTY S, CHUGH Y P. Development of fly ash-based automotive brake lining [J]. Tribology International, 2007, 40(7): 1217-1224.
[7] ROSTOVSHCHIKOVA T N, SMIRNOV V V, KOZHEVIN V M, YAVSIN D A, ZABELIN M A, YASSIEVICH I N, GUREVICH S A. New size effect in the catalysis by interacting copper nanoparticles [J]. Applied Catalysis A: General, 2005, 296(1): 70-79.
[8] BLATCHLEY E R, MARGETAS D, DUGGIRALA R. Copper catalysis in chloroform formation during water chlorination [J]. Water Research, 2003, 37(18): 4385-4394.
[9] WANG Yan-ni, ZHANG Zhi-kun, CUI Zuo-lin. Catalysis of nanocrystalline metal particles for polymerization of acetylene [J]. Chinese Journal of Catalysis, 1995, 16(4): 304-307.
[10] KE Wei, SHI Ze-min, QIAN Feng. Progress of preparation technologies in copper conductive coatings for electromagnetic interference shielding [J]. Polymer Materials Science & Engineering, 1994, 1(1): 25-29.
[11] MAEKAWA Y, KOSHIKAWA H, YOSHIDA M. Anisotropically conducting films consisting of sub-micron copper wires in the ion track membranes of poly(ethylene terephthalate) [J]. Polymer, 2004, 45(7): 2291-2295.
[12] SARKAR D K, ZHOU X J, TANNOUS A. Growth of self-assembled copper nanostructure on conducting polymer by electrodeposition [J]. Solid State Communications, 2003, 125(7/8): 365-368.
[13] ZHAO Hong-sheng, LIANG Tong-xiang, LIU Bing. Synthesis and properties of copper conductive adhesives modified by SiO2 nanoparticles [J]. International Journal of Adhesion and Adhesives, 2007, 27(6): 429-433.
[14] URE?A A, RAMS J, ESCALERA M D, S?NCHEZ M. Effect of copper electroless coatings on the interaction between a molten Al-Si-Mg alloy and coated short carbon fibres [J]. Composites Part A: Applied Science and Manufacturing,2007, 38(8): 1947-1956.
[15] HUANG Jun-sheng, REN Shan. Development on nanocrystalline powder copper preparation [J]. Materials Science and Engineering, 2001, 19(2): 76-79.
[16] LIAFFA D, DRAGOS T. Electrochemical preparation of standard-quality copper powders [J]. Revista de Chimie, 2000, 51(8): 600-606.
[17] HUANG Jun-sheng, REN Shan, XIE Cheng-wen. Nanocrystalline powder copper prepared by reduction in aqueous solution [J]. Materials Science and Engineering, 2003, 21(1): 57-59.
[18] ZHANG Chuan-fu, WU Jian-hui, ZHAN Jing, LI Chang-jun, DAI Xi. Precursor synthesis of fibrillar nanocrystalline nickel powder [J]. Nonferrous Metals, 2003, 55(3): 25-29. (in Chinese)
[19] ZHAN Jing, ZHANG Chuan-fu, LI Tie-jing, WU Jian-hui. Thermodynamic analysis on preparation of fibrous NiO precursor powders with oxalate precipitation process [J]. Trans Nonferrous Met Soc China, 2005, 15(4): 926-930.
[20] DEAN J A. Lange’s handbook of chemistry [M]. Beijing: Science Press, 1991. (in Chinese)
Corresponding author: FAN You-qi; Tel: + 86-731-8836037; E-mail: fanyouqi@163. com
(Edited by YUAN Sai-qian)
o

