��ѹ��V-5Cr-5Ti�Ͻ��Arrhenius�������̺Ͷ�̬�ٽᾧ��Ϊ
��Դ�ڿ����й���ɫ����ѧ��(Ӣ�İ�)2015���6��
�������ߣ������ ����� ����Ӣ �� ���´�
����ҳ�룺1889 - 1900
Key words��V-5Cr-5Ti alloy; constitutive model; flow stress; dynamic recrystallization
ժ Ҫ�����õ��µ���ѹ�������о�V-5Cr-5Ti (����������%)�Ͻ����¶�Ϊ1423-1573 K��Ӧ������Ϊ0.01-1 s-1�����µ�����Ӧ������֯�ݻ���Ϊ���������������Ӧ�����������Ħ����������Ħ������m�IJ���ֵΪ0.45-0.56���������Իع鷽����ϵõ��Ͻ��Arrhenius�ͱ������̣���ϼ���Ӧ����ʵ��Ӧ�������Թ�ϵ����R2��ƽ���������ֵ(AARE)�ֱ�Ϊ0.948��5.44%�����ۼ�����Qa��ȡֵ��ΧΪ540-890 kJ/mol��������̬�ٽᾧ(CDRX)�Ͳ�������̬�ٽᾧ(DDRX)��������ѹ���Ͻ��в��档���Ͻ�����Ӧ��Ϊ1.5�������£�Ӧ�������Ļ�����Ȼ�Զ�̬�ظ�(DRV)Ϊ����
Abstract: To clarify the high temperature flow stress behavior and microstructures evolution of a V-5Cr-5Ti (mass fraction, %) alloy, the isothermal hot compression tests were conducted in the temperature range of 1423�C1573 K with strain rates of 0.01, 0.1, and 1 s-1. The results show that the measured flow stress should be revised by friction and the calculated values of friction coefficient m are in the range of 0.45-0.56. Arrhenius-type constitutive equation was developed by regression analysis. The comparison between the experimental and predicted flow stress shows that the R2 and the average absolute relative error (AARE) are 0.948 and 5.44%, respectively. The measured apparent activation energy Qa is in the range of 540�C890 kJ/mol. Both dis-continuous dynamic recrystallization (DDRX) and continuous dynamic recrystallization (CDRX) mechanisms are observed in the deformed alloy, but dynamic recovery (DRV) is the dominant softening mechanism up to a true strain of 1.5.
Trans. Nonferrous Met. Soc. China 25(2015) 1889-1900
Yu-fei LI1, Zhen-hong WANG2, Lin-ying ZHANG2, Chao LUO2, Xin-chun LAI1
1. Science and Technology on Surface Physics and Chemistry Laboratory, Mianyang 621907, China;
2. China Academy of Engineering Physics, Mianyang 621900, China
Received 29 June 2014; accepted 30 October 2014
Abstract: To clarify the high temperature flow stress behavior and microstructures evolution of a V-5Cr-5Ti (mass fraction, %) alloy, the isothermal hot compression tests were conducted in the temperature range of 1423�C1573 K with strain rates of 0.01, 0.1, and 1 s-1. The results show that the measured flow stress should be revised by friction and the calculated values of friction coefficient m are in the range of 0.45-0.56. Arrhenius-type constitutive equation was developed by regression analysis. The comparison between the experimental and predicted flow stress shows that the R2 and the average absolute relative error (AARE) are 0.948 and 5.44%, respectively. The measured apparent activation energy Qa is in the range of 540�C890 kJ/mol. Both dis-continuous dynamic recrystallization (DDRX) and continuous dynamic recrystallization (CDRX) mechanisms are observed in the deformed alloy, but dynamic recovery (DRV) is the dominant softening mechanism up to a true strain of 1.5.
Key words: V-5Cr-5Ti alloy; constitutive model; flow stress; dynamic recrystallization
1 Introduction
In recent years, V-Cr-Ti alloy has been investigated as a potential constructive material for the first wall blanket of the fusion reactor [1]. It is well documented that V-Cr-Ti ingot produced by vacuum melting is subjected to various thermomechanical processes, such as forging, extrusion and rolling to refine the grain size [2-6]. The alloy fabrication is also prevalent during recent years (2012-2013) [5,6] despite that different products can be fabricated successfully in 1990s [2,3]. However, the corresponding constitutive model of the alloy is not sufficient to characterize the dependence of flow stress on temperature, strain rate and strain. LENNON and RAMESH [7], VOYIADJIS and ABED [8] and NASSER and GUO [9] constructed some physically-based models to investigate the dynamic response of pure V from 77 to 800 K. Moreover, CHEN et al [10] and CAI et al [11] developed ambient temperature Johnson-Cook model for V-5Cr-5Ti alloy under high strain rate impact and quasi-static tensile state, respectively. DONAHUE et al [12] evaluated a physically-based model for V-4Cr-4Ti alloy from 77 to 373 K. However, the above mentioned models are not suitable to describe the formation process of alloy under hot working conditions. Recently, YU et al [13] have developed a mathematical constitutive model for a coarse-grained V-5Cr-5Ti alloy under hot compression conditions, however, that is not systematical.
As we all know, in metal-forming processes, the control parameters are temperature (T), strain rate  and strain (e). To establish precise relationships among the three variables and to investigate their influence on the flow stress(es) and microstructure, tests are usually performed at constant temperature and strain rate [14-17]. These relationships in combination with finite-element methods (FEM) make possible to analyze the process. Therefore, to achieve this objective, the first step is to obtain a constitutive equation describing the evolution of flow stress under specified conditions [18�C20]. Constitutive equations involving evolution and estimation of flow stress have been extensively studied, and among these, Arrhenius-type model has been extensively used under simulated hot working conditions [17, 21�C26].
On the other hand, investigations on the microstructure of V-Cr-Ti alloy during the thermomechanical process mainly focus on the cold work, static recrystallization (SRX) and artificial aging [27-31]. The detailed microstructure research of hot-deformation is scarce. HOELZER and ROWCLIFFE [32] and HINS and THRESH [2] reported the occurrence of dynamic recrystallization (DRX) during hot extrusion, and YU et al [13] mentioned that there is DRX behavior during the uniaxial compression. However, none of them gave more details.
The objective of this study is to investigate the influence of strain, strain rate and temperature of formation on the uniaxial compressive deformation flow stress and the microstructures of a nominal V-5Cr-5Ti alloy. A phenomenological Arrhenius-type model is developed firstly, and then the deformed grain features are investigated preliminarily.
2 Experimental
2.1 Materials
First, a piece of vertical section disk (d~120 mm) was cut from an annealed and hot isostatic pressed (HIP-ed) V-5Cr-5Ti ingot (~25 kg). Its chemical composition is V-5.12Cr-4.87Ti-0.056O (mass fraction, %). A series of cylindrical specimens, d 9 mm �� 12 mm, were sliced from the disk by an electrical discharge machine. The typical grain feature is shown in Fig. 1. The grain size of specimen is in the range of 0.7-1.1 mm and the mean value is about 860 mm (by intercept method based on ASTM E112-12). There are some plate-like Ti-(CNO) phase in the alloy, as shown in Fig. 1(b), and some unwell developed sub-grains in the huge matrix grains. The compression axial (CA) direction is along the axial of ingot.
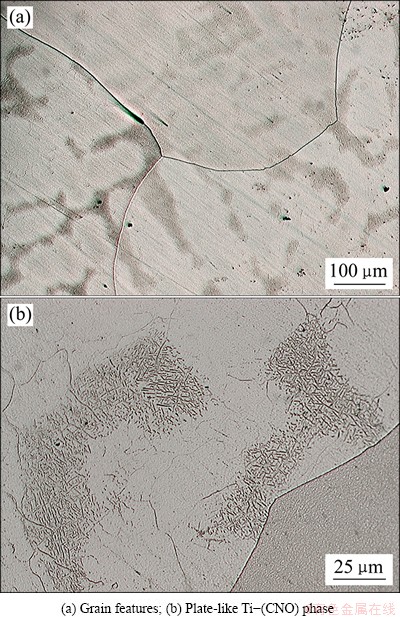
Fig. 1 Microstructures of as-received V-5Cr-5Ti alloy (Compression axial (CA) direction is vertical to screen)
2.2 Experimental procedure
All cylindrical compression specimens were machined to d 8 mm �� 12 mm to remove the surface oxidation layer. Subsequently, both the ends of each specimen were mechanically polished. The hot compression test was performed on a Gleeble-3800 system (Dynamic Systems Inc., USA) at three strain rates (0.01, 0.1 and 1 s-1) and four temperatures (1423, 1473, 1523 and 1573 K) in an argon atmosphere (99.999%, ~0.09 MPa). Pure tungsten was adopted as compression anvil after testing. Tantalum, graphite foil and nickel-based lubricant were employed for lubrication. As shown in Fig. 2, the specimen was heated to 100 K over the deformation temperature (Tdeform) at a heating rate of 10 K/s and held for 1 min, and cooled at a rate of 2 K/s to the deformation temperature and held for another 0.5 min, which was then compressed and quenched in water within 2-3 s.

Fig. 2 Experimental procedure for hot compression test
Repeated tests were performed under similar condition until the difference between the two peak stresses (true stress vs. true strain curve) was within 5%-7%. The height and diameter of specimen before and after test were recorded. After test, the specimens were sectioned into two parts along the CA direction to observe the microstructures.
3 Results and discussion
3.1 Flow stress behavior and correction
The measured true stress�Ctrue strain curves are shown as solid lines in Fig. 3. It exhibits that the flow stress of isothermal compressed V-5Cr-5Ti alloy is sensitive to both strain rate and deformation temperature. The flow stress increases with increasing the strain rate or decreasing the deformation temperature. These curves exhibit two features: 1) in the initial stage of the forming process, the stress abruptly increases due to the dominance of work hardening 2) with the increase in strain, the stress acquires steady-state due to the equilibrium established between work hardening and work softening. A slow drop in stress is observed at strain rate of 0.01 s-1.
Considering the negative effect of interfacial friction, which could not be avoided, on the deformation of specimen, the measured flow stress should be corrected. The detailed procedures to correct the flow stress can be found in Refs. [24,33,34]. Briefly, the average friction coefficient (m) is calculated according to the changes in height and diameter of specimen, and then the flow stress is corrected by using the value of m. The calculated values of m are 0.45, 0.51, 0.55 and 0.56 for 1423, 1473, 1523 and 1573 K, respectively. Notably, the increase in adiabatic temperature is neglected during the test because of the low strain rates (��1 s-1). The revised true stress�Ctrue strain curves are also shown as the dashed lines in Fig. 3. All the following calculations are based on the revised stress. Table 1 lists the corresponding peak stresses.
Table 1 Peak stresses at different temperatures and strain rates

Figure 3 shows that the correction made by using the value of m for the entire compression process is a nearly proportional reduction of the original data. The m is the mean value calculated from zero to the measured strain level, which is based on the conventional perspective that the friction coefficient is constant and independent of the strain level [33,34]. This could overestimate the friction coefficient at small strain level (e.g., 0.2) because of good lubrication. The revised flow stress at smaller strain level may be lower than its true value. Even in this case, it is believed that the revised flow stress is closer to its real value.

Fig. 3 Experimental and revised true stress vs true strain plots at different temperature (Solid and dashed lines represent experimental and corrected data, respectively)
3.2 Arrhenius-type model
In a phenomenological approach, the flow stress is expressed in terms of the hyperbolic law in an Arrhenius-type equation as [22,35]
 (1)
(1)
where  is the strain rate (s-1), Q is the apparent activation energy for hot deformation (kJ/mol), R is the universal gas constant (8.31 J/(mol��K)), T is the absolute temperature (K), s is the flow stress (MPa) for a given strain, A, a and n are the material constants.
The value of a represents the stress reciprocal at which the material deformation changes from power to exponential stress dependence [36]. In general, Eq. (1) can be simplified to Eq. (2) and Eq. (3) at low stress level (power law) and high stress level (exponential law) [22,37], respectively.
 for as<0.8 (2)
 for as>1.2 (3)
 (4)
(4)
where A1, A2 and �� are the material constants.
The values of a and n could not be obtained independently from Eq. (1), however, they can be optimized by mathematical iterative method [35,38] to obtain the best possible values, and twice iterative method was used after testing.
3.2.1 Determination of material constants
The peak stresses shown in Table 1 are used to introduce the solution procedures for the material constants. Taking the logarithm on both sides of Eqs. (1�C3), respectively, gives
 (5)
(5)
 (6)
(6)
 (7)
(7)
Subsequently, the substitution of the corresponding values listed in Table 1 into Eqs. (6) and (7) gives the relationship between the flow stress and strain rate, as shown in Fig. 4. The values of n and b can be obtained from the slope of the linear fitting plots at four different temperatures in Figs. 4(a) and (b), respectively. Therefore, four variable values of a can be calculated by using Eq. (4), respectively, and the mean value of a was 0.006284 MPa-1. Finally, after twice iterative analysis, the mean values obtained for a and n were 0.007295 MPa-1 and 7.64, respectively.
Under the given conditions of strain rates, the differentiation of Eq. (1) gives
 (8)
(8)
By substituting the values of temperature and flow stress which are obtained from a fixed strain rate into Eq. (8), the value of Q can be derived from the slope obtained from a plot of ln[sinh(as)] as a function of 1/T with the known R and n (7.64) values. The value of Q was evaluated to be 724.13 kJ/mol by averaging the values of Q under different strain rates.

Fig. 4 Relationships of lns-ln(a) and s-ln(b)
Finally, by substituting the values of strain rate and peak stress for all the tested temperatures, and the values of Q, R and a into Eq. (1), the relationship between ln[sinh(as)] vs ln Z can be obtained as shown in Fig. 5(a). According to the intercept and slope of the linear fit plot, the values of material constant A and the latest n are evaluated as 7.8572��1022 s-1 and 7.21, respectively. Importantly, the value of n (7.21) was adopted as the final constitutive model parameter, and it is almost equal to the mean value of n (7.64). The final constitutive model parameters for peak stress are listed in Table 2.
Table 2 Material parameters for peak stress prediction

Figure 5(b) shows the comparison of the predicted and experimental peak stress, based on the developed constitutive model. The R-square (R2, the coefficient of determination) and the average absolute relative error (AARE) obtained from Eq. (9) are 0.947 and 5.32%, respectively.
 (9)
(9)
where E is the experimental flow stress and P is the predicted flow stress.
3.2.2 Compensation of strain
The influence of strain on flow stress is not considered in Eq. (1). However, it has been observed that the flow stress showed significant variation with the strain [35-37]. Therefore, the values of material constants (n, a, Q and ln A ) of the constitutive equations were calculated by the same procedure under strains of 0.05, 0.1, 0.2, 0.3, 0.4 and 0.5, as shown in Fig. 6.
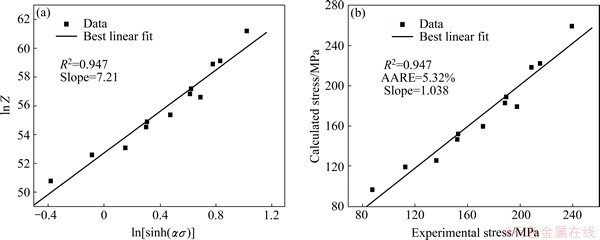
Fig. 5 Relationship of ln[sinh(as)]-ln Z (a) and Comparison between predicted and measured peak stress (b)

Fig. 6 Variation of a (a), n (b), Q (c) and ln A (d) with strain (e)
LI et al [39] and GUBBI and ROWCLIFFE [40] measured the activation energy of static recrystallization for V-(4-5)Cr-(4-5)Ti alloy to be 261.91-289.67 kJ/mol and 576 kJ/mol, respectively. On the other hand, The reported activation energy Q of V-4Cr-4Ti alloy is 180-326 kJ/mol for thermal creep [41]. It can be seen from Fig. 6(c) that the calculated apparent Qa (approximately 540-890 kJ/mol) is higher than that for creep and static recrystallization. It is typical for many metals because Qa without any specific physical meaning and may be the sum of several thermal activation processes [21].
A fifth order polynomial, as given by Eq. (10), was used to represent the influence of strain on these material constants. The coefficients of the polynomial are listed in Table 3.
 (10)
(10)
where Y(e) represents the four material constants (n, a, Q and ln A ) and e denotes strain.
Once the material constants are evaluated, the constitutive equation that relates the flow stress, strain rate and temperature can be written as follows from Eq. (1):

 (11)
(11)
where, the values of n, a, Q and ln A can be calculated by Eq. (10) and Table 3.
By using the developed constitutive equation Eq. (11), the predicted results are obtained and compared with the experimental data, as shown in Fig. 7.
3.3 Deformed microstructures
Figure 8 shows the flow stress curve and grain features of V-5Cr-5Ti alloy compressed under 1573 K and 0.01 s-1. Figures 8(b)-(d) show the grain features of specimens deformed to a strain of 0.1, 0.5 and 1.5 (nominal), respectively. At strain of 0.1 (Fig. 8(b)), there are some ��new grains�� formed along the bulged prior grain boundaries, and there are some glide bands of dislocations at the grain interior.
Table 3 Coefficients of polynomial in Eq. (10)
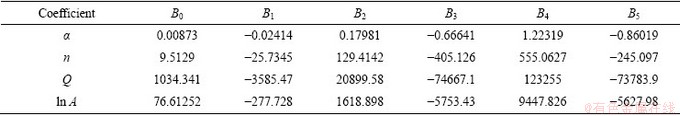
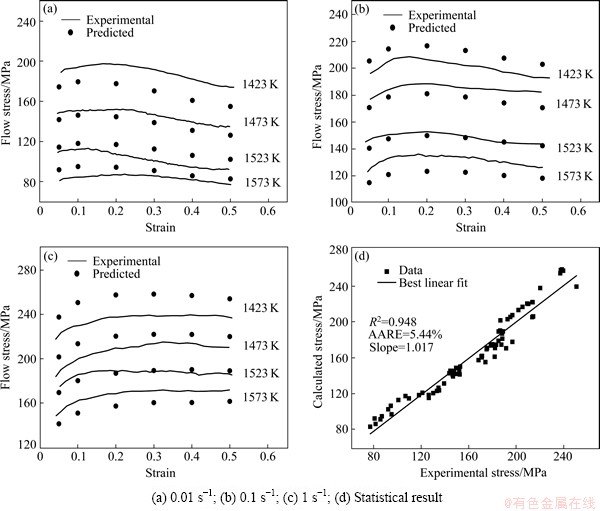
Fig. 7 Comparison between experimental and predicted flow stress at different strain rates (Solid lines and dots represent experimental and predicted data under different temperatures, respectively)
When the alloy is compressed to a strain of 0.5 (Fig. 8(c)), the bulging of prior grain boundaries are more clear, which is the feature of DRX onset [42]. Close to the bulged prior grain boundaries, there are also some small ��new grains�� within the upper matrix grain. At strain of 1.5 (Fig. 8(d)), the elongated matrix grains are subdivided by new, small and equiaxial grains, which seems to indicate a completion of DRX process. However, as will be discussed below, it is not the truth.
Figure 9 gives the as-deformed microstructures of alloy compressed under different conditions. The white lines, red lines and black lines represent boundary misorientation between 2��-5��, 5��-15�� and 15��-65��, respectively. For the alloy strained to 0.5 under 1373 K and 1 s-1 (ln Z=61.2), as shown in Fig. 9(a), there are many deformation bands (DBs) within grains, and the boundaries of DBs and prior matrix grains are bulged but the amplitude is smaller than that shown in Fig. 8(c) (0.01 s-1). The insert in Fig. 9(a) shows that there are indeed some new DRX grains in the scale of 1 mm at the prior grain boundaries occasionally.
As the alloy is compressed to a strain of 0.5 under 1573 K and 0.01 s-1 (Fig. 9(c)), there is an obvious occurrence of DRX along the prior grain boundaries, as well as an obvious orientation gradient toward the prior grain boundaries. Combined with the optical appearance (Fig. 8(c)), the observed DRX nucleation mechanism is strain-induced boundary migration (SIBM), which is the results of dislocation aggregation and grain boundaries sliding [42,43].
When the alloy is further strained to 1.5 (Fig. 9(e)), there is a progress of DRX and orientation gradient as well as a growth of DRX grains (maximum of ~150 mm). The new DRX grains are mainly located at the prior grain boundaries. Small ��new�� DRX grains begin to nucleate at the boundaries of ��old�� DRX grains, as shown in the black dashed rectangle. This ��necklace�� is a typical feature of the discontinuous-type DRX (DDRX) with the SIBM mechanism [42-44]. On the other hand, the ��necklace�� grains indicate that the DRX kinetic is not complete.

Fig. 8 Deformed microstructures of V-5Cr-5Ti alloy compressed under 1573 K and 0.01 s-1(Compression axial (CA) direction is vertical. Dashed blue line represents hardness testing trace)

Fig. 9 EBSD IPF coloring microstructure evolution of specimen compressed under different conditions
Furthermore, there are many sub-grains within the matrix grains in Fig. 9(e) shown as the blue dashed rectangle, and there are already some ��new�� DRX grains with black boundaries. The misorientation accumulated around the prior grain boundaries is also observed. In another view-field (Fig. 9(g)), these sub-grains in the matrix grain are with different crystal direction and orientation spread. Parts of the sub-grains are with both white (2��-5��) and red (5��-15��) boundaries and parts with both red and black (>15��) boundaries, as marked by the blue arrow. Figure 9(h) shows the misorientation profiles along the lines marked in Fig. 9(g), as well as that in a grain at as-received state. It is clear that there is an obvious misorientation accumulation between and within the sub-grains, which is the origin of the long range orientation gradient. These imply that the matrix grain is subdividing into sub-grains and the misorientation of sub-grains boundaries are continuously increasing to form DRX grains in-situ by absorbing dislocations or lattice rotation [42,43], i.e., the continuous-type DRX (CDRX), as the grain marked by the red arrow.
Furthermore, according to the misorientation angle distributions shown in Figs. 9(b), (d) and (f) and disregarding the different analysis zones, there is a continuous decrease in the very low angle boundaries (<5��) and a steady increase in the higher angle boundaries (>15��). This implies a progress of DRX at the expense of sub-grains. These sub-grains are the results of dynamic recovery (DRV).
The specimens of Figs. 8(d), 9(e) and 9(g) are the same but not in the same observation zone. According to the EBSD results, most of these grains observed in Fig. 8(d) are sub-grains (<15��). The ��real�� percentage of DRX at this strain is approximately 10%-15% by EBSD. Similarly, most of the observed small ��new grains�� in Figs. 8(b) and (c) adjacent to the bulged boundaries are also sub-grains. Since, both DDRX and CDRX are initiated in the hot-compressed V-5Cr-5Ti alloy.
Moreover, it can be seen from Figs. 8(d) and 9(e) that the matrix grain boundaries are approaching to each other along the compression axial direction. Since, geometric DRX (GDRX) may occur if the specimen is compressed to a larger strain. From Figs. 9(a) and (c), there is a tendency for the formation of cube texture ({001}<100>), which has been investigated in high stacking fault energy FCC metals for several years [45]. It is interesting and important and necessary to investigate intensively in future.
On the other hand, the flow stress curve (Fig. 8(a)) demonstrates a continuous but slow stress drop with time, and the stress platform (after ~100 s) is most likely the results of the serious friction and temperature fluctuation at large strain but not the completion of DRX, which can result in a stress saturation [42]. Even this flow stress curve belongs to the DRX-type curve [42,43], the DRV process is also dominant which can slow down the accumulation of dislocation and thus the progress of DRX. This is because the stacking-fault formation energy of vanadium seems to be the lowest among the pure refractory metals with a BCC lattice [9]. It is very difficult to achieve an enough strain to get a complete DRX microstructure (true strain of 12 for CDRX mechanism [42]) by means of this type of uniaxial compression. Since, one can not determine the kinetic of DRX using the flow stress curve.
To characterize the orientation/strain gradient and dislocation density increasing vertical to the matrix grain boundaries (as schematized in Fig. 8(c)), Vickers hardness test was performed on specimens separately deformed to a strain of 0.5 and 1 under 1573 K and 0.01 s-1. The compression force and holding time are 0.098 N and 15 s, respectively. Figure 10 gives the testing results. There is no evident law, but with a successive decrease and increase tendency (��W�� shape) toward the matrix grain boundaries under both conditions. The specific physical mechanism is not very clear, but both the dislocation motion and lattice rotation are responsible for this. On the other hand, the hardness difference in two adjacent matrix grains is mainly due to the difference of crystallographic orientation.
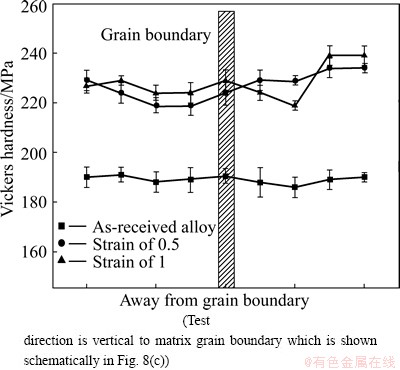
Fig. 10 Vickers hardness of alloys deformed under 1573 K and 0.01 s-1 to strain of 0.5 and 1 and as-received alloy
Figure 11 shows the TEM photographs of the specimens deformed to a strain of 0.5 under conditions of (1373 K, 0.01 s-1) and (1573 K, 0.01 s-1) separately. The DRX nuclei and sub-grains are clear in both the specimens. These DRX nuclei/sub-grains deformed at 1373 K (ln Z=56.6) are smaller than those deformed at 1573 K (ln Z=50.7). Herein, high angle grain boundaries (HAGB) and low angle grain boundaries (LAGB) are marked in Fig. 11 despite the accurate angle/ misorientation about these boundaries are missing. It is found that there are dislocations in the DRX nucleus at 1373 K, but those are missing at 1573 K because of the difference of zone axis. Moreover, the DRX nucleus shown in Fig. 11(b) is nucleating because the right-side of the grain boundary is LAGB while the others are HAGB (probably). This is a support clue about the CDRX mechanism mentioned above.
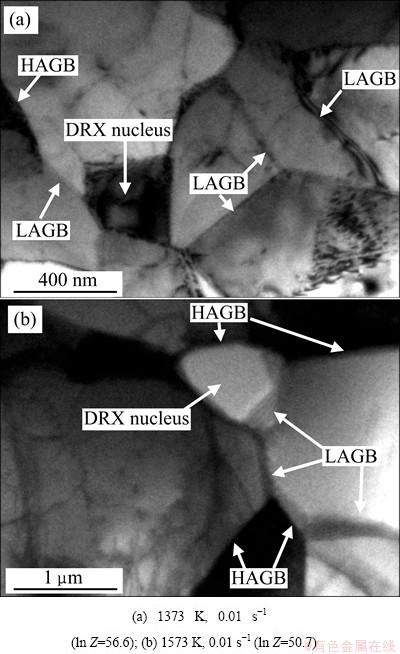
Fig. 11 TEM photographs of specimens deformed up to strain of 0.5 under different conditions
4 Conclusions
1) Friction exhibited a significant influence on the flow stress, and the true stress vs true strain curves should be corrected by the friction coefficient. The calculated values of friction coefficient m are in the range of 0.45-0.56. Peak stresses are both temperature and strain rate dependent.
2) The dependence of flow stress on temperature and strain rate was described by the regression analysis of conventional hyperbolic sine equation. The influence of strain was incorporated in the constitutive equation by performing a fifth order polynomial. The comparison between the experimental and predicted flow stress shows that the values of R2 and AARE are 0.948 and 5.44%, respectively. The measured apparent activation energy Qa is in the range of 540-890 kJ/mol.
3) The controlling softening mechanisms of the alloy are both dynamic recovery and dynamic recrystallization. The prior grain boundaries bulge and parts of them serve as DRX nucleus. With strain increasing, new DRX grains are mainly located at the prior grain boundaries to form a ��necklace�� feature. This is the DDRX based on the strain-induced boundary migration (SIBM) mechanism.
4) Parts of matrix grains are subdividing into sub-grains and the misorientation of sub-grains boundaries are continuously increasing to form DRX grains in-situ by absorbing dislocations or lattice rotation, i.e., the CDRX. Both DDRX and CDRX are initiated in the alloy.
Acknowledgments
The authors gratefully acknowledge Rong MA, Qin-ying XU, Chun-li JIANG and Feng-sheng QU for the help with specimen preparation, compression test and microstructure observation.
References
[1] MUROGA T, NAGASAKA T, ABE K, CHERNOV V M, MATSUI M, SMITH D L, XU Z Y, ZINKLE S J. Vanadium alloys��Overview and recent results [J]. Journal of Nuclear Materials, 2002, 307-311: 547-554.
[2] HINS A G, THRESH H R. Preparation and fabrication of vanadium base alloys [R]. Fusion Materials: Semiannual Progress Report for Period Ending, DOE/ER-0313/2, 1987: 247-258.
[3] JOHNSON W R, SMITH J P. Fabrication of a 1200 kg ingot of V-4Cr-4Ti alloy for the DIII�CD radiative divertor program [J]. Journal of Nuclear Materials, 1998, 258-263: 1425-1430.
[4] MUROGA T, NAGASAKA T, IIYOSHI A, KAWABATA A, SAKURAI S, SAKATA M. NIFS program for large ingot production of a V-Cr-Ti alloy [J]. Journal of Nuclear Materials, 2000, 283-287: 711-715.
[5] DUQUESNES V, GUILBERT T, FLEM M L. French investigation of a new V-4Cr-4Ti grade: CEA-J57�CFabrication and microstructure [J]. Journal of Nuclear Materials, 2013, 426: 96-111.
[6] FU H Y, CHEN J M, ZHENG P F, NAGASAKA T, MUROGA T, LI Z D, CUI S, XU Z Y. Fabrication using electron beam melting of a V-4Cr-4Ti alloy and its thermomechanical strengthening study [J]. Journal of Nuclear Materials, 2013, 442: S336-S340.
[7] LENNON A M, RAMESH K T. The influence of crystal structure on the dynamic behavior of materials at high temperatures [J]. International Journal of Plasticity, 2004, 20: 269-290.
[8] VOYIADJIS G Z, ABED F H. Microstructural based models for bcc and fcc metals with temperature and strain rate dependency [J]. Mechanics of Materials, 2005, 37: 355-378.
[9] NASSER S N, GUO W G. High strain-rate response of commercially pure vanadium [J]. Mechanics of Materials, 2000, 32: 243-260.
[10] CHEN Jie, MEI Jun, XIE Ruo-ze, HU Wen-jun, HE Peng, WANG Tong-wei. Studies on the dynamic compressive behavior and constitutive equation of V-5Cr-5Ti alloy [J]. Journal of Southwest University of Science and Technology, 2010, 25: 6-10. (in Chinese)
[11] CAI M C, ZHANG J T, NIU L S, SHI H J. Strain-rate sensitivity and fracture mode of V-5Cr-5Ti alloy [J]. Scripta Materialia, 2010, 62: 524-527.
[12] DONAHUE E G, ODETTE G R, LUCAS G E. A physically based constitutive model for a V-4Cr-4Ti alloy [J]. Journal of Nuclear Materials, 2000, 283-287: 637-641.
[13] YU Xing-zhe, SONG Yue-qing, CUI Shun, LI Ming, LI Zeng-de. The mathematical model research of deformation resistance of V-5Cr-5Ti alloys [J]. Journal of Plasticity Engineering, 2008, 15: 122-124. (in Chinese)
[14] McQUEEN H J. Elevated-temperature deformation at forming rates of 102 to 10-2s-1 [J]. Metallurgical and Materials Transactions A, 2002, 33: 345-362.
[15] SUNG J H, KIM J H, WAGONER R H. A plastic constitutive equation incorporating strain, strain-rate, and temperature [J]. International Journal of Plasticity, 2010, 26: 1746-1771.
[16] QUAN G Z, MAO Y P, LI G S, LV W Q, WANG Y, ZHOU J. A characterization for the dynamic recrystallization kinetics of as-extruded 7075 aluminum alloy based on true stress�Cstrain curves [J]. Computational Materials Science, 2012, 55: 65-72.
[17] SAMANTARAY D, PHANIRAJ C, MANDAL S, BHADURI A K. Strain dependent rate equation to predict elevated temperature flow behavior of modified 9Cr-1Mo (P91) steel [J]. Materials Science and Engineering A, 2011, 528: 1071-1077.
[18] PENG X N, GUO H Z, SHI Z F, QIN C, ZHAO Z L. Constitutive equations for high temperature flow stress of TC4-DT alloy incorporating strain, strain rate and temperature [J]. Materials and Design, 2013, 50: 198-206.
[19] LIN Y C, WEN D X, DENG J, LIU G, CHEN J. Constitutive models for high-temperature flow behaviors of a Ni-based superalloy [J]. Materials and Design, 2014, 59: 115-123.
[20] LIN Y C, CHEN X M, WEN D X, CHEN M S. A physically-based constitutive model for a typical nickel-based superalloy [J]. Computational Materials Science, 2014, 83: 282-289.
[21] McQUEEN H J, RYAN N D. Constitutive analysis in hot working [J]. Materials Science and Engineering A, 2002, 322: 43-63.
[22] LIN Y C, CHEN X M. A critical review of experimental results and constitutive descriptions for metals and alloys in hot working [J]. Materials and Design, 2011, 32: 1733-1759.
[23] LIN Y C, LI Q F, XIA Y C, LI L T. A phenomenological constitutive model for high temperature flow stress prediction of Al-Cu-Mg alloy [J]. Materials Science and Engineering A, 2012, 534: 654-662.
[24] LIN Y C, XIA Y C, CHEN X M, CHEN M S. Constitutive descriptions for hot compressed 2124-T851 aluminum alloy over a wide range of temperature and strain rate [J]. Computational Materials Science, 2010, 50: 227-233.
[25] LIN Y C, CHEN M S, ZHONG J. Constitutive modeling for elevated temperature flow behavior of 42CrMo steel [J]. Computational Materials Science, 2008, 42: 470-477.
[26] HE A, XIE G L, ZHANG H L, WANG X T. A comparative study on Johnson�CCook, modified Johnson�CCook and Arrhenius-type constitutive models to predict the high temperature flow stress in 20CrMo alloy steel [J]. Materials and Design, 2013, 52: 677�C685.
[27] YUMENTSEV A N, KOROTAEVA A D, PINZHINA Y P, DITENBERGA I A, LITOVCHENKO S V, SHUBA Y V, SHEVCHENKO N V, DROBISHEV V A, POTAPENKO M M, CHERNOV V M. Effect of the modes of thermomechanical treatment on the formation of the multiphase and grain structure of V-4Ti-4Cr alloys [J]. Journal of Nuclear Materials, 2004, 329-333: 429-433.
[28] SHIKOV A K, CHERNOV V M, POTAPENKO M M, GUBKIN I N, DROBYSHEV V A, ZURABOV V S. Development of production process and study of low-activity V-(4�C5)%Ti-(4�C5)%Cr structural alloys for thermonuclear reactors [J]. Metal Science and Heat Treatment, 2004, 46: 497-503.
[29] NAGASAKA T, TAKAHASHI H, MUROGA T, TANABE T, MATSUI H. Recovery and recrystallization behavior of vanadium at various controlled nitrogen and oxygen levels [J]. Journal of Nuclear Materials, 2000, 283-287: 816-821.
[30] HEO N J, NAGASAKA T, MUROGA T. Recrystallization and precipitation behavior of low-activation V-Cr-Ti alloys after cold rolling [J]. Journal of Nuclear Materials, 2004, 325: 53-60.
[31] CHEN J M, MUROGA T, NAGASAKA T, QIU S Y, LI C, LIANG B, XU Z Y. The mechanical properties of V-4Cr-4Ti in various thermomechanical states [J]. Fusion Engineering and Design, 2006, 81: 2899-2905.
[32] HOELZER D T, ROWCLIFFE A F. Formation of banded microstructure in V-4Cr-4Ti [C]// 6th IEA and JUPITER Joint Workshop on Vanadium Alloys for Fusion Energy Applications. Tucson, Arizona, USA, 2002.
[33] LI Y P, ONODERA E, CHIBA A. Friction coefficient in hot compression of cylindrical sample [J]. Materials Transactions, 2010, 51: 1210-1215.
[34] LI Y P, ONODERA E, MATSUMOTO H, CHIBA A. Correcting the stress-strain curve in hot compression process to high strain level [J]. Metallurgical and Materials Transactions A, 2009, 40: 982-990.
[35] SAMANTARAY D, MANDAL S, BHADURI A K. Constitutive analysis to predict high-temperature flow stress in modified 9Cr-1Mo (P91) steel [J]. Materials and Design, 2010, 31: 981-984.
[36] AHAMED H, SENTHILKUMAR V. Hot deformation behavior of mechanically alloyed Al6063/0.75Al2O3/0.75Y2O3 nano-composite�� A study using constitutive modeling and processing map [J]. Materials Science and Engineering A, 2012, 539: 349-359.
[37] MANDAL S, RAKESH V, SIVAPRASAD P V, VENUGOPAL S, KASIVISWANATHAN K V. Constitutive equations to predict high temperature flow stress in a Ti-modified austenitic stainless steel [J]. Materials Science and Engineering A, 2009, 500: 114-121.
[38] WANG Ying-xin. Study of grain refinement, hot deformation behavior and working technology of Mg-Al alloys [D]. Shanghai: Shanghai Jiao Tong University, 2006. (in Chinese)
[39] LI Zeng-de, CUI Shun, LIN Chen-guang, LI Ming. Recrystallization and kinetics of V-5Cr-5Ti alloy [J]. Chinese Journal of Rare Metals, 2009, 33(6): 785-789. (in Chinese)
[40] GUBIBI A N, ROWCLIFFE A F. Recovery and recrystallization of vanadium alloys [J]. Journal of Nuclear Materials, 1996, 233-237: 497-501.
[41] KURTZ R J, ABE K, CHERNOV V M, HOELZER D T, MATSUI H, MUROGA T, ODETTE G R. Recent progress on development of vanadium alloys for fusion [J]. Journal of Nuclear Materials, 2004, 329-333: 47-55.
[42] SAKAI T, BELYAKOV A, KAIBYSHEV R, MIURA H, JONAS J J. Dynamic and post-dynamic recrystallization under hot, cold and severe plastic deformation conditions [J]. Progress in Materials Science, 2014, 60: 130-207.
[43] HUMPHREYS F J, HATHERLY M. Recrystallization and related annealing phenomena [M]. 2rd Edition. Oxford: Elsevier, 2004.
[44] CHEN X M, LIN Y C, WEM D X, ZHANG J L, HE M. Dynamic recrystallization behavior of a typical nickel-based superalloy during hot deformation [J]. Materials and Design, 2014, 57: 568-577.
[45] ZAEFFERER S, BAUDIN T, PENELLE R. A study on the formation mechanisms of the cube recrystallization texture in cold rolled Fe-36%Ni alloys [J]. Acta Materialia, 2001, 49: 1105-1122.
�����1�������2������Ӣ2���� ��2�����´�1
1. ���������뻯ѧ�ص�ʵ���ң�����621907��
2. �й����������о�Ժ������621900
ժ Ҫ�����õ��µ���ѹ�������о�V-5Cr-5Ti (����������%)�Ͻ����¶�Ϊ1423-1573 K��Ӧ������Ϊ0.01-1 s-1�����µ�����Ӧ������֯�ݻ���Ϊ���������������Ӧ�����������Ħ����������Ħ������m�IJ���ֵΪ0.45-0.56���������Իع鷽����ϵõ��Ͻ��Arrhenius�ͱ������̣���ϼ���Ӧ����ʵ��Ӧ�������Թ�ϵ����R2��ƽ���������ֵ(AARE)�ֱ�Ϊ0.948��5.44%�����ۼ�����Qa��ȡֵ��ΧΪ540-890 kJ/mol��������̬�ٽᾧ(CDRX)�Ͳ�������̬�ٽᾧ(DDRX)��������ѹ���Ͻ��в��档���Ͻ�����Ӧ��Ϊ1.5�������£�Ӧ�������Ļ�����Ȼ�Զ�̬�ظ�(DRV)Ϊ����
�ؼ��ʣ�V-5Cr-5Ti�Ͻ𣻱������̣�����Ӧ������̬�ٽᾧ
(Edited by Mu-lan QIN)
Foundation item: Project (11105127) supported by the National Natural Science Foundation of China
Corresponding author: Yu-fei LI; Tel: +86-816-3620285; E-mail: liyufei034@gmail.com; liyufei903@foxmail.com
DOI: 10.1016/S1003-6326(15)63796-7

