Numerical simulation on effect of heterogeneity on mode �� fracture characteristics of rock
��Դ�ڿ������ϴ�ѧѧ��(Ӣ�İ�)2020���10��
�������ߣ���ƽ ������
����ҳ�룺3063 - 3077
Key words��rock heterogeneity; crack evolution; subcritical crack growth; fracture mechanism
Abstract: Rock is more sensitive to tensile loading than compressive loading, since the tensile strength of rock is much lower than compressive strength. The fracture characteristics of rock in the tensile state are of great significance to the understanding of rock failure mechanisms. To this end, we have conducted numerical simulation researches on mode �� cracking process of rock with varying homogeneity, using the Realistic Failure Process Analysis program. With the increase of homogeneity, cracks are concentrating to the ligament area with a decreasing number of crack bifurcations, and the main crack path is becoming smooth. Crack behaviors and mechanical properties are influenced significantly when the homogeneity index is in the range of 1.5 to 5. When the homogeneity index is greater than 30, they are not affected by rock homogeneity and the rock can be considered as essentially homogeneous. It is considered that the global and local strengths are affected by the distribution of rock mechanical properties at mesoscale, which influence the crack behaviors and mechanical characteristics.
Cite this article as: WANG Jin-tao, ZUO Jian-ping. Numerical simulation on effect of heterogeneity on Mode I fracture characteristics of rock [J]. Journal of Central South University, 2020, 27(10): 3063-3077. DOI: https://doi.org/ 10.1007/s11771-020-4529-1.

J. Cent. South Univ. (2020) 27: 3063-3077
DOI: https://doi.org/10.1007/s11771-020-4529-1

WANG Jin-tao(������)1, ZUO Jian-ping(��ƽ)1,��2
1. School of Mechanics and Civil Engineering, China University of Mining and Technology-Beijing,Beijing 100083, China;
2. State Key Laboratory of Coal Resources and Safe Mining, China University of Mining and Technology-Beijing, Beijing 100083, China
 Central South University Press and Springer-Verlag GmbH Germany, part of Springer Nature 2020
Abstract: Rock is more sensitive to tensile loading than compressive loading, since the tensile strength of rock is much lower than compressive strength. The fracture characteristics of rock in the tensile state are of great significance to the understanding of rock failure mechanisms. To this end, we have conducted numerical simulation researches on mode �� cracking process of rock with varying homogeneity, using the Realistic Failure Process Analysis program. With the increase of homogeneity, cracks are concentrating to the ligament area with a decreasing number of crack bifurcations, and the main crack path is becoming smooth. Crack behaviors and mechanical properties are influenced significantly when the homogeneity index is in the range of 1.5 to 5. When the homogeneity index is greater than 30, they are not affected by rock homogeneity and the rock can be considered as essentially homogeneous. It is considered that the global and local strengths are affected by the distribution of rock mechanical properties at mesoscale, which influence the crack behaviors and mechanical characteristics.
Key words: rock heterogeneity; crack evolution; subcritical crack growth; fracture mechanism
Cite this article as: WANG Jin-tao, ZUO Jian-ping. Numerical simulation on effect of heterogeneity on Mode I fracture characteristics of rock [J]. Journal of Central South University, 2020, 27(10): 3063-3077. DOI: https://doi.org/ 10.1007/s11771-020-4529-1.
1 Introduction
Heterogeneity is an intrinsic property of rock, which is reflected in mineral components and microstructures. For the same rock, the physical and mechanical properties of mineral grains, as well as cementing materials, are considerably different. The size and the spatial distribution of mineral grains and rock pores (cracks) are highly discrete. Intact rock is usually regarded as homogeneous and isotropic materials, and on this basis, its energy evolution [1], deformation characteristics [2], strength criterion [3, 4], etc. are analyzed. However, it has been verified by experiments that effects of heterogeneity on rock deformation and failure mechanism cannot be ignored at mesoscale [5-10] and heterogeneity is considered as the primary cause for mechanical nonlinearity at macro-scale [11]. Numerical simulation is a preferred way to investigate the effects of heterogeneity, by conducting loading tests on heterogeneous numerical models. Most of existing numerical researches focus on the effects of heterogeneity on rock strength [8, 12], stress distribution [13, 14], strain localization [15], time-dependent temperature changes [16], elastic modulus [17, 18], etc. However, crack behaviors of specimens with different homogeneities are rarely investigated.
On the other hand, tensile strength is significantly important in analyses of rock failure because it is much lower than compressive strength and tensile failure is much easier to be triggered. Vague analyses of tensile strength may lead to unreasonable safety assessments of rock engineering. Taking the uniaxial tensile test as an example, stress distribution in a homogeneous specimen is uniform. While for a heterogeneous specimen, the stress field is intricate. TANG et al [19] studied the influence of heterogeneity on the strength characterization of rock under uniaxial tension by numerical simulation. Their results showed that at the cross-section perpendicular to the loading direction, stress varied with position due to the heterogeneous distribution of mechanical properties (elastic modulus, Poisson ratio, etc). Tensile failure of rock is a process of crack initiation, propagation, and coalescence. Therefore, tensile crack behaviors will vary with the heterogeneity. In the framework of fracture mechanics, theoretical and experimental researches on cracking analyze models containing cracks. International Society for Rock Mechanics and Rock Engineering (ISRM) has suggested several experimental methods to determine the rock fracture toughness [20]. All these methods adopt specimens containing preset notches that used to guide cracking position, in which way the failure mode is artificially intervened and the fracture toughness can be further determined. Technically, it is convenient to measure the fracture toughness of rocks though loading test, however, it is much more difficult to experimentally investigate the effects of heterogeneity on crack behaviors and fracture toughness of rocks, because it is hard to perform tests on the same kind of rock with different heterogeneities. Numerical simulation provides an effective approach to investigate crack behaviors of heterogeneous rock specimens containing preset notches.
In this study, the effects of heterogeneity on mode I fracture characteristics have been studied using numerical method. Numerical simulations demonstrate the cracking processes of specimens with different homogeneities, and variations of mechanical properties such as uniaxial tensile strength, elastic modulus, and crack extension resistance are analyzed. Results show that when the homogeneity index is greater than 30, the rock can be considered as totally homogeneous, according to crack behaviors and mechanical responses. With the increase of rock homogeneity, the main crack tends to be smooth and flat, with a decreasing number of crack branches. Mechanical properties improve rapidly when the homogeneity index is in the range of 1.5-5, then they gradually converge to constants as the homogeneity index further increases. The present research deepens the understanding of tensile fracturing characteristics of heterogeneous rock.
2 A brief introduction to numerical method
The realistic failure process analysis (RFPA) program is a finite element method, which has been widely used to simulate the progressive failure of heterogeneous quasi-brittle materials, such as rocks [12, 19, 21-24]. In this paper, RFPA was used to study the effect of heterogeneity on rock fracture characteristics, because of its usability, reliability and avoiding complex additional programming.
The numerical model in RFPA is composed of rectangle elements with uniform size, whose mechanical behaviors are governed by an elastic damage model (Figure 1). In Figure 1, the positive parts of axes denote compression and the negative ones denote tensile. Under uniaxial tensile condition, the damage variable of RFPA elements is expressed as [21]:
 (1)
(1)
where ftr is the residual strength; ��t0 is the strain at peak tensile stress and the threshold strain for tensile damage; ��tu is the ultimate tensile strain; beyond which the element will be completely damaged; E0 is the elastic modulus of the element. The ratio of the residual strength ftr to the uniaxial tensile strength ft0 is defined as residual strength coefficient �� and the ratio of ��tu to ��t0 is defined as ultimate tensile strain coefficient ��. Under uniaxial compressive and shear stress, the damage variable of RFPA elements is expressed as [21]:
 (2)
(2)
where ��c0 is the strain when compressive stress reaches its uniaxial compressive strength fc0 and �� is the residual strength coefficient. The element will be damaged when stress or strain meets certain criteria. There are two criteria programed in RFPA code, the maximum tensile strain (MTS) criterion and the Mohr-Coulomb (MC) criterion. The MTS criterion has the priority in judging the occurrence of damage.
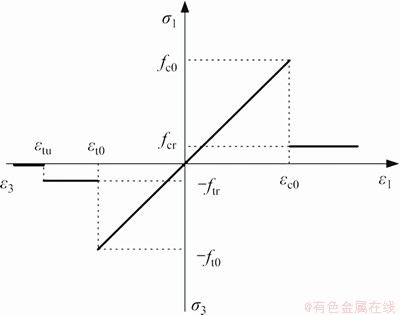
Figure 1 Elastic damage constitutive law of element in RFPA (after Ref. [12])
Once the element failed, the energy stored in the element during loading will be released as acoustic emissions (AE). The energy released is [19] :
 (3)
(3)
where i is the element number; Wi is the released elastic strain energy; E is the elastic modulus; ��1 is the maximum principal stress; ��3 is the minimum principal stress; �� is the Poisson ratio; and V is the element volume. The failure of a single element is regarded as one AE activity. Therefore, the AE count is the number of the failed elements.
In order to realize material heterogeneity, Weibull distribution model is introduced to characterize the distributions of mechanical properties of RFPA elements. The probability density function of Weibull distribution is shown below:
 (4)
(4)
where �� is the mechanical parameters (elastic modulus, strength and Poisson ratio) of RFPA elements; ��0 is the scale parameter of Weibull distribution function, which is related to the average mechanical parameters of elements; m is the shape parameter of Weibull distribution function, also called homogeneity index in the RFPA, which reflects the heterogeneity of the numerical model. The larger the m, the more homogeneous the model. Taking ��0=200 as an example, we plot the probability density function of Weibull distribution in Figure 2. With a smaller m, the �� spreads out over a wider range, which means the numerical model is more heterogeneous. Thus, by simply changing m, the heterogeneity can be achieved expediently in RFPA code, without complex programming.
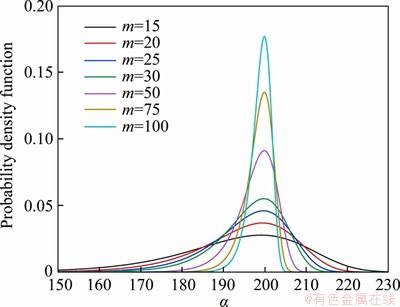
Figure 2 Probability density function of Weibull distribution (��0=200)
3 Numerical model and boundary conditions
In the present research, 2D uniaxial tensile models with double notches were generated in the RFPA. The numerical model (Figure 3) was 300 mm long and 100 mm wide, which was meshed into 200��600=120000 elements. Two straight notches are set at the middle of the long edges of the numerical model. The sizes of the model and the notches were shown in Figure 3 in which the elastic moduli of elements were represented by different colors. Uniaxial tensile tests were conducted with a loading rate of 0.0005 mm/step. Load was applied at the upper boundary of the numerical model and the lower boundary was fixed. In order to investigate the effects of heterogeneity on fracture characteristics of rock, mechanical parameters were kept consistent in each numerical model and the homogeneity index varied. Element mechanical parameters used in this research were listed in Table 1, which was the same as HUANG et al [22] research, except homogeneity index m. These parameters had been used to study the influence of heterogeneity on rock failure with pre-existing crack in uniaxial compression [22].
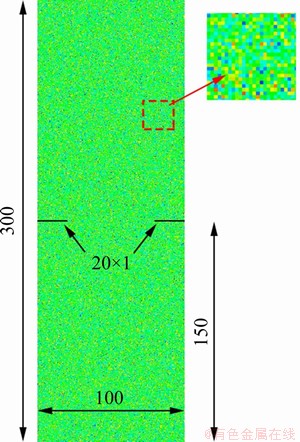
Figure 3 Numerical model and its size (unit: mm)
4 Effects of rock homogeneity on crack behaviors
4.1 Cracking process
In this paper, 12 uniaxial tensile models with different homogeneity indices m (Table 1) were established and loaded in the RFPA. For all numerical models, the cracking process included three stages: crack initiation, stable propagation, and unstable propagation. Taking m=1.5 as an example, Figure 4 shows the crack propagation process, in which the color identified the maximum principal stress. Figure 5 shows the stress-strain curve and AE counts in each loading step. Sub-figures in Figure 4 corresponded to the circular marks on the stress-strain curve in Figure 5. In the initial loading stage, although stress concentrated at the tip of the preset notches (Figure 4(a)), the stress did not reach the minimum tensile strength of the elements near the notch tip. In this stage, the macro-mechanical behaviors of rocks showed linear elastic characteristics (Figure 5), because the constitutive relationship of the numerical model was linear elastic (Figure 1) and few elements were failed. As stress continued to increase, acoustic emissions gradually increased, which meant an increasing number of microcracks inside the rock. As shown in Figure 4(b), most of microcracks were concentrated near the tip of the preset notch. The number of microcracks was too small to control the macroscopic mechanical properties of rock, therefore, the stress-strain curve was still linear (Figure 5). As the number of microcracks continued to increase, microcracks began to coalesce into macro-crack (Figure 4(c)) and AE counts increased. Stress dropped sharply after it reached the peak and macro-crack propagated unstably. Simulation results shown in Figure 4 agreed with CHEN et al��s [25] numerical research.
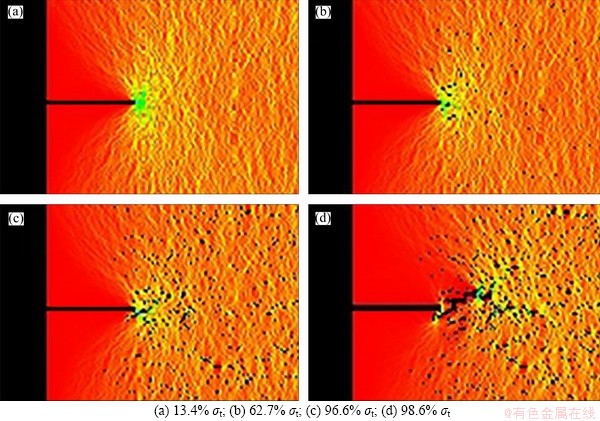
Figure 4 Crack propagation process (m=1.5):
Table 1 Mechanical parameters of numerical model
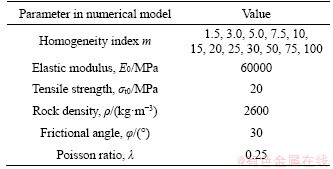
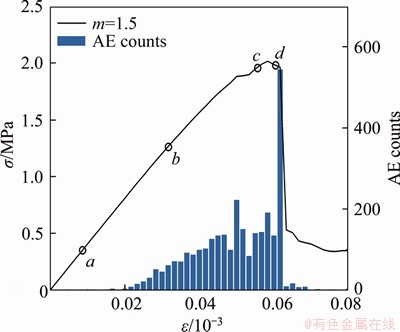
Figure 5 Stress-strain curve and AE counts (m=1.5)
Figure 6 shows the cracking processes of numerical models, in which the homogeneity index m was 1.5, 5.0, 10 and 20, respectively. When the homogeneity index m was greater than 30, cracking processes seemed identical. For all numerical models, the macro-cracks initiated at the tips of the preset notches and propagated in the direction perpendicular to load. When m was lower than 5.0 (Figures 6(a) and (b)), macro-cracks were in zigzag shapes and tended to bifurcate, because element strength was discrete and microcracking occurred randomly in the ligament area. In addition to the ligament area, microcracks also appeared in other parts of the specimen. With the improvement of the rock homogeneity, the micro-cracks gradually gathered in the ligament area, and the macro-crack gradually became flat. When homogeneity index m was greater than 10 (Figures 6(c) and (d)), except for the macro-crack tip area, microcracks no longer appeared in other parts of the rock, and the macro-crack was approximately a straight line with no bifurcations. The color in Figure 6 indicated the maximum principal stress. For the numerical model that m=1.5, the profile of the stress concentration area was neither regular nor clear (Figure 6(a)), because elastic moduli of elements were discrete and stresses in the adjacent elements were significantly different. Meanwhile, strengths of elements near the crack tip were discrete and the overall strength of the crack tip region was low, therefore, the stress concentration was at a low level. With the increase in homogeneity, discreteness of element strengths and elastic moduli decreased and the overall strength of the crack tip region enhanced, therefore, the stress concentrated with a more regular and clear profile. It has been stated by TANG et al [11] that fracture initiation should be viewed as the combined effect of local stress fluctuations and the local stress concentrators. As Figure 6 demonstrated, with the enhancement of homogeneity, fracture tended to initiate at the tip of the preset notch, which indicated that local stress concentration induced by preset notch was becoming the dominant factor, replacing the stress fluctuation caused by rock heterogeneity. In their experimental researches, ZUO et al [26] observed in-situ cracking processes of Longmaxi shale and Beishan granite [9] under a scanning electron microscope. In terms of microstructure, Longmaxi shale is finer than Beishan granite, with less granular particles and more cementing materials. Besides, the strength of Lonmaxi shale shows less discreteness than that of Beishan granite. Therefore, Longmaxi shale is considered more homogeneous than Beishan granite. The stress-induced crack in shale (Figure 7(a)) was smoother than that in granite (Figure 7(b)), and accompanied by few branches. The changing trend of crack morphology with rock homogeneity in Figure 6 was in accordance with the experimental results shown in Figure 7. Simulation result in Figure 6 indicated that stress tended to induce rougher rupture planes in a more heterogeneous rock, and it could be empirically used in evaluating rock mass properties by joint roughness which had significant influences on mechanical properties and deformation behavior of rock masses [27].
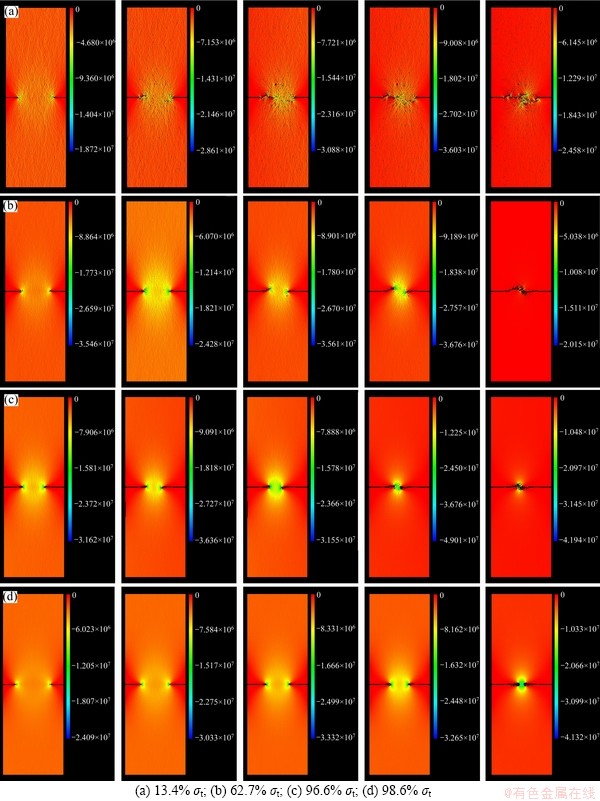
Figure 6 Crack propagation process in different homogeneity cases:
4.2 Subcritical crack length during tensile loading
It is found that significant rates of crack extension can occur at values of stress intensity factor that can be substantially below the fracture toughness KC, which is known as subcritical crack growth [28], and it has drawn substantial attentions [28-32]. Phenomenally, subcritical crack growth refers to the cracking process from crack initiation to unstable propagation. Subcritical crack length ��a during tensile loading is demonstrated in Figure 8,in which the curve slope identified the crack velocity. In all simulations, the subcritical crack length ��a grew slowly and then rapidly during loading. Thus, although the subcritical crack growth was also known as the stable crack growth [33], the crack growth rate was not ��stable��, and it increased gradually in fluctuation which weakened as the homogeneity index m enhanced. Curve slopes in Figure 8 indicated that the subcritical crack growth rate was considerably affected by the rock homogeneity when m was lower than 5 (Figure 8(a)). Curve slopes were very similar when m was greater than 5 (Figures 8(b) and (c)), which indicated that the subcritical crack growth rate was insensitive to the rock homogeneity. Affected by the randomness of the element strength distribution, subcritical crack lengths in Figure 8 might intersect or overlap, however, it did not influence the overall trend.

Figure 7 Crack morphologies of two rocks under scanning electron microscope:
When subcritical crack length reached its maximum ��amax, the crack would propagate unstably, and the ��amax was called critical crack length. The ��amax decreased sharply as the homogeneity index m increased from 1.5 to 5.0 (Figure 9). When m=1.5, the critical crack was the longest, which was 38.1 mm and accounted for 63.5% of the rock ligament length alig. The critical crack length ��amax was insensitive to the rock homogeneity when 5.0��m��25. In m��30 cases, the rock was relatively homogeneous and the ��amax only accounted for 22% of the rock ligament length ��amax. Changes of critical crack lengths in Figure 9 indicated that the more homogeneous the rock properties, the shorter the crack propagated before its unstable growth. In other words, if the subcritical crack growth was simply taken as the precursor of rock failure, it should be cautious because ��amax for homogeneous rocks was very short.
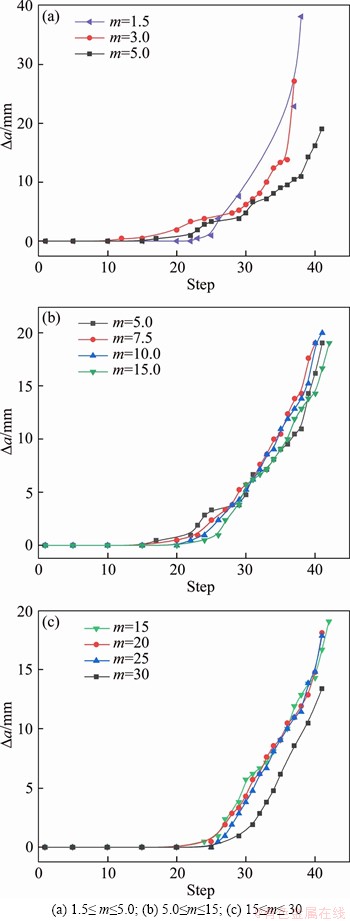
Figure 8 Subcritical crack length during loading:
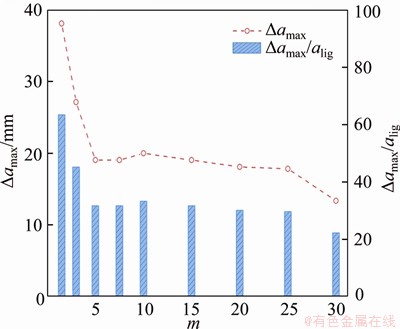
Figure 9 Variation of rock critical growth length with homogeneity index
4.3 R curves
The R curve shows the crack extension resistance of materials. In the context of the linear elastic fracture mechanics (LEFM), the R-curve is characterized in terms of KI (��a), i.e., the value of mode-I stress intensity factor (SIF) needed to sustain crack growth [34]. The SIF expression for the numerical model is [35]:

 (5)
(5)
where KI is the stress intensity factor; �� is the nominal stress; a is the crack length; b is the half width of the specimen; and F(a/b) is the shape function. Based on the subcritical crack length in Figure 8 and the corresponding nominal tensile stress, crack extension resistance KR during loading was calculated by using Eq. (5) and demonstrated in Figure 10. When m>30, R curves coincided with the m=30 curve.
According to YANG et al��s research [36], the relationship between the crack growth rate and crack extension resistance is:
 (6)
(6)
where a is crack length, and KR is the crack extension resistance. n and �� are parameters related to material properties. Integrating Eq. (6) leads to [36]
 (7)
(7)
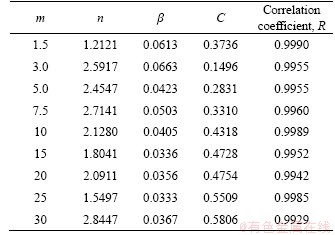
where the item a-a0 is ��a in Figure 8 and KC is the fracture toughness. Point marks in Figure 10 were numerical results and solid lines were fitting curves based on Eq. (7). Table 2 shows the fitting parameters in different cases, where the correlation coefficient R indicates that simulation results agree well with the theoretical formula.
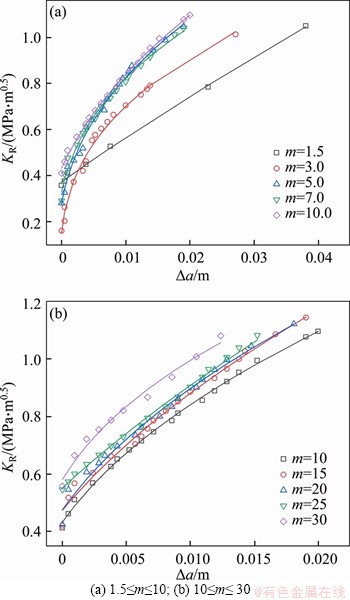
Figure 10 Resistance curve of crack growth in different homogeneity cases:
As shown in Figure 10, no matter how homogeneous the rock was, the crack extension resistance increased with the crack propagation. At the same ��a, the crack extension resistance enhanced with the increase of homogeneity because the average strength of elements at the crack tip was higher for a more homogeneous rock. It was worth noting that the spacing between R curves was decreasing as m increased from 1.5 to 25, especially in the range of 5.0��m��25, which indicated that the crack extension resistance was becoming less sensitive to rock homogeneity. Curve slopes in Figure 10 represent the growth rate of crack extension resistance. Except for m=1.5 case, at the beginning of crack propagation, the crack extension resistance enhanced rapidly. As the crack propagated, the growth of resistance slowed down. In the case of m=1.5, the R curve seemed to be a straight line due to less data, which was obviously different from others. This was because a mass of microcracks interconnected during subcritical crack growth (Figures 4(c) and (d)) and the crack growth quickly reached a critical state.
Table 2 Fitting parameters of Eq. (7) in different numerical simulations
5 Effects of rock homogeneity on macro- mechanical properties
5.1 Stress-strain curve and uniaxial tensile strength
When the homogeneity index m��30, stress- strain curves coincided. Figure 11 demonstrates the stress-strain curves of rock specimens that 1.5��m�� 30. Under uniaxial tensile loading, all of rock specimens underwent linear elastic, yielding and post-peak stages. The differences between stress- strain curves were that the yielding stage in the stress-strain curve became shorter as the homogeneity increased. When m was higher than 30, the yielding stage was barely recognized and rock specimens failed directly after linear elastic stage. In m=1.5 and m=3.0 cases, residual strength existed. No matter how homogeneous the rock was, brittle failure was evident under uniaxial tensile loading, which was consistent with experimental results by LIU et al [37] and HASHIBA et al [38].
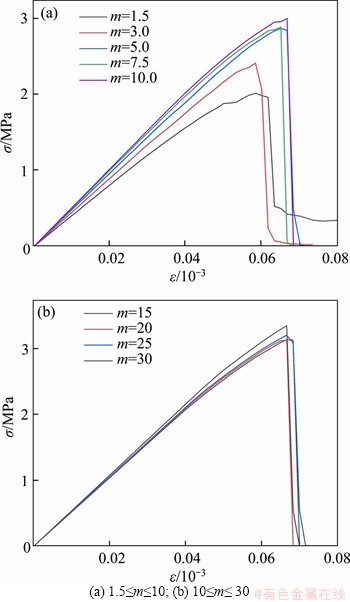
Figure 11 Stress-strain curves in different homogeneity cases:
Changes of uniaxial tensile strength ��t and elastic modulus E with rock homogeneity are demonstrated in Figure 12. In the range of 1.5��m��5.0, ��t and E enhanced dramatically, then they converged to 3.35 MPa and 53.95 GPa, respectively. The trend in Figure 12 was similar to previous researches by ZHU et al [21] and LUO et al [39], in which the numerical rock specimens were uniaxially compressed. From the changes of ��t and E with respect to m, numerical models could be regarded as homogeneous in m��30 cases because mechanical parameters were strongly concentrated in a small range near ��0 and there were very few elements with high or low strength. It should be pointed out that the homogeneity had slightly different effects on uniaxial tensile strength and elastic modulus. When m��30, ��t and E were 1.66 and 1.33 times as much as those in m=1.5 case, respectively.
5.2 Initial cracking toughness and unstable fracture toughness
To predict the crack propagation during the fracture process in quasi-brittle materials, a double-K criterion was proposed by XU et al [40]. The crack will initiate when the stress intensity factor reaches the initial cracking toughness  , and it will propagate unstably when the stress intensity factor reaches the unstable fracture toughness
  The initial cracking toughness can be evaluated by substituting the initial cracking load and the preset notch length a0 into Eq. (5). Similarly, the unstable fracture toughness
  can be obtained by substituting the peak load and the corresponding crack length into Eq. (5). Variations ofandwith homogeneity index m are shown in Figure 13. In all numerical models, the preset notch length a0 was the same and the initial cracking toughness was only related to the initial cracking stress, according to Eq. (5). The more heterogeneous, the more likely crack to initiate. This was because when homogeneity index m was low, elastic moduli of elements near the preset notch varied significantly, which induced the stress fluctuations. On the other hand, there were more low strength elements in the vicinity of the preset notch tip when the rock was relatively heterogeneous, which were easy to be broken. Therefore, the initial cracking toughness enhanced with the rock homogeneity in the range of 1.5��m��30. When m was higher than 30, the initial cracking toughness remained constant, which was about 9 times as much as that of m=1.5 case. The unstable fracture toughnesswas determined by both UTS (Figure 12(a)) and the critical crack length (Figure 9), according to Eq. (5). The increase of UTS and the decrease of the critical crack length with rock homogeneity were not strictly monotonous in the range of 1.5��m��25, therefore, the increased in fluctuations. When m��30, the critical crack length exerted a more significant influence on than the UST did and the reduced to 1.08 MPa��m0.5. As the homogeneity index m increased, the proportion of to enhanced from 7% to 60.5%, then remained constant (Figure 13). So, in the range of 1.5�� m ��30, the residual capacity of resisting crack after initial cracking was decreasing, which should be paid more attention to in engineering.
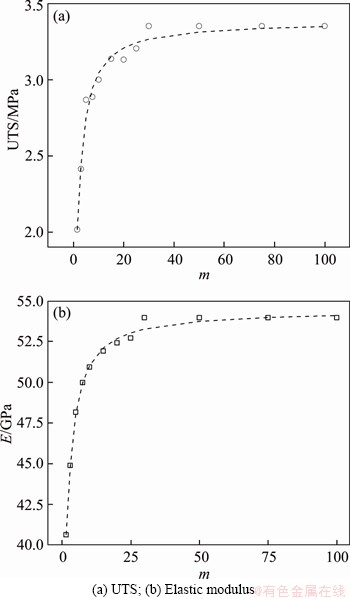
Figure 12 Variations of UTS and elastic modulus with homogeneity index m:
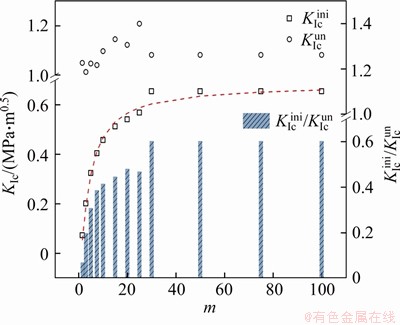
Figure 13 Variation of initial toughness and unstable fracture toughness with homogeneity index
5.3 Acoustic emissions and damage evolutions
In the failure process, crack developments are accompanied by acoustic emission activities that are generated by the release of elastic energy. At a certain moment, more acoustic emissions mean more microcracks. Figure 14 demonstrates the acoustic emission activities of different models during tensile loading, where histograms characterize AE counts in each loading step, dash lines show the normalized AE accumulated counts,and circular-arrow marks identify the normalized AE accumulations before peak stress in Figure 11. For heterogeneous rocks (m<5.0), AE activities were scattered during the whole loading process and could be found in the early loading stages. As the rock became less heterogeneous (5.0��m<30), AE activities were becoming less scattered. When the homogeneity index m��30, AE activities were identical for different models and strongly concentrated near the peak stress region. With the increase of the homogeneity index m, the proportion of the AE accumulative counts before the peak stress was gradually decreasing from 68% (m=1.5) to 7% (m=30). In their numerical research, TANG et al [11] conducted uniaxial compression tests on numerical rock specimens with different homogeneity indices and classified AE activity patterns into three groups: swarm shocks, pre-main shocks, and main shocks. According to the distribution of AE counts in Figure 14, when m<3.0, AE activity patterns were swarm shocks, of which the distribution of AE counts was obviously discrete. AE activity patterns in 3.0��m��5.0 cases were pre-main shocks, of which the AE activities were distributed in a narrow region and could be detected both before and after peak stress. When m>5.0, AE activity patterns were main shocks, of which only a few AE events could be detected before peak stress and few AE events occurred after peak stress. Results in Figure 14 indicate that the more homogeneous the rock, the less distinct the precursor before unstable failure, which is consistent with phenomena demonstrated in stress-strain curves (Figure 11) and failure processes (Figure 6).
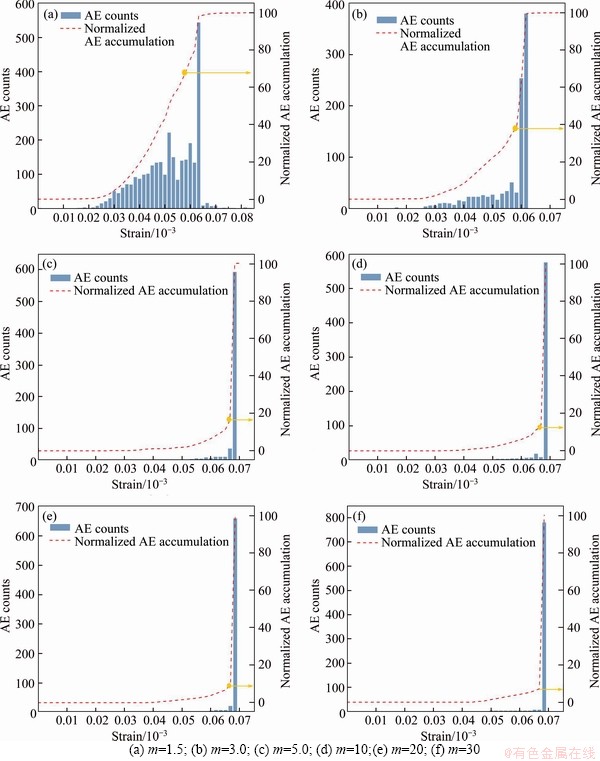
Figure 14 Acoustic emission counts and accumulated counts during loading:
The energy released in a single element failure was calculated though Eq. (3). Here, we defined the damage factor as:
 (8)
(8)
where Ws is the energy released in loading step s; ��Ws is the accumulative AE energy until loading step s, and Wt is the total AE energy released during the loading process. In this manner, the damage evolution could be obtained and demonstrated in Figure 15.
For all numerical rock specimens, no damage took place in the very beginning of tensile loading. As the load continued, the damage appeared and experienced two stages of slow growth and rapid growth. For numerical models of m=1.5 and m=3.0, the slow growth stage was more distinct. When m was larger than 5.0, the damage evolution curves were close to each other and smoother than those of m��5 cases. Fluctuations in damage evolution curves were related to the released energy in each loading step, and the later was determined by the rock mechanical properties. Due to discrete distribution of the elastic modulus and tensile strength in relatively heterogeneous models, the energy released in each loading step varied significantly. Figure 16 shows the strains when the damage first appears, which are denoted as ��ini. Variations of ��ini with homogeneity index m indicated that more homogeneous rocks could bear more deformations before the occurrence of damage because average strength of elements enhanced with the increase of rock homogeneity.
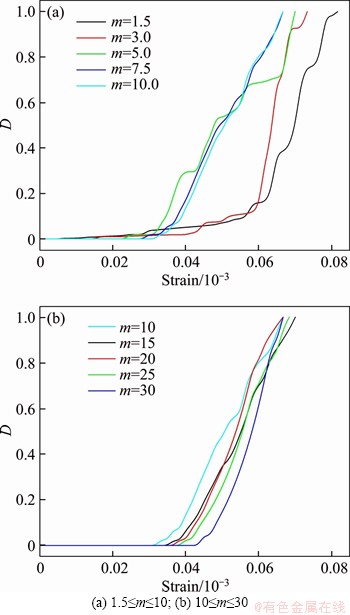
Figure 15 Damage evolutions of different numerical models:
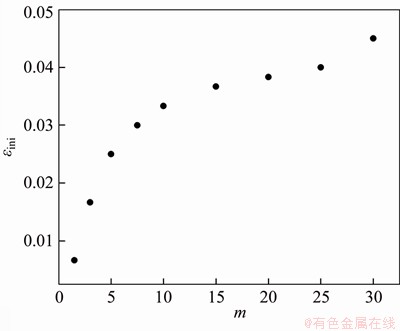
Figure 16 Strains corresponding to the initial damage in different numerical models
6 Conclusions
Based on the assumption that rock mechanical parameters followed Weibull distribution, we conducted uniaxial tensile loading tests on numerical specimens that contained mode I cracks, and demonstrated the cracking processes of specimens with different homogeneity indices. Effects of rock heterogeneity on crack behaviors and macro-mechanical properties were analyzed. The following conclusions were obtained:
1) With the improvement of rock homogeneity, the microcracks gradually concentrate in the ligament area, and the main cracks become flatter with less branches. With increases in homogeneity, the profile of stress concentration area become clearer and more regular, which indicates that local stress concentration induced by preset notch is becoming the dominant factor, replacing the stress fluctuation caused by rock heterogeneity.
2) Before unstable crack propagation, the subcritical crack length grows slowly first and then rapidly. When the homogeneity index is lower than 5, the subcritical crack growth rate is considerably affected by the rock homogeneity and the critical crack length decreases sharply as the rock homogeneity improves. When the rock homogeneity index is in the range of 5-30, the subcritical crack length is insensitive to the rock homogeneity and the critical crack length decreases slowly.
3) When the homogeneity index increases in the range of 1.5-5, the uniaxial tensile strength, elastic modulus and initial cracking toughness increase rapidly. Subsequently, they gradually converge to 3.35 MPa, 53.95 GPa and 0.65 MPa��m0.5, respectively, as the homogeneity index approaches to 30.
4) Acoustic emission activity patterns are classified into three groups: swarm shocks (m<3), pre-main shocks (3��m��5) and main shocks (m>5), which indicates that the more homogeneous the rock, the less distinct the precursor before unstable failure. The evolution of damage factor that determined by AE energy experiences two stages of slow growth and rapid growth. The damage evolution indicates that a more homogeneous rock can bear more deformations before the initial damage occurred.
5) The influence of rock heterogeneity on mode �� fracturing characteristics is due to the discrete distribution of rock mechanical properties, especially the strength and elastic modulus near the crack tip. The average strength of crack tip area improves with the rock homogeneity, which leads to the difficulty in crack initiation and propagation, and enhances the rock tensile strength. When the homogeneity index is greater than 30, the rock can be considered as totally homogeneous, according to crack behaviors and mechanical responses.
Contributors
WANG Jin-tao conducted the numerical simulation and wrote the first draft of the manuscript. ZUO Jian-ping provided the ideas and edited the draft of the manuscript.
Conflict of interest
WANG Jin-tao and ZUO Jian-ping declare that they have no conflict of interest.
References
[1] GONG Feng-qiang, LUO Song, YAN Jing-yi. Energy storage and dissipation evolution process and characteristics of marble in three tension-type failure tests [J]. Rock Mechanics and Rock Engineering, 2018, 51(11): 3613-3624. DOI: 10.1007/s00603-018-1564-4.
[2] GONG Feng-qiang, WU Chen. Identifying crack compaction and crack damage stress thresholds of rock using load�Cunload response ratio (LURR) theory [J]. Rock Mechanics and Rock Engineering, 2020, 53(2): 943-954. DOI: 10.1007/s00603-019-01936-z.
[3] ZUO Jian-ping, LIU Hui-hai, LI Hong-tao. A theoretical derivation of the Hoek�CBrown failure criterion for rock materials [J]. Journal of Rock Mechanics and Geotechnical Engineering, 2015, 7(4): 361-366. DOI: 10.1016/j.jrmge. 2015.03.008.
[4] ZUO Jian-ping, LI Hong-tao, XIE He-ping, JU Yang, PENG Su-ping. A nonlinear strength criterion for rock-like materials based on fracture mechanics [J]. International Journal of Rock Mechanics and Mining Sciences, 2008, 45(4): 594-599. DOI: 10.1016/j.ijrmms.2007.05.010.
[5] CHEN Bin, XIANG Jian-sheng, LATHAM J P, BAKKER R R. Grain-scale failure mechanism of porous sandstone: An experimental and numerical FDEM study of the Brazilian Tensile Strength test using CT-Scan microstructure [J]. International Journal of Rock Mechanics and Mining Sciences, 2020, 132: 104348. DOI: 10.1016/ J.IJRMMS.2020.104348.
[6] LIU Guang, CAI Ming, HUANG Ming. Mechanical properties of brittle rock governed by micro-geometric heterogeneity [J]. Computers and Geotechnics, 2018, 104: 358-372. DOI: 10.1016/j.compgeo.2017.11.013.
[7] LIU Tao-ying, ZHANG Chao-yang, CAO Ping, ZHOU Ke-ping. Freeze-thaw damage evolution of fractured rock mass using nuclear magnetic resonance technology [J]. Cold Regions Science and Technology, 2020, 170: 102951. DOI: 10.1016/j.coldregions.2019.102951.
[8] TAN Xin, KONIETZKY H, CHEN Wei. Numerical simulation of heterogeneous rock using discrete element model based on digital image processing [J]. Rock Mechanics and Rock Engineering, 2016, 49(12): 4957-4964. DOI: 10.1007/s00603-016-1030-0.
[9] ZUO Jian-ping, WANG Jin-tao, SUN Yun-jiang, CHEN Yan, JIANG Guang-hui, LI Yan-hong. Effects of thermal treatment on fracture characteristics of granite from Beishan, a possible high-level radioactive waste disposal site in China [J]. Engineering Fracture Mechanics, 2017, 182: 425-437. DOI: 10.1016/j.engfracmech.2017.04.043.
[10] ZUO Jian-ping, XIE He-ping, DAI Feng, JU Yang. Three-point bending test investigation of the fracture behavior of siltstone after thermal treatment [J]. International Journal of Rock Mechanics and Mining Sciences, 2014, 70: 133-143. DOI: 10.1016/j.ijrmms.2014.04.005.
[11] TANG Chun-an, HUDSON A J. Rock failure mechanisms: illustrated and explained [M]. Boca Raton: CRC Press, 2010. DOI: 10.1201/b10997.
[12] XU Ying, YAO Wei, XIA Kai-wen. Numerical study on tensile failures of heterogeneous rocks [J]. Journal of Rock Mechanics and Geotechnical Engineering, 2020, 12(1): 50-58. DOI: 10.1016/j.jrmge.2019.10.002.
[13] LAN Heng-xing, MARTIN C D, HU Bo. Effect of heterogeneity of brittle rock on micromechanical extensile behavior during compression loading [J]. Journal of Geophysical Research, 2010, 115(B1). DOI: 10.1029/ 2009JB006496.
[14] CHEN Hong-ran, XUE Lei. Numerical investigation on progressive fracture behaviours of macroscopic heterogeneous rock bridge [J]. European Journal of Environmental and Civil Engineering, 2020, 24(5): 603-619. DOI: 10.1080/19648189.2017.1410728.
[15] GARDNER R, PIAZOLO S, EVANS L, DACZKO N. Patterns of strain localization in heterogeneous, polycrystalline rocks-A numerical perspective [J]. Earth and Planetary Science Letters, 2017, 463: 253-265. DOI: 10.1016/j.epsl.2017.01.039.
[16] RADIOTI G, CERFONTAINE B, CHARLIER R, NGUYEN F. Experimental and numerical investigation of a long- duration thermal response test: Borehole heat exchanger behaviour and thermal plume in the heterogeneous rock mass [J]. Geothermics, 2018, 71: 245-258. DOI: 10.1016/ j.geothermics.2017.10.001.
[17] LI Ang, SHAO Guo-jian, SU Jin-bo, SUN Yang, YU Tian-tang, SHI Hou-gai. Influence of heterogeneity on mechanical and acoustic emission behaviours of stratified rock specimens [J]. European Journal of Environmental and Civil Engineering, 2018, 22(sup1): s381-s414. DOI: 10.1080/19648189.2017.1373709.
[18] KARIMPOULI S, FARAJI A, BALCEWICZ M, SAENGER E H. Computing heterogeneous core sample velocity using Digital Rock Physics: A multiscale approach [J]. Computers & Geosciences, 2020, 135: 104378. DOI: 10.1016/J.CAGEO.2019.104378.
[19] TANG C A, THAM L G, WANG S H, LIU H, LI W H. A numerical study of the influence of heterogeneity on the strength characterization of rock under uniaxial tension [J]. Mechanics of Materials, 2007, 39(4): 326-339. DOI: 10.1016/j.mechmat.2006.05.006.
[20] ULUSAY R. The ISRM suggested methods for rock characterization, testing and monitoring: 2007-2014 [M]. Cham: Springer, 2014. DOI: 10.1007/978-3-319-07713-0.
[21] ZHU W C, TANG C A. Micromechanical model for simulating the fracture process of rock [J]. Rock Mechanics and Rock Engineering, 2004, 37(1): 25-56. DOI: 10.1007/ s00603-003-0014-z.
[22] HUANG M L, WONG R H C, WANG S Y, TANG C A, JAIO R M. Numerical studies of the influence of heterogeneity on rock failure with pre-existing crack in uniaxial compression [J]. Key Engineering Materials, 2004, 261-263: 1557-1562. DOI: 10.4028/www.scientific.net/ KEM.261-263.1557.
[23] TANG C A, LIU H, LEE P K K, TSUI Y, THAM L G. Numerical studies of the influence of microstructure on rock failure in uniaxial compression-Part I: Effect of heterogeneity [J]. International Journal of Rock Mechanics and Mining Sciences, 2000, 37(4): 555-569. DOI: 10.1016/S1365- 1609(99)00121-5.
[24] ZHANG Shi-chao, MA Tian-hui, TANG Chun��an, JIA Peng. Microseismic monitoring and experimental study on mechanism of delayed rockburst in deep-buried tunnels [J]. Rock Mechanics and Rock Engineering, 2020, 53(6): 2771-2788. DOI: 10.1007/S00603-020-02069-4.
[25] CHEN Tie-lin, LI Chao, ZHANG Ding-li. A numerical simulation of effects of softening and heterogeneity on the stress intensity factor of quasi-brittle material [J]. Advances in Mechanical Engineering, 2015, 6: 586472. DOI: 10.1155/2014/586472.
[26] ZUO Jian-ping, LU Jing-fang, GHANDRIZ, R, WANG Jin-tao, LI Yan-hong, ZHANG Xiao-yan, LI Jun, LI Hong-tao. Mesoscale fracture behavior of Longmaxi outcrop shale with different bedding angles: Experimental and numerical investigations [J]. Journal of Rock Mechanics and Geotechnical Engineering, 2020, 12(2): 297-309. DOI: 10.1016/j.jrmge.2019.11.001.
[27] YONG Rui, YE Jun, LI Bo, DU Shi-gui. Determining the maximum sampling interval in rock joint roughness measurements using Fourier series [J]. International Journal of Rock Mechanics and Mining Sciences, 2018, 101: 78-88. DOI: 10.1016/j.ijrmms.2017.11.008.
[28] ATKINSON B K. Subcritical crack growth in geological materials [J]. Journal of Geophysical Research: Solid Earth, 1984, 89(B6): 4077-4114. DOI: 10.1029/JB089iB06p04077.
[29] VOLKOV G S, SOPENKO S I. A method of the complex evaluation of the crack resistance of rock in the stage of subcritical crack growth [J]. Strength of Materials, 1987, 19(10): 1352-1358. DOI: 10.1007/BF01523234.
[30] HAO Rui-qing, LI Jiang-teng, CAO Ping, LIU Bo, LIAO Jun. Test of subcritical crack growth and fracture toughness under water-rock interaction in three types of rocks [J]. Journal of Central South University, 2015, 22(2): 662-668. DOI: 10.1007/s11771-015-2568-9.
[31] ZUO Jian-ping, LI Yu-lin, ZHANG Xiao-yan, ZHAO Zhi-hong, WANG Ting-zheng. The effects of thermal treatments on the subcritical crack growth of Pingdingshan sandstone at elevated high temperatures [J]. Rock Mechanics and Rock Engineering, 2018, 51(11): 3439-3454. DOI: 10.1007/s00603-018-1527-9.
[32] NARA Y, KOIKE K, YONEDA T, KANEKO K. Relation between subcritical crack growth behavior and crack paths in granite [J]. International Journal of Rock Mechanics and Mining Sciences, 2006, 43(8): 1256-1261. DOI: 10.1016/ j.ijrmms.2006.03.016.
[33] MUNZ D, FETT T. Subcritical crack growth [C]// Ceramics: Mechanical Properties, Failure Behaviour, Materials Selection. Berlin: Springer Berlin Heidelberg, 1999: 77-108. DOI: 10.1007/978-3-642-58407-7_5.
[34] ZEHNDER A T. Fracture mechanics [M]. Dordrecht: Springer, 2012. DOI: 10.1007/978-94-007-2595-9.
[35] TADA H, PARIS P C, IRWIN G R. The stress analysis of cracks handbook [M]. New York: ASME Press, 2000. DOI: 10.1115/1.801535.
[36] YANG Ji-yun, ZHANG Xing. Mathematical research on the relation between resistance curve of crack growth and residual strength [J]. Journal of Mechanical Strength, 2003, 25(3): 334-339. http://www.jxqd.cbpt.cnki.net/WKE/WebP ublication/paperDigest.aspx?paperID=8a030f39-14fc-48d4-84d5-f028db6b3e7c. (in Chinese)
[37] LIU Chuan-cheng, ZHANG Qiang-yong, XIANG Wen, ZHOU Xin-yu. Experimental study on characteristics and mechanism of macrography and mesoscopic failure of deep granite from beishan [J]. Geotechnical and Geological Engineering, 2020, 38: 3815-3830. DOI: 10.1007/s10706- 020-01260-2.
[38] HASHIBA K, FUKUI K. Effect of water on the deformation and failure of rock in uniaxial tension [J]. Rock Mechanics and Rock Engineering, 2015, 48(5): 1751-1761. DOI: 10.1007/s00603-014-0674-x.
[39] LUO Rong, ZENG Ya-wu, CAO Yuan, LI Ling. Research on influence of inhomogeneity degree on mechanical parameters of inhomogeneous rock [J]. Rock and Soil Mechanics, 2012, 33(12): 3788-3794. http://ytlx.whrsm.ac. cn/CN/Y2012/V33/I12/3788. (in Chinese)
[40] XU Shi-lang, REINHARDT H W. Determination of double-Determination of double-K criterion for crack propagation in quasi-brittle fracture Part I: experimental investigation of crack propagation [J]. International Journal of Fracture, 1999, 98(2): 111-149. DOI: 10.1023/A: 1018668929989.
(Edited by HE Yun-bin)
���ĵ���
�Ǿ����Զ���ʯ���Ͷ�������Ӱ�����ֵģ���о�
ժҪ��������ʯ�Ŀ���ǿ��Զ�����俹ѹǿ�ȣ����������ر�ѹ�����ظ������С�����о������������ʯ�Ķ������Զ�������������ʯ���ƻ����ƾ�����Ҫ���塣���о��У�����������ʯ�ƻ����̷���ϵͳRFPA���Բ�ͬ���ʶ���ʯ����������չ����չ�����о���������ʯ���ʳ̶ȵ���ߣ����������ʹ������У��������Ʒֲ����٣�����������ƽ���������ʶ���1.5~5�����ڣ���ʯ������Ϊ����ѧ�����ܾ��ʶȵ�Ӱ��Ƚ����ء������ʶȴ���30ʱ�����������ܾ��ʶȲ����Ӱ�죬��ʱ��ʯ�ɻ�������Ϊ�Ǿ��ʲ��ϡ�ϸ�۳߶�����ʯ��ѧ���ʷֲ�Ӱ������ʯ����;ֲ�ǿ�ȣ�����Ӱ����������Ϊ��
�ؼ��ʣ���ʯ�����ԣ������ݻ������ٽ�������չ�����ѻ���
Foundation item: Project(BJJWZYJH01201911413037) supported by the Beijing Outstanding Young Scientist Program, China; Projects(51622404, 41877257) supported by the National Natural Science Foundation of China; Project (2018SMHKJ-A-J-03) supported by Shaanxi Coal Group Key Project, China
Received date: 2020-06-18; Accepted date: 2020-08-27
Corresponding author: ZUO Jian-ping, PhD, Professor; Tel: +86-10-62331358; E-mail: zjp@cumtb.edu.cn; ORCID: https://orcid.org/ 0000-0002-5547-089X

