
J. Cent. South Univ. (2019) 26: 3057-3065
DOI: https://doi.org/10.1007/s11771-019-4236-y

OMHT method for weak signal processing of GPR and its application in identification of concrete micro-crack
LING Tong-hua(��ͬ��)1, ZHANG Liang(����)1, 2, HUANG Fu(�Ƹ�)1,GU Dan-ping(�ȵ�ƽ)1, YU Bin(���)1, ZHANG Sheng(��ʤ)3
1. School of Civil Engineering, Changsha University of Science and Technology, Changsha 410114, China;
2. Hunan Province Engineering Laboratory of Bridge Structure, Changsha University of Science and Technology, Changsha 410114, China;
3. College of Civil Engineering, Hunan City University, Yiyang 413000, China
 Central South University Press and Springer-Verlag GmbH Germany, part of Springer Nature 2019
Abstract: In the light of the problem of weak reflection signals shielded by strong reflections from the concrete surface, the detection and the recognition of hidden micro-cracks in the shield tunnel lining were studied using the orthogonal matching pursuit and the Hilbert transform(OMHT method). First, according to the matching pursuit algorithm and the strong reflection-forming mechanism, and based on the sparse representation theory, a sparse dictionary, adapted to the characteristics of the strong reflection signal, was selected, and a matching decomposition of each signal was performed so that the weak target signal submerged in the strong reflection was displayed more strongly. Second, the Hilbert transform was used to extract multiple parameters, such as the instantaneous amplitude, the instantaneous frequency, and the instantaneous phase, from the processed signal, and the ground penetrating radar (GPR) image was comprehensively analyzed and determined from multiple angles. The results show that the OMHT method can accurately weaken the effect of the strong impedance interface and effectively enhance the weak reflected signal energy of hidden micro-crack in the shield tunnel segment. The resolution of the processed GPR image is greatly improved, and the reflected signal of the hidden micro-crack is easily visible, which proves the validity and accuracy of the analysis method.
Key words: orthogonal matching pursuit; Hilbert transform; shield tunnel; lining structure; hidden micro-crack
Cite this article as: LING Tong-hua, ZHANG Liang, HUANG Fu, GU Dan-ping, YU Bin, ZHANG Sheng. OMHT method for weak signal processing of GPR and its application in identification of concrete micro-crack [J]. Journal of Central South University, 2019, 26(11): 3057-3065. DOI: https://doi.org/10.1007/s11771-019-4236-y.
1 Introduction
Because of the advantages of low impact on the surrounding environment, a wide range of adaptability, safety and rapid construction, shield tunnel construction is increasingly favored in the infrastructures of various countries. As an important part of the shield tunnel support system, the quality of the lining segment is directly related to the overall quality and safety of the tunnel. However, because of factors such as design, construction technology, and cyclic load, segments of shield tunnels commonly exhibit defects, e.g., varying degrees of cracks and water leakage. Particularly, when hidden cracks appear in the lining structure,they are more serious and difficult to address because they are concealed, imperceptible and thus undetectable. The timely detection of concealed quality defects in lining structures is of great significance for maintaining the safety of tunnel engineering.
Scholars have conducted much meaningful work in the detection and identification of typical harmful geologic bodies. The research on the quality defects of shield tunnel lining mainly focuses on the detection of the void and grouting-backfilling [1-6], and there is little reference to the detection and recognition of the lining cracks, particularly the hidden micro-cracks (.5 mm). In the field of underground engineering, the main research objects of cracking are rock and rock-like materials [7, 8]. Since the micro-crack size is too small, the reflection signal is too weak, and the high- frequency electromagnetic wave of the GPR is easily attenuated and dispersed during the propagation process, it is notably difficult to identify and locate the hidden cracks in the shield tunnel lining.
In this work, a signal analysis method that combines the orthogonal matching pursuit with the Hilbert transform (OMHT method) is proposed and applied to identify micro-cracks in concrete structures. In the OMHT method, the original GPR image of the concrete with hidden water-filled micro-crack is processed to remove the strong reflection interference, which causes the weak signal submerged in the strong reflection to emerge. The processed energy-enhanced image is handled by the Hilbert transform. Then, from the obtained three-parameter diagrams of instantaneous amplitude, instantaneous phase and instantaneous frequency, the abnormal reflection signals of the hidden water micro-crack in the middle of the image can be clearly observed, which verifies the effectiveness of the method in the identification of hidden micro-cracks.
2 Theories and algorithms
2.1 Sparse representation theory and matching pursuit algorithm
2.1.1 Sparse representation of signals
A signal that can be expressed as x=[x1, x2, ��, xN]T, if there are only n (n<s as follows:
 (1)
(1)
where a=[��1, ��2, ��, ��s] is the sparse representation coefficient of x in dictionary D=[��1, ��2, ��, ��s]. In discrete-time and finite-length signal processing, a dictionary is a matrix with dimensions N��S with atomic ��s as a column vector. When the number of columns in the dictionary is greater than the number of rows (i.e., S>N), the dictionary is an overcomplete dictionary.
2.1.2 Basic principle of matching pursuit algorithm
The matching pursuit algorithm adaptively decomposes the signal by decomposing the signal in an overcomplete time-frequency atomic library (dictionary D); hence, the signal can be expressed as a linear combination of the matched time- frequency atoms [12]. A dictionary is a collection of a series of time-frequency atoms; the commonly used atomic library categories are Gabor atoms, chirplet atoms, and Ricker wavelet atoms. The specific mathematical principle of the classic matching pursuit algorithm is then expressed as follows [13-15]:

 (2)
(2)
where  is the sparse representation coefficient of the original signal; x is the GPR signal; �� is the sparse constraint coefficient in the matching pursuit algorithm; D is the sparse dictionary.
The matching pursuit algorithm reduces the computational complexity using greedy techniques. It is an iterative algorithm that adopts the inner product as the correlation metric and selects the atom most related to the residual signal in each iteration from the dictionary. Performing this action at each iteration increases the optimization of the approximation of signal x. The specific steps of the algorithm are as follows:
1) Initialization: Set the initial residual signal equal to the original signal, i.e.,  and the initial iteration number to i=0;
2) Inner product coefficient calculation: Calculate the coefficient of the inner product of the residual signal R1x and all atoms in the dictionary, i.e.,
3) Inner product maximization: Maximize the inner product  and record the atomic subscript ��i and the inner product coefficient ����i;
4) Residual signal updating: Update the residual signal using 
5) Rule for stopping the iterations: If the residual signal energy is less than the given threshold ��stop, i.e., then stop iterating. Otherwise, let i=i+1 and return to Step 2.
After N iterations, the signal x can be sparsely decomposed as When N approaches infinity,
 exponentially converges as
  in the finite-dimensional signal space. The signal is then represented as follows:
 (3)
(3)
One of the keys to successfully removing the strong reflection interference using the orthogonal matching pursuit is the selection of the sparse dictionary D. If the dictionary is not properly selected, the strong reflection signal cannot be effectively represented sparsely. The dictionary is composed of wavelet atoms. Currently, the most widely used wavelet types are the Morlet wavelet and the Ricker wavelet. Since the Ricker wavelet has the benefits of a simple form, a short time delay, fast convergence, and high resolution in the reflection of weak signals, we select the Ricker wavelet to build the wavelet library. The time domain expression of the Ricker wavelet is as follows:
 (4)
(4)
where  is the Ricker wavelet; t is time; fj is the dominant frequency of the wavelet.
2.2 Hilbert transform
Independent parameter profiles such as the instantaneous amplitude, instantaneous phase and instantaneous frequency of the real GPR signal are obtained after processing by the Hilbert transform [16, 17].
Let the input signal be g(t), and the output signal be expressed as  after the filtering of Hilbert frequency response of H(w). The Hilbert transform formula is as follows:
 (5)
(5)
The GPR signals are represented as follows:
 (6)
(6)
Formula (6) is the complex signal representation of the real GPR signal g(t).
The following feature parameter estimations are defined from Formula (6) as follows:
a) Instantaneous amplitude estimation:
 (7)
(7)
The instantaneous amplitude A(t) has a positive correlation with the square root of the total energy of the reflected signal at a given moment; the variation of the correlation magnitude is related to the signal propagation distance, the dielectric constant difference, etc.
b) Instantaneous phase estimation:
 (8)
(8)
The instantaneous phase reflects the continuity of events. The phase will change at an abnormal position of the signal. The events may be discontinuous when the phase change is severe.
c) Instantaneous frequency estimation:
 (9)
(9)
The instantaneous frequency is the time changing rate of the phase, which can reflect the physical property change of formation.
3 Indoor test of detection of hidden micro-crack in concrete using GPR
3.1 Indoor model pouring and electromagnetic wave velocity calibrating
The shield tunnel lining is generally 0.3-0.4 m thickness [18-20]; therefore, the concrete model is designed to be h=0.3 m thick. Both the length and the width of the concrete model are 0.6 m. The sizes of the concrete model are 0.6 m��0.6 m��0.3 m. According to Refs. [21-23], the impact of the crack width in the reinforced-concrete lining on the shield tunnel is divided into four grades. When the micro-crack width in the reinforced concrete lining is greater than or equal to 0.5 mm, the cracks seriously affect the health of the shield tunnels. We only detect and identify the critical crack defects with serious impact on the tunnel operation; therefore, the micro-cracks are designed to be 0.5 mm wide. In the actual process of making crack, the micro-cracks are manufactured by inserting and extracting the tagger. The effect of the pulling force and the swinging of the tagger will slightly increase the crack width when the tagger is pulled out. Therefore, the actual crack width is 0.6-0.7 mm. Table 1 shows the relevant parameters of the concrete model, and Figure 1 shows the schematic diagram of the model.
The entire model is poured at once, and then, the vibrator is used to level the surface and remove air. A tagger with sizes of length��width�� thickness=0.45 m��0.18 m��0.50 mm is vertically inserted into the concrete model along the thickness direction to form a micro-crack defect with an insertion depth of 0.25 m. After 2 d of maintenance, use a jack to pull out the tagger, and then continue to maintain the model for 26 d. A flowchart for the complete pouring process of the concrete model is shown in Figure 2. The pouring process of the concrete model is shown in Figure 3 and the concrete model with a micro-crack after 28 d of curing is illustrated in Figure 4.
The electromagnetic wave velocity of the concrete model is calibrated using the GPR in the thickness direction of the concrete model after the model finished maintaining. The calibrated electromagnetic wave velocity of the concrete model is 0.09682 m/ns.
Table 1 Concrete model parameters

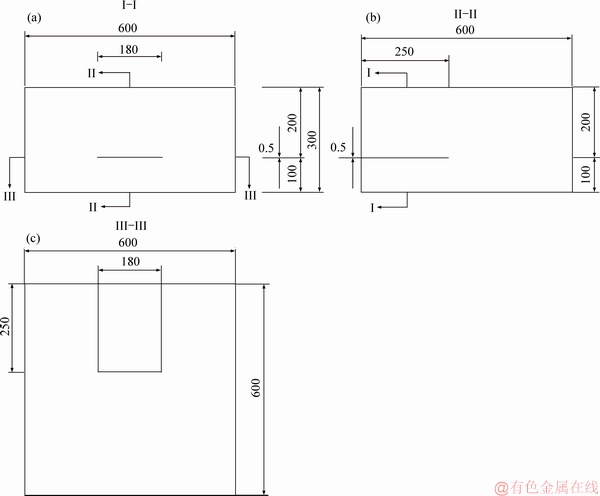
Figure 1 Schematic diagram of concrete model with cracks (Unit: mm)
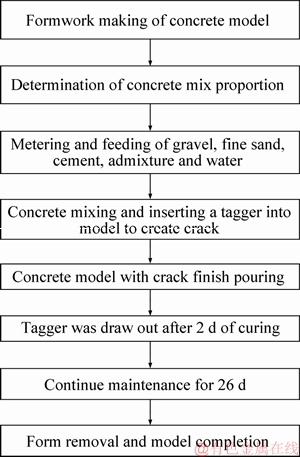
Figure 2 Flowchart of complete pouring process of concrete model
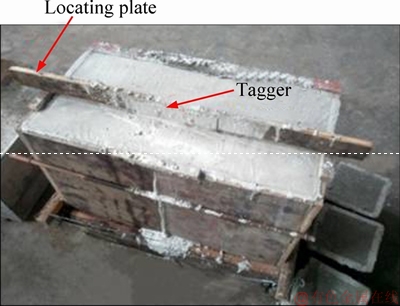
Figure 3 Model construction process
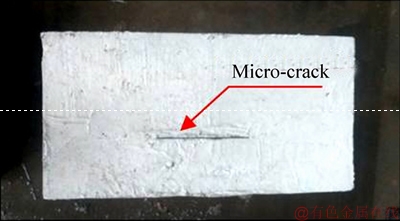
Figure 4 Plain concrete model with a micro-crack
3.2 GPR micro-crack detection test
High-frequency GPR is used to detect the hidden water micro-crack. The radar is an Italian RIS-K2 with an antenna dominant frequency of 1600 MHz, and the measurement mode is the wheel test. The walking direction of the antenna is parallel to the upper boundary of the concrete model, and the center of the antenna is approximately 8 cm from the upper boundary of the model. The detection process is illustrated in Figure 5, and the original GPR image is shown in Figure 6.
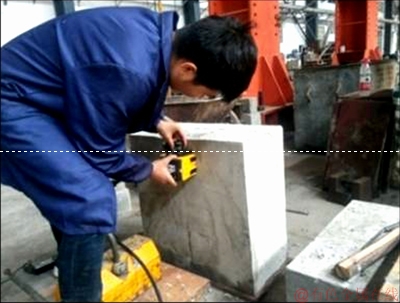
Figure 5 Test of GPR on a concrete model with a hidden micro-crack
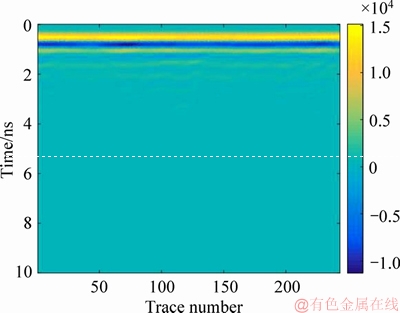
Figure 6 Original image of GPR for concrete with hidden water-filled micro-crack
4 Application of OMHT method in identification of concrete micro-crack
The implementation of the OMHT method consists of two steps: the orthogonal matching pursuit and the Hilbert transform. First, the original GPR image is processed by orthogonal matching pursuit to remove the strong reflection interference. Then, the resulting signal, with the removal of strong reflection, is processed using a Hilbert transform to extract the three-parameter diagrams of the instantaneous amplitude, instantaneous phase and instantaneous frequency. With the three- parameter diagrams, the abnormal reflection signals of the hidden water micro-crack in the middle of the image can be observed, and the GPR images are clearer and more continuous.
4.1 Target signal enhancement based on orthogonal matching pursuit
It is notably difficult to discern the hidden micro-crack in concrete from the GPR original image shown in Figure 6. Because strong energy reflection events occur on the concrete surface, the reflected signal of the weak object in the lower part of the image is submerged in the strong reflection, causing the weak signal of the hidden micro-crack to be difficult to recognize.
The dominant frequency of the strong reflection interference in the concrete surface is calculated using the Hilbert transform, and the Ricker wavelet is expanded into a dictionary according to the characteristics of the original signal, then the original signal is processed using the method of orthogonal matching pursuit to remove the strong reflection interference. The processed image is shown in Figure 7.
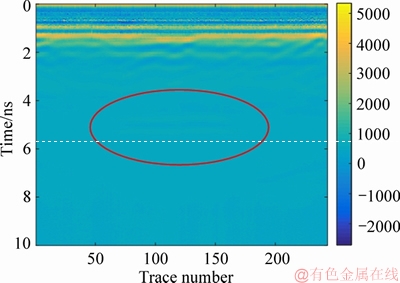
Figure 7 GPR image of concrete with a hidden micro- crack after strong reflection has been removed
In Figure 7, the weak signal, which was submerged in the strong reflection, appears after the strong reflection cophase signals are separated. However, it is not persuasive only from the image profile. To quantitatively describe the performance of the weak signal after the strong reflection interference is removed, the following procedure is applied. First, the root mean square attributes of the signals for 10 sampling points above and 10 sampling points below the strong reflection layer in Figure 6 are determined. Second, the signals at the corresponding positions in Figure 7 are extracted to analyze the effect before and after the removal of the strong reflection signal, as shown in Figure 8. In this figure, the energy of the strong reflection region significantly decreases after the orthogonal matching pursuit, which indicates that the interference signal of the strong reflection region has been effectively separated.
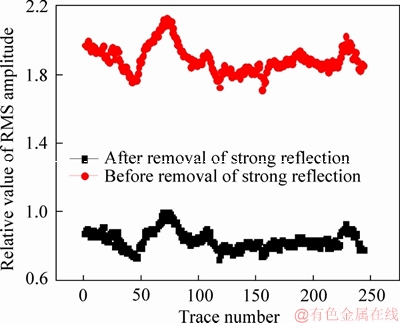
Figure 8 Comparison of root mean square(RMS) amplitude curves in strong reflection region before and after removal of strong reflection
Then, the energy percentage of the signals for 10 sampling points below the strong reflection layer to the bottom of the GPR image is separately extracted from Figures 6 and 7 to analyze the highlighting effect of the weak signal after the strong reflection signal has been removed. The change in energy percentage of the weak signal area is shown in Figure 9. The energy of the weak signal region is significantly improved and the weak signal is effectively enhanced after the orthogonal matching pursuit, thereby assisting in the detection and recognition of the weak object in the GPR image.
The above analysis shows that the energy of the weak signal in the image is effectively improved after the orthogonal matching pursuit process, and the abnormal reflection signal is found at approximately 5 ns in Figure 7 (shown by the red frame in the figure). This shows that the elimination of the strong reflection has a certain highlighting effect on the display of weak signals at the bottom. Because the micro-crack is thin, the weak signal cannot be readily observed, and the degree of recognition of an abnormal body is not high. It remains difficult to determine the presence of tiny defects in the concrete from Figure 7.
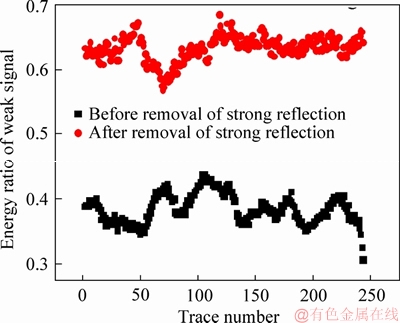
Figure 9 Energy ratio of faint signal before and after removal of strong reflection
4.2 High-resolution image enhancement based on Hilbert transform
After the orthogonal matching pursuit, the GPR image is processed using the Hilbert transform to extract parameters such as the instantaneous amplitude, instantaneous frequency and instantaneous phase, thus providing accurate analyses and judgments for the detected image.
The results of the Hilbert Transform are illustrated in Figure 10.
In Figure 10(a), the instantaneous amplitude spectrum of the GPR recording is shown. In this figure, there is a long strip amplitude anomaly, which is approximately identical to the distribution of the micro-crack at 5 ns (circled in red in the figure). According to the calibrated electromagnetic wave velocity, the calculated distance between the long strip wave anomaly and the side of the model is h=0.202 m, which coincides with the actual distance H=0.20 m of the hidden micro-crack, and it can be judged that the amplitude anomaly is the GPR reflection signal of the hidden micro-crack in the concrete.
The instantaneous phase spectrum in Figure 10(b) shows a corresponding long strip phase anomaly at 5 ns. Compared with Figure 10(a), showing the instantaneous amplitude, the instantaneous phase diagram is clearer and more intuitive, and the left and right wings of the anomalous signal, which are caused by the reflection of the micro-crack boundary, are also readily observed. Figure 10(c) shows the instantaneous frequency spectrum of the GPR image; this diagram has a lower resolution than the instantaneous amplitude and instantaneous phase diagrams. However, a regular mutation of frequency exists at the position of 5 ns, which is caused by the variation of the physical properties of concrete and crack.
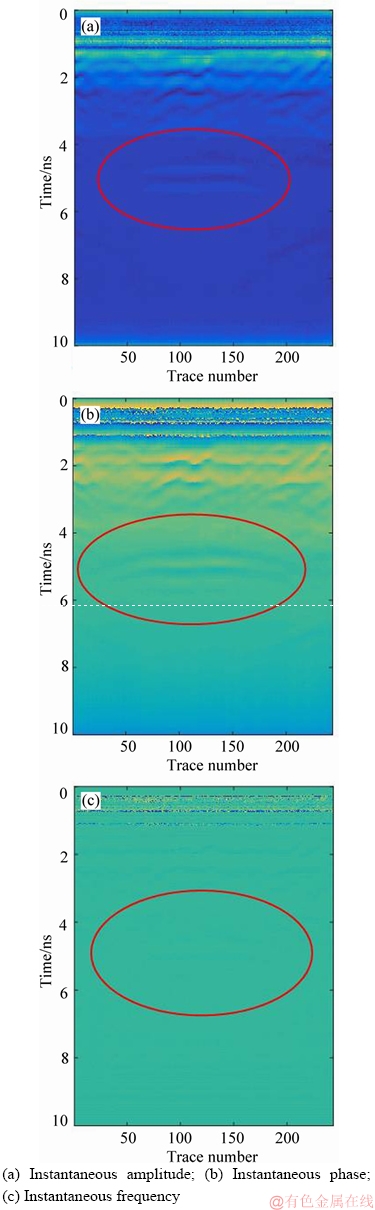
Figure 10 Results of Hilbert Transform for GPR image:
The Hilbert transform method is used to separate the instantaneous amplitude, instantaneous phase and instantaneous frequency from the GPR signal to obtain the three-parameter information of the same detection profile. Instantaneous amplitude spectrum and instantaneous phase spectrum can intuitively reflect the change of physical parameters of detection targets. The instantaneous frequency diagram is relatively low in resolution. The resolution and interpretation reliability of GPR images are improved by the mutual verification of multiple parameter profiles.
5 Conclusions
A weak signal processing method for the GPR��OMHT method is introduced and applied to detect and identify hidden micro-crack in concrete. The main conclusions are as follows:
1) The OMHT method effectively reduces the shielding effect of strong reflection interference on the weak signal and yields the three-parameter information of a detection profile: instantaneous amplitude, instantaneous phase and instantaneous frequency. Using the three-parameter diagrams, the abnormal reflection signals of the hidden water micro-crack in the middle of the image are readily observed, and the GPR images are clearer and more continuous.
2) The OMHT method for GPR weak-signal processing readily improves the image resolution and can identify the micro-crack defect in concrete structures.
3) The OMHT method can analyze detection signals with low signal-to-noise ratio. It also has obvious advantages in eliminating strong reflection interference and improving image resolution. It can be used as a supplement for the GPR data processing.
References
[1] LIU Hao-ran, LING Tong-hua, LI Di-yuan, HUANG Fu, ZHANG Liang. A quantitative analysis method for GPR signals based on optimal biorthogonal wavelet [J]. Journal of Central South University, 2018, 25(4): 879-891. DOI: 10.1007/s11771- 018-3791-y.
[2] LING Tong-hua, ZHANG Liang, GU Dan-ping, LIU Hao-ran, CAO Feng. Analysis of cracking mechanism and bearing capacity of shield tunnel segment with voids behind [J]. Journal of Railway Science and Engineering, 2018,15(9): 2293-2300. DOI: 10.19713/j.cnki.43-1423/u.2018.09.016. (in Chinese)
[3] NOBES D C. Ground penetrating radar response from voids: A demonstration using a simple model [J]. Ndt & E International, 2017, 91: 47-53. DOI: 10.1016/j.ndteint.2017. 05.007.
[4] CASSIDY N J, EDDIES R, DODS S. Void detection beneath reinforced concrete sections: The practical application of ground-penetrating radar and ultrasonic techniques [J]. Journal of Applied Geophysics, 2011, 74(4): 263-276. DOI: 10.1016/j.jappgeo.2011.06.003.
[5] KILIC G, EREN L. Neural network based inspection of voids and karst conduits in hydro�Celectric power station tunnels using GPR [J]. Journal of Applied Geophysics, 2018, 151: 194-204. DOI: 10.1016/j.jappgeo.2018.02.026.
[6] LAI W L, D ROBERT X, ANNAN P. A review of ground penetrating radar application in civil engineering: A 30-year journey from locating and testing to imaging and diagnosis [J]. Ndt & E International, 2018, 96: 58-78. DOI: 10.1016/j.ndteint. 2017.04.002.
[7] ZHOU X P, XIA E M, YANG H Q, QIAN Q H. Different crack sizes analyzed for surrounding rock mass around underground caverns in Jinping I hydropower station [J]. Theoretical and Applied Fracture Mechanics, 2012, 57(1): 19-30. DOI: 10.1016/j.tafmec.2011.12.004.
[8] ZHOU X P, LIAN Y J, WONG L N Y, BERTO F. Understanding the fracture behavior of brittle and ductile multi-flawed rocks by uniaxial loading by digital image correlation [J]. Engineering Fracture Mechanics, 2018, 199: 438-460. DOI: 10.1016/j.engfracmech.2018.06.007.
[9] REBOLLO-NEIRA L. Cooperative greedy pursuit strategies for sparse signal representation by partitioning [M]. Elsevier North-Holland, Inc. 2016.
[10] WANG Jun, ZHOU Si-chao, XIA Li-min. Human interaction recognition based on sparse representation of feature covariance matrices [J]. Journal of Central South University, 2018, 25(2): 304-314. DOI: 10.1007/s11771-018-3738-3.
[11] TANG Jing-tian, LI Guang, ZHOU Cong, LI Jin, LIU Xiao- qiong, ZHU Hui-jie. Power-line interference suppression of MT data based on frequency domain sparse decomposition [J]. Journal of Central South University, 2018, 25(9): 2150-2163. DOI: 10.1007/s11771- 018-3904-7.
[12] MALLAT S G, ZHANG Z. Matching pursuits with time-frequency dictionaries [J]. IEEE Trans on Signal Processing, 1993, 41(12): 3397-3415. DOI: 10.1109/78. 258082.
[13] GHOFRANI S, AMIN M G, ZHANG Y D. High-resolution direction finding of non-stationary signals using matching pursuit [J]. Signal Processing, 2013, 93(12): 3466-3478. DOI: 10.1016/j.sigpro.2013.03. 016.
[14] ZHANG Zhao-heng, DING Jian-ming, WU Chao, LIU Jian-hui. Impulsive component extraction using shift- invariant dictionary learning and its application to gear-box bearing early fault diagnosis [J]. Journal of Central South University, 2019, 26(4): 824-838. DOI: 10.1007/s11771-019-4052-4.
[15] STUDER D, HOFFMANN U, KOENIG T. From EEG dependency multichannel matching pursuit to sparse topographic EEG decomposition [J]. Journal of Neuroscience Methods, 2006, 153(2): 261-275. DOI: 10.1016/j.jneumeth.2005.11.006.
[16] YU Zhi-xiong, XUE Gui-yu, ZHOU Chuang-bing. Application of complex signal analysis to process ground penetrating radar data [J]. Chinese Journal of Rock Mechanics & Engineering, 2005, 24(5): 798-802. DOI: 10.3321/j.issn:1000-6915.2005. 05.011. (in Chinese)
[17] SAHOO S, BISWAL P, DAS T, SABUT S. De-noising of ECG signal and QRS detection using hilbert transform and adaptive thresholding [J]. Procedia Technology, 2016, 25: 68-75. DOI: 10.1016/j.protcy.2016.08.082.
[18] SCHOTTE K, NAGY W, NUTTENS T, WULF A D, BOGAERT P V. Impact of tidal level fluctuations on the structural behaviour of a segmental tunnel lining [J]. Tunnelling & Underground Space Technology, 2017, 64: 184-208. DOI: 10.1016/j.tust. 2017.01.014.
[19] YANG Chun-shan. Influence of construction when the tunnel is first excavation followed by working well on tunnel deformation and control countermeasures [D]. Guangzhou: South China University of Technology, 2015. (in Chinese)
[20] KATEBI H, REZAEI A H, HAJIALILUE-BONAB M, TARIFARD A. Assessment the influence of ground stratification, tunnel and surface buildings specifications on shield tunnel lining loads (by FEM) [J]. Tunnelling and Underground Space Technology incorporating Trenchless Technology Research, 2015, 49: 67-78. DOI: 10.1016/j.tust.2015.04.004.
[21] LI Biao. Structure of mining tunnel detection and evaluation of the service performance [D]. Chongqing: Chongqing Jiaotong University, 2014. (in Chinese)
[22] LAI Jin-xing, QIU Jun-ling, PAN Yun-peng, CAO Xiao-jun, LIU Chi, FAN Hao-bo. Comprehensive monitoring and analysis of segment cracking in shield tunnels [J]. Modern Tunnelling Technology, 2015, 52(2): 186-191. DOI: 10.13807/j.cnki.mtt.2015.02.028. (in Chinese)
[23] LI C Q, BAJI H, MAHMOODIAN M, YANG W. Risk-cost optimized maintenance strategy for tunnel structures [C]// International Conference on Smart Infrastructure and Construction. 2016.
(Edited by YANG Hua)
���ĵ���
�����״����źŴ���OMHT�������ڻ������ѷ�ʶ���е�Ӧ��
ժҪ����Ի���������ǿ�����ԭ����ɵ��쳣ǿ�����ź������²���Ŀ���źŵ����⣬��������̰��ƥ������ϣ�����ر任���ϵķ���(OMHT��)�����˶ܹ��������������ѷ�ļ����ʶ�����ȣ�����ƥ�����㷨��ǿ�����γɻ���������ϡ���ʾ���ۣ�ѡȡ����ǿ�����ź���������Ӧ��ϡ���ֵ䣬��ÿ���źŽ���ƥ��ֽ����ʹ��û��ǿ�����е���Ŀ�����źŵõ��Ϻõ�չʾ����Σ��Դ�������źŽ���ϣ�����ر任��ȡ�״�����˲ʱ�����˲ʱƵ�ʺ�˲ʱ��λ�ȶ��������Ϣ���Ӷ���ǶȶԵ����״�ͼ������ۺϷ������жϡ����������OMHT���ɾ�����ǿ�迹�����Ӱ�죬����Ч��ǿ��Ƭ�����ѷ��������ź�������������ĵ����״�ͼ��ֱ���������ߣ������ѷ췴���ź������ɼ���֤���˸÷��������������ѷ�ʶ�����Ч�Ժ�ȷ�ԡ�
�ؼ��ʣ�����ƥ���٣�ϣ�����ر任���ܹ������������ṹ�������ѷ�
Foundation item: Projects(51678071, 51608183) supported by the National Natural Science Foundation of China; Projects(CX2018B530, CX2018B531) supported by the Postgraduate Research and Innovation-funded Project of Hunan Province, China; Projects(16BCX13, 16BCX09) supported by Changsha University of Science and Technology, China
Received date: 2018-07-24; Accepted date: 2019-07-04
Corresponding author: ZHANG Liang, Doctoral Candidate; Tel: +86-18974934275; E-mail: zhangliang4137@163.com; ORCID: 0000- 0002-7119-9315

