J. Cent. South Univ. (2012) 19: 696-702
DOI: 10.1007/s11771-012-1059-5
Effect of floor level slit exhaust ventilation system on
distribution of house dust
L? Yang(����)1, H. Yoshino2, R. Takaki 2, R. Kurihara2, A. Mochida2, H. Yonekura2
1. School of Civil Engineering, Faculty of Infrastructure Engineering,Dalian University of Technology, Dalian 116000, China;
2. Department of Architecture & Building Science, Tohoku University, Sendai 980-8579, Japan
? Central South University Press and Springer-Verlag Berlin Heidelberg 2012
Abstract: Based on the fact that the house dust usually falls on the ground, the floor level slit exhaust ventilation system including inlet located at the ceiling and outlet of slit exhaust installed at corner between wall and floor was considered. Experiments and simulations were performed to investigate the flow and diffusion fields that are affected by this floor level slit exhaust ventilation system. The characteristics of airflow with experiments and computation fluid dynamics (CFD) are generally similar except airflow at the location of impinging flow and the location right below the inlet. Riboflavin particles were used as the house dust. For the spatial distribution of riboflavin particles in the ventilation system before operation, due to the influence of gravity, different sizes of particles show smooth decay curve. After floor level slit exhaust ventilation system is operated, the decay rate of the particles becomes faster than that after the ventilation system is powered on, and the particles with diameter of 0.5-3.0 ��m in the experimental data and calculated values show good agreement.
Key words: house dust; floor level slit exhaust; riboflavin particles; computational fluid dynamics
1 Introduction
In recent years, the levels of air tightness and insulation of residential houses become better for energy saving, hence living comfort has been improved. However, on the other hand, the problems, such as the arising of the indoor humidity by the lack of ventilation rate, the appearance of the condensation, and the increase of the house dust, are more and more reported. House dust includes the spore of the mold or corpses and feces of the mite and so on, which will cause allergy, asthma and unspecific hypersensitivities. According to the past study, the intake of house dust by children is usually higher than the adult, so attention to the influence caused by house dust on the children��s health rises [1-2]. In additional, an epidemiological study ��Dampness in Buildings and Health (DBH)�� started in Sweden in 2000 was operated, which pointed out the relationship between the phthalic acid ester density in house dust and asthma and allergy that children suffered [3]. The negative effects caused by dampness or moldy housing on children��s health have also been reported in some studies [4-7].
Numerical simulation studies of indoor particle distribution and deposition using computational fluid dynamics (CFD) have been reported. MURAKAMI et al [8] found that numerical simulation seems to be a very useful method for predicting air velocity and contaminant distribution in clean rooms. BOUILLY et al [9] carried out both numerical simulations and measurements to study the particle decay rates with three different ventilation modes using the Lagrangian formulation. A three-dimensional drift-flux model for particle movements in turbulent indoor airflows combined with the Eulerian approaches was developed by GAO and NIU [10-11]. One recent study conducted by ZHAO and WU [12] compared the spatial distribution of particles with different ventilation modes. However, the study on the effect of the ventilation system on the spatial distribution of house dust is still lacking badly.
The purpose of this work is to evaluate the spatial distribution of house dust with different sizes in the floor level slit exhaust ventilation system by the experiments and numerical analysis. The experimental data are also fitted to CFD models.
2 Experimental
2.1 Test house and ventilation systems
The test room (5.37 m��2.74 m��2.25 m) is situated in the second floor of an experimental house which is located in the campus of Tohoku University, Japan. As shown in Fig. 1, the window is sheltered to prevent solar radiation, and the wall is insulated by foam polystyrene board to decrease heat transmission loss. The equivalent leakage area is measured as 5.3 h-1 under pressure difference of 50 Pa. The air change rate is set as 2.5 h-1.
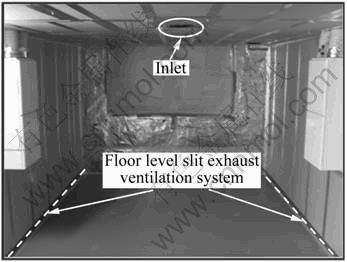
Fig. 1 Photograph of test room and ventilation systems
Considering that the house dust is usually falling on the floor, the floor level slit exhaust ventilation system has been considered in this work. Inlet is located at the center of the ceiling. The dimension of inlet was set as 0.05 m��0.10 m. Inlet velocity was 3.34 m/s and air was supplied downwards. Exhaust slit is set at the corner
between wall and the floor (East: 4.2 m��0.005 m, West: 4.53 m��0.005 m).
Supersonic wave anemometer (CLIMATEC, CYG-81000) was used for the measurement of the airflow directions and velocities. Figure 2 shows the measurement points for airflow and 72 points were selected from three different floor levels of Z1 (0.1 m), Z2 (0.75 m), and Z3 (1.65 m), respectively. The 10 min averaged values were measured when indoor airflow reached steady state.
The airflow velocities of exhaust slit was measured at six points using a thermistor anemometer (F6204E, SHIBAFU electron).
In this work, riboflavin particle was used as house dust, because it is harmless biological particle that would not be influenced by the background. The dispersal device of riboflavin particles is shown in Fig. 3. The particles were put in a measuring flask, which was fixed at the corner near the ceiling of the room. Nitrogen gas was blown into the measuring flask to disperse the particles. Nitrogen gas flow rate was set as 10 L/min. The particles were mixed by an electric fan which was fixed close to the flask, to make the distribution of particles as evenly as possible in the room.
The schedule of this experiment was set up as follows. In the first 1 h, the particles were dispersed, and during the following 8 h the particles fell on the ground freely, and for the last 15 h, ventilation system was operated. Taking into the account the symmetry of the room and the height of the child, the position of the monitoring point, also shown in Fig. 3, was set in the center of a quarter of the room at height of 1.0 m.
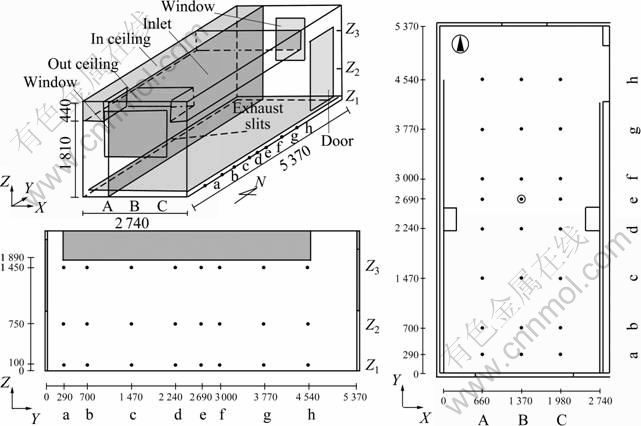
Fig. 2 Positions of 72 measurement points for airflow

Fig. 3 Dispersal devices and monitoring point
Instantaneous microbial detection (IMD-A 200-1, BioVigilant Systems) was used to measure the particles. IMD is based on optical fluorescence sensor technology and is capable of detecting the size of particles in the environmental air as well as determining whether each particle is biological one or not. For the measurement principle, the fluorescent light would be produced when the life ingredient encountered laser to distinguish between bio-particles and non-biological particles. Particle sizes were classified as the following six levels: 0.5�C1.0 ��m, 1.0�C3.0 ��m, 3.0�C5.0 ��m, 5.0�C7.0 ��m, 7.0�C10.0 ��m and 10.0�C15.0 ��m.
2.2 Selection of house dust particles
In this work, on the behavior of mite allergens [13], JIS-11 test particles were used as simulated particles. JIS-11 test particles are made from volcanic ash soil which is widely distributed on the earth surface in the Kanto region of Japan. It is always standardized as non-biological particle such as dust on the road or in the outside air. However, existing particles in the background might influence the measurement results of JIS-11 test particles. Therefore, riboflavin particles were used as the test particles because it is harmless for biological particles that would not be influenced by the background. Riboflavin particle is a special kind of biological particles which can emit fluoresce when it is exposed to light sources with a certain specific wavelength, such as ultraviolet.
Figure 4 shows the scanning electron micrograph of JIS-11 test particles and riboflavin particles. Figure 5(a) shows the results of JIS-11 test particles. The average particle count before supply was 1 753 particles/L for 0.5-1.0 ��m and 170 particles/L for 1.0-3.0 ��m. The particle count for all sizes increased rapidly just after the supply of particles and then decreased to the same level as that before the supply of particles. Figure 5(b) shows the results of riboflavin particles. The particle count before supply was very low compared with the count for JIS-11 test particles. Because the concentration of riboflavin particles show less effect from the background, riboflavin particles can be exactly measured. Therefore, riboflavin particles were used as the house dust in this work.

Fig. 4 Scanning electron micrographs of particles: (a) JIS-11 test particles; (b) Riboflavin particles
3 Modeling approach
3.1 Model room and mesh division
The above-mentioned test room with the floor level slit exhaust ventilation system was modeled by CFD method. A commercial CFD software, Flow designer [14], was used. Based on the experiment, the calculation time bucket was about 120 min, and the interval was assumed to be about 1 s. Measured values of indoor and outdoor air temperatures and velocities were used as initial boundary conditions in the CFD calculation. Table 1 gives the calculation conditions. Figure 6 illustrates the computational meshes. The computational domain was divided into 52(X)��77(Y)��49(Z) meshes. Meshes close to inlet and ground were divided more finely than other areas.
3.2 Modeling of house dust dispersion
Governing equation of house dust dispersion is shown in Eq. (1). In this numerical simulation, the following assumptions were given:

Fig. 5 Comparison of JIS-11 vs riboflavin particles

Fig. 6 Mesh system
Table1 Calculation conditions

1) House dust was treated as spherical particle with diameter of 1.0 ��m and 3.0 ��m, and density of 1 000 kg/m3. The deposition velocity was calculated using Stokes�� equation.
2) Eddy diffusivity ��E is equal to eddy kinematic viscosity ��t.
3) The initial mass of house dust on the entire room is estimated as
 (1)
(1)
where C is the house dust concentration (kg/m3); ui is the air flow velocity at the i-th component, i=1, 2, 3; subscript 3 means the gravitational direction (m/s); D is the molecular diffusivity (m2/s) (D=2.75��10-11m2/s for 1.0 ��m; D=8.31��10-12 m2/s for 3.0 ��m); ��E is the eddy diffusivity (m2/s); Cin is the generation rate of house dust (kg/s��m3); wP is the deposition velocities of house dust (m/s) (wP=3.49��10-5 m/s for 1.0 ��m; wP=2.84��10-4 m/s for 3.0 ��m).
4 Results and discussion
4.1 Experimental results and comparison of airflow field
The measured air flow vector is shown in Fig. 7 by the thick arrow. The measured airflow velocities through the floor level slit are about 0.5 m/s. There is no significant difference among the six points. Figure 7 also shows the simulation results. The velocities are shown by contour graph. The experimental results (thick arrow in Fig. 7) and simulation results are reproduced well except little difference is found at the location of impinging flow (Fig. 7(b) and (c)-bc and gh).

Fig. 7 Velocities distribution (Thick arrow represent measured values): (a) z=0.1; (b) A section; (c) B section
The air velocities of experimental results and numerical results are compared in Fig. 8. Difference between the calculated values and measured values is observed at the location of impinging flow and the location right below the inlet. Possibly because the airflow is blown from a direction of right above the supersonic wave anemometer for the location right below the inlet, velocities could not be properly measured. However, the measured results by thermistor anemometer agree well with simulation results, as shown in Fig. 9.

Fig. 8 Comparison of measured velocities vs simulated velocities

Fig. 9 Comparison of velocities (At location right below inlet)
4.2 Experiment results of house dust diffusion field
The results of the spatial distribution of particles are shown in Fig. 10. The different sizes of riboflavin particles show smooth decay curve due to the influence of gravity before ventilation system operating. After ventilation system is operated, the decay rate of the house dust becomes faster than that before the ventilation system is powered on. In addition, the number of particles bigger than 3.0 ��m is very small in decay period, which can be considered that the particles bigger than 3.0 ��m have deposited on the ground, while the particles of 0.5-3.0 ��m still float in the air. Previous studies have shown that, compared with the particles bigger than 3.0 ��m, the particles smaller more feasibly float in the air and therefore more easily to be breathed in by human and cause diseases. Studies have also shown that the spores of Aspergillus sp. and Penicillium sp., whose diameters are about 3.0 ��m, can reach the lung of human and then trigger asthma disease easily [15]. After ventilation system is operated, the decay rate of the house dust becomes faster than that before the ventilation system is powered on. After 15 h of ventilation system operation, the number of particles for all sizes decreases to the same level as background. It can be considered that the particles have been completely removed from ventilation system.

Fig.10 Spatial distribution of particles
4.3 Simulation results of house dust diffusion field
Figure 11 compares the time variation of the volume-average concentrations in the monitoring point for experiment and simulation. It can be seen that the particles with diameter of 0.5-3.0 ��m in the experimental data and calculated values show good agreement. Figure 12 shows the spatial distribution of house dust in different time. It can be seen that the house dust decreases gradually in the entire room, and then can be removed gradually from the center. The house dust is removed significantly after 120 min.
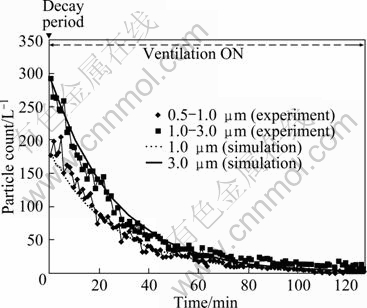
Fig. 11 Time variation of concentrations of monitoring point for experiment and simulation
5 Conclusions
1) The characteristics of airflow is similar between experimental and simulation results except the airflow at the location of impinging flow and the location right below the inlet.
2) Riboflavin particles were used as the house dust.
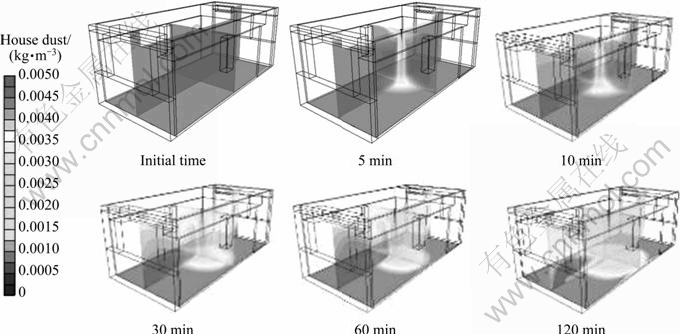
Fig.12 Spatial distribution of house dust in different time
For the spatial distribution of house dust in the ventilation system before operation, due to the influence of gravity, different sizes of particles show smooth decay curve. After ventilation system is operated, the decay rate of the house dust becomes faster than that before the ventilation system is on, and the particles with diameter of 0.5�C3.0 ��m of house dust in the experimental data and calculated values show good agreement.
References
[1] PEARCEA N, PEKKANENA J, BEASLEYA R. How much asthma is really attributable to atopy? [J]. Thorax, 1999, 54: 268-272.
[2] PAJNO G B, BARBERIO G, de LUCA F, MORABITO L, PARMIANI S. Prevention of new sensitizations in asthmatic children monosensitized to house dust mite by specific immunotherapy. A six-year follow-up study [J]. Clinical & Experimental Allergy, 2001, 31: 1392-1397.
[3] BORNEHAG C G, SUNDELL J, SIGSGAARD T. Dampness in buildings and health (DBH): Report from an ongoing epidemiological investigation on the association between indoor environmental factors and health effects among children in Sweden [J]. Indoor Air, 2004, 14: 59-66.
[4] RUNESON R, WAHLSTEDT K, WIESLANDER G, NORB?CK D. Personal and psychosocial factors and symptoms compatible with sick building syndrome in the Swedish workforce [J]. Indoor Air, 2006, 16: 445-453.
[5] SOMERVILLE M, MACKENZIE I, OWEN P, MILES D. Housing and health: does installing heating in their homes improve the health of children with asthma? [J]. Public Health, 2000, 114: 434-439.
[6] THORN J, BRISMAN J, TORNE K. Adult-onset asthma is associated with self-reported mold or environmental tobacco smoke exposures in the home [J]. Allergy, 2001, 56: 287-292.
[7] XI J X, SI X H, KIM J W. Simulation of airflow and aerosol deposition in the nasal cavity of a 5-year-old child [J]. Journal of Aerosol Science, 2011, 42(3): 156-173.
[8] MURAKAMI S, KATO S, NAGANO S, TANAKA Y. Diffusion characteristics of airborne particles with gravitational settling in a convection-dominant indoor flow field [J]. Ashrae Transactions, 1992, 98(1): 82-97.
[9] BOUILLY J, LIMAM K, BEGHEIN C. ALLARD F. Effect of ventilation strategies on particle decay rates indoors: an experimental and modeling study [J]. Atmospheric Environment, 2005, 39: 4885-4892.
[10] GAO Nai-ping, NIU Jian-lei. Modeling particle dispersion and deposition in indoor environments [J]. Atmospheric Environment, 2007, 41: 3862-3876.
[11] GAO Nai-ping, NIU Jian-lei, LIDIA M. Distribution characteristics of respiratory aerosols in enclosed environments [J]. Journal of Southeast University: English Edition, 2010, 26(2): 232-237.
[12] ZHAO Bin, WU Jun. Effect of particle spatial distribution on particle deposition in ventilation rooms [J]. Journal of Hazardous Materials, 2009, 170: 449-456.
[13] WATANABE R. Effects of heating systems on scattering of Der 1 based on experiments and CFD analysis [J]. Architectural Institute of Japan, 2006: 887-888. (in Japanese)
[14] http://www.akl.co.jp
[15] YOSHIKAWA M. Indoor pollution and allergy [M]. Tokyo, Japan: Inoueshoin Press, 1999: 37. (in Japanese)
(Edited by YANG Bing)
Foundation item: Project supported by Ministry of Land, Infrastructure, Transport and Tourism of Japan; Project(DUT10RC(3)103) supported by the Fundamental Research Funds for the Central Universities in China; Project(20111027) supported by the Liaoning Provincial Scientific Research Foundation, China; Key Project (2012BAJ02B05) supported by the Twelfth Five-Year National Technology Program of China; Project supported by Dalian Municipal Construction Technology Program, China
Received date: 2011-07-26; Accepted date: 2011-11-14
Corresponding author: L? Yang, Associate Professor, PhD; Tel: +86-411-84707684; E-mail: lvyang20022002@yahoo.com.cn

