Load-bearing characteristics of square footing on geogrid-reinforced sand subjected to repeated loading
来源期刊:中南大学学报(英文版)2020年第3期
论文作者:王家全 张亮亮 Victor N. KALIAKIN 唐毅
文章页码:920 - 936
Key words:repeated loading; geogrid; square footing; depth of reinforcement; bearing capacity
Abstract: A series of dynamic model tests that were performed on a geogrid-reinforced square footing are presented. The dynamic (sinusoidal) loading was applied using a mechanical testing and simulation (MTS) electro-hydraulic servo loading system. In all the tests, the amplitude of loading was ±160 kPa; the frequency of loading was 2 Hz. To better ascertain the effect of reinforcement, an unreinforced square footing was first tested. This was followed by a series of tests, each with a single layer of reinforcement. The reinforcement was placed at depths of 0.3B, 0.6B and 0.9B, where B is the width of footing. The optimal depth of reinforcement was found to be 0.6B. The effect of adopting this value versus the other two depths was quantified. The single layer of geogrid had an effective reinforcement depth of 1.7B below the footing base. The increase of the depth between the topmost geogrid layer and the bottom of the footing (within the range of 0.9B) did not change the failure mode of the foundation.
Cite this article as: ZHANG Liang-liang, WANG Jia-quan , Victor N. KALIAKIN, TANG Yi. Load-bearing characteristics of square footing on geogrid-reinforced sand subjected to repeated loading [J]. Journal of Central South University, 2020, 27(3): 920-936. DOI: https://doi.org/10.1007/s11771-020-4341-y.

J. Cent. South Univ. (2020) 27: 920-936
DOI: https://doi.org/10.1007/s11771-020-4341-y

ZHANG Liang-liang(张亮亮)1, 2, WANG Jia-quan(王家全)1 , Victor N. KALIAKIN 3, TANG Yi(唐毅)1
1. College of Civil and Architectural Engineering, Guangxi University of Science and Technology,Liuzhou 545006, China;
2. Department of Civil and Environmental Engineering, Harbin Institute of Technology,University Town of Shenzhen, Shenzhen 518055, China;
3. Department of Civil and Environmental Engineering, University of Delaware, Newark, DE 19716, USA
 Central South University Press and Springer-Verlag GmbH Germany, part of Springer Nature 2020
Abstract: A series of dynamic model tests that were performed on a geogrid-reinforced square footing are presented. The dynamic (sinusoidal) loading was applied using a mechanical testing and simulation (MTS) electro-hydraulic servo loading system. In all the tests, the amplitude of loading was ±160 kPa; the frequency of loading was 2 Hz. To better ascertain the effect of reinforcement, an unreinforced square footing was first tested. This was followed by a series of tests, each with a single layer of reinforcement. The reinforcement was placed at depths of 0.3B, 0.6B and 0.9B, where B is the width of footing. The optimal depth of reinforcement was found to be 0.6B. The effect of adopting this value versus the other two depths was quantified. The single layer of geogrid had an effective reinforcement depth of 1.7B below the footing base. The increase of the depth between the topmost geogrid layer and the bottom of the footing (within the range of 0.9B) did not change the failure mode of the foundation.
Key words: repeated loading; geogrid; square footing; depth of reinforcement; bearing capacity
Cite this article as: ZHANG Liang-liang, WANG Jia-quan , Victor N. KALIAKIN, TANG Yi. Load-bearing characteristics of square footing on geogrid-reinforced sand subjected to repeated loading [J]. Journal of Central South University, 2020, 27(3): 920-936. DOI: https://doi.org/10.1007/s11771-020-4341-y.
1 Introduction
In recent years, geosynthetic-reinforced soil technology has been used to enhance the performance of shallow foundations. The presence of flexible polymeric reinforcement generally leads to a rather complex interaction between it and the soil underlying the foundation. Through proper arrangement of the reinforcement, it is possible to increase the bearing capacity and stability of shallow foundations, while also leading to a more uniform distribution of its deformation and smaller settlements [1-6].
Over the past several decades, both theoretical and experimental studies have been undertaken to better understand the behaviour of geosynthetic- reinforced shallow foundations [7-16]. The key factors affecting the deformation, bearing capacity and stability of such foundations appear to be the optimal depth of the top reinforcement layer [8, 17-21], the optimal number of reinforcement layers [17, 21-24], the method of placing the reinforcement [19, 25], and its optimal length [16, 17, 22].
YETIMOGLU et al [26] used a series of geogrid-reinforced foundation model tests to study the influence that the reinforcement depth and spacing, number of reinforcement layers and total depth of reinforcement had on the bearing capacity of rectangular footings. Their results showed that for single-layer and multi-layer reinforced foundations, the optimal depth of the geogrid was 0.30B and 0.25B, respectively, where B is the width of the footing. Reinforcement depths in excess of 1.50B did not affect the deformation and bearing capacity of the rectangular footings. YETIMOGLU et al [26] also related the optimal reinforcement spacing to the number of reinforcement layers. In general, this spacing was between 0.20B and 0.40B. SHIN et al [27] and GHOSH et al [28] also reported the results of model tests performed on reinforced footings. They evaluated the effective depth of reinforcement for maximizing its efficiency in foundation’s performance. In this work, the effective depth of reinforcement was found to lie between 1.75B and 2.0B. Subsequent experimental and numerical studies also verified that the optimum depth of the first reinforcement layer was indeed within this range [4, 18, 29]. Based on their extensive review of previous laboratory studies of bearing capacity and stability of reinforced shallow foundations, MARTO et al [30] concluded that the optimal depth of the first reinforcement layer was in the range between 0.25B and 0.50B.
ALTALHE et al [31] investigated the relationship between the bearing capacity ratio (BCR) of doubly-reinforced and singly-reinforced sand by a series of model tests on reinforced sand, and evaluated 0.3B as the optimum vertical- spacing for double-reinforced sand. SHADMAND et al [32] carried out model tests to evaluate the load-settlement response of square footing with two types of reinforcement methods. The results of these tests showed that the optimal depth of the first opening-reinforcement layer was approximately 0.30B and this depth in excess of the 0.90B had an insignificant effect on the load-settlement characteristics of footing.
The influence of geosynthetic reinforcement on the ultimate bearing capacity and stability of shallow foundations has also been studied analytically [33-39]. In certain cases [35, 39], the accuracy of the analytical approaches was verified by applying them to predict the results of model tests.
Guided by the aforementioned findings, a number of subsequent experimental studies involving model tests were performed in recent years to gain additional insight into the behaviour of geosynthetic-reinforced shallow foundations [40-42]. Similar to the earlier studies, the parameters investigated in the more recent ones included the depth of the top reinforcement layer, the number of reinforcement layers, the spacing between these layers, the effective depth of reinforcement and the shape of the footing.
Based on the results of the aforementioned experimental studies, it appears that the optimal depth for the first reinforcement layer is in the range 0.30B-0.67B. The effective depth of reinforcement does not exceed 2.0B; reinforcement placed at greater depths has an insignificant effect on the performance of the shallow foundation.
Although quite thorough, the aforementioned experimental studies were largely restricted to static loading, the scope of subsequent studies related to geosynthetic-reinforced soils and shallow foundations has, however, been expanded beyond static uniform loading to include eccentric and lateral loads, as well as cyclic excitation [15, 42-46]. More importantly, the research of dynamic response of footings on reinforced soils has just started in recent years [40, 47-52].
This paper presents the results of a preliminary study of model tests involving a single geogrid layer-reinforced square footing that was subjected to dynamic (sinusoidal) loading. The response of the footing with three different reinforcement depths is compared to an unreinforced foundation. The effect of the depth of the first reinforcement layer on the bearing capacity, foundation settlement, earth pressure distribution, soil acceleration, and geogrid strain is assessed. Values for the optimal depth of the reinforcement layer and the effective reinforcement depth are proposed. Finally, the present model tests give insight for future research on the dynamic response of reinforced shallow foundations.
2 Materials and methodology
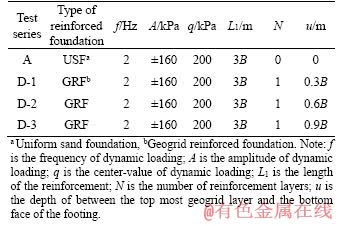
Two series of model tests were performed to study the influence of geosynthetic reinforcement on the dynamic response of a square footing. In the first series, referred to as “A”, the footing was unreinforced. In the second series, the reinforcement layer was placed at depths of 0.3B, 0.6B, and 0.9B below the base of the footing. These tests are referred to as D-1, D-2, and D-3, respectively. The size and layout of geogrid were selected based on the conclusions of PRASAD et al [20], ZHOU et al [53] and WANG et al [54].Table 1 presents the description of each of these series with the parameters used. Additional details pertaining to the model tests are now presented.
Table 1 Description of laboratory model test series
2.1 Test materials
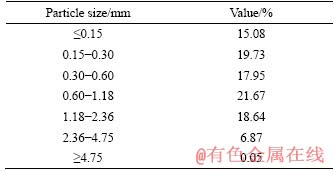
The granular soil used in all of the tests was obtained from the banks of a local river in Liuzhou City, China. From the results of a sieve analysis, the soil had an effective grain size (D10) of 0.09 mm, a median particle size (D30) of 0.31 mm, a constrained grain size (D60) of 0.80 mm, a uniformity coefficient (Cu) of 8.89, and a curvature coefficient (Cc) of 1.33. Table 2 shows the particle size distributions of the sand. According to the Unified Soil Classification System, the soil is classified as a well-graded sand (SW). The sand had a specific gravity of solids equal to 2.65. Its moist density was 1.81 g/cm3. Since the moisture content was 6.9%, the sand’s dry density was 1.69 g/cm3. Finally, the internal friction angle of the moist sand was 39° and the cohesion was 1.28 kPa.
Table 2 Grain size distribution of tested sand
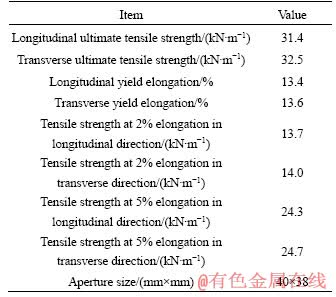
High density polyethylene (HDPE) biaxial geogrid reinforcement was used in tests D-1, D-2, and D-3 (Figure 1). Table 3 summarizes the essential properties of the geogrid, which were determined using a universal testing machine. In all model tests involving reinforcement, a square portion of geogrid measuring 150 cm on a side was carefully laid flat at the prescribed depth (i.e., 0.3B, 0.6B, and 0.9B) below the base of the footing.
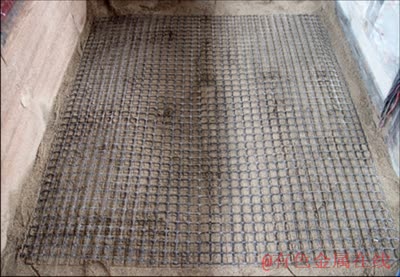
Figure 1 Biaxial geogrid
Table 3 Properties of HDPE biaxial geogrid
2.2 Test device
The device used to perform all of the dynamic model tests consisted of three parts, including a model box structure, instrumentation and data collection equipment, and a MTS electro-hydraulic servo loading system. The test device and associated equipment are shown in Figure 2.
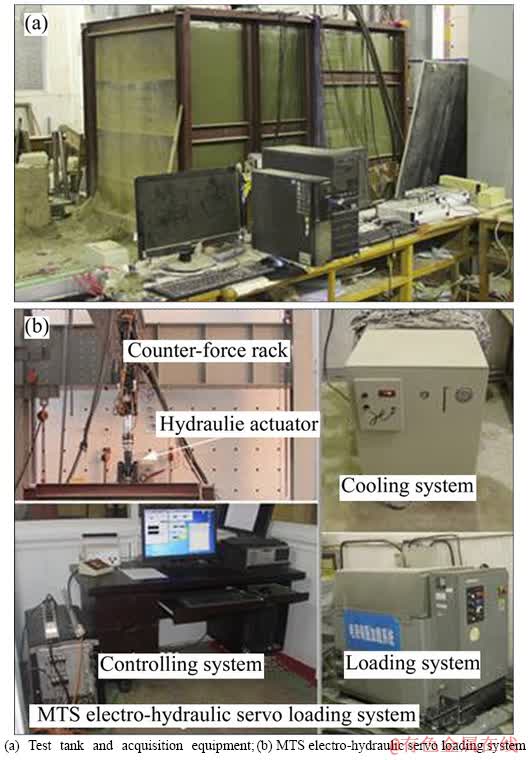
Figure 2 Laboratory test devices and associated equipment:
2.2.1 Model box structure
The inside dimensions of the model box structure used in performing the present set of dynamic model tests are 300 cm×160 cm×200 cm. Generally speaking, it is difficult to carry out outdoor field tests. Therefore, in order to better simulate the field test and meet the requirements of laboratory equipment use, the size of the large-scale model box in the present paper was selected according to the field test conducted by VENKATESWARLU et al [55] and referenced to SHADMAND et al [32], and OLIAEI et al [56]. The frame of the model box structure was made by welding steel plate and steel channel sections together. The four upper corners of the box were strengthened by attaching 6 mm thick steel angle sections. To further stiffen the box, a 6 mm thick steel plate was welded to one of its sides. The other side consisted of 20 mm thick tempered glass on which a grid was marked. The latter was used to better observe the sand filling and compaction processes (e.g., the flatness of soil filling each layer). To prevent side wall deformation during loading, additional channel sections were welded to the sides of the box. It is worthy of noting that the full-length and full-height steel channel sections were set in the transverse side and longitudinal side of frame, respectively (see Figure 2(a)).
2.2.2 Acquisition and measuring equipment
The instrumentation used to obtain data from the dynamic footing tests consisted of flexible displacement meters, displacement transducers, accelerometers, and dynamic earth pressure cells. To verify their performance when buried, the earth pressure cells were placed in a trial soil model. The cell readings were then suitably calibrated to ensure that the correct pressure was obtained. Each of these four types of instrumentation is shown in Figure 3. Table 4 lists some additional details pertaining to these devices.
Footing settlements were measured using eight displacement transducers, symmetrically arranged on a square base. The average of these eight devices was reported as the incremental value of footing settlement. The bearing capacity of the foundation was obtained directly from the MTS electro- hydraulic servo loading system. Accelerometer and dynamic earth pressure cells were embedded at appropriate depths below the base of the footing. Flexible displacement meters were arranged at designated positions on the geogrid so as to quantify its response. Figure 4 schematically shows the instrumentation layout used in dynamic model test D-2.
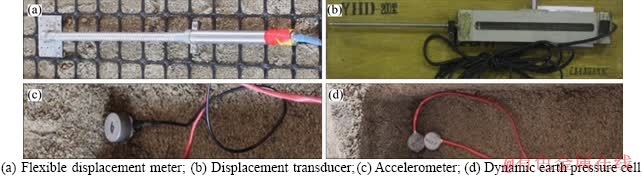
Figure 3 Instrumentation used in dynamic model tests:
Table 4 Details pertaining to instrumentation used in dynamic model tests
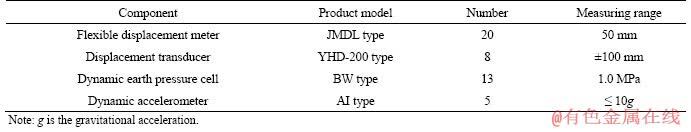
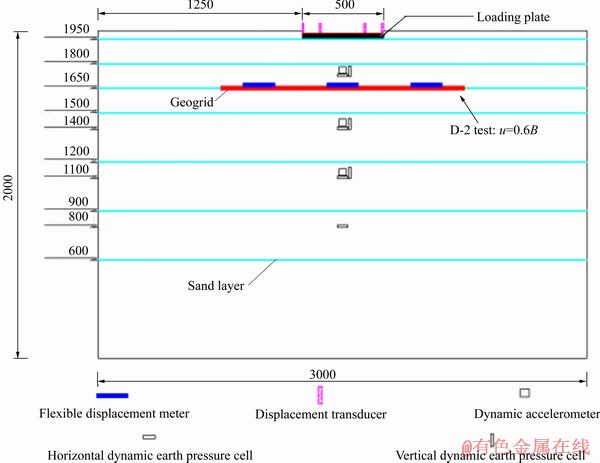
Figure 4 Schematic illustration of instrumentation layout used in dynamic model tests (Unit: mm)
2.2.3 Servo loading system
The MTS electro-hydraulic servo system can apply loads statically or dynamically. This loading system has a loading capacity of 250 kN and can impose different amplitude loads at different frequencies (up to 12 Hz). The actuator has a maximum stroke of 50 cm under static or dynamic load. Following guidelines for dynamic model tests [57, 58], the dimensions of the steel loading plate used to simulate the square footing were determined to be 50 cm by 50 cm in plan and 30 mm in thickness. This thickness ensures that the plate will not bend when loaded. In these tests, the loading plate and the hydraulic actuator were connected together through processing using high-strength bolts to avoid the effect of eccentricity of the applied load on the footing settlement. It was important to make sure that the center of the loading plate was in line with the center of hydraulic actuator during the connection process. What is more, make sure that the center of the loading plate was in line with the center of the model box before starting loading. The load was applied on the footing while it remained vertical during tests to prevent the footing from tilting and eccentricity of the applied load. A sinusoidal loading was applied in all tests. Guided by previous model tests involving dynamic loading of reinforced foundations [40, 43, 47], a loading frequency (f) of 2 Hz was used. The amplitude of loading (A) was ±160 kPa; this value was selected based on the relevant provisions [57]. For all tests associated with this paper, the dynamic loading was carried out using the loading method shown in Figure 5. The method of dynamic loading was selected based on the findings by LIU [49]. The termination conditions for the model test were based on the relevant provisions from the Engineering Geology Handbook [57] and the GB50007-2011 Code for design of building foundation [58].
2.3 Test procedure
In all tests involving a reinforced footing, a square size of geogrid was carefully placed at the prescribed depth. The four corners of geogrid were next pinned so as to ensure that no slip occurs during the filling process. When the upper part of geogrid was filled with a certain thickness of sand, the pins were removed and the compaction process of this layer was initiated. The compaction of sand was carried out in accordance with the method suggested by GHOSH et al [28] and SHADMAND et al [32] that involved steel weights (20 kg) and a vibrating base plate compactor (the size of 50 cm×50 cm). To achieve a uniform density, the thickness of the compacted sand layer was typically 15 cm and the sand layer-by-layer filled into the model box (the quality of each layer of the sand was the same). First, each layer was compacted with a steel plate having a mass of 20 kg, dropped 30 times from a height of 50 cm, a thickness of 50 cm×50 cm, and a thickness of 1 cm. Secondly, in order to make the compaction uniform, the electric compaction energy should be made constant so that the advance speed of the plate compactor is kept constant (duration of 5 min). In each of the dynamic model tests the foundation soil was compacted to 95% of standard proctor maximum. The degree of compaction is an important quality control index in the testing program. To ensure consistency of the foundation compaction, the dry density was computed. The densities of samples from the compacted foundation were monitored and controlled by collecting samples in small cylindrical sampler with known volume placed at different locations. Using the method for checking consistency described by GHOSH et al [28] and DASH [59], the difference in densities measured at various locations was found to be within 1%.
The sidewall friction effects on the model results were reduced by coating the inside of the walls with petroleum jelly. During the soil placement and compaction process, the instrumentation was installed at the appropriate depths and connected to the data acquisition system. Once all of the instrumentation was connected and operating, the loading commenced. The square footing was first loaded statically to 200 kPa. The MTS system was then changed to the aforementioned sinusoidal loading with amplitude of ±160 kPa and a frequency of 2 Hz (Figure 5).
3 Results and discussions
3.1 Bearing pressure-foundation settlement response
Figure 6 shows the bearing pressure (p (i.e.,pmax))-foundation settlement (s) curves for the unreinforced and reinforced dynamic model tests performed on the square footing. In this figure, u denotes the depth of the reinforcement layer (see Figure 4). The footing was loaded statically to a stress of 200 kPa. This load was then transformed to a dynamic load in the manner shown in Figure 5. It should be noted that the bearing pressure (p) in Figure 6 and later refer to p were the bearing capacity peak of square footing (pmax). For example, at (50±40) kN, the corresponding peak value was 90 kN, namely that, the bearing capacity peak of square footing was 360 kPa. When the loading is changed from static to dynamic, the footing will be subjected to an excitation shock, thus suddenly increasing the footing settlement during this process.
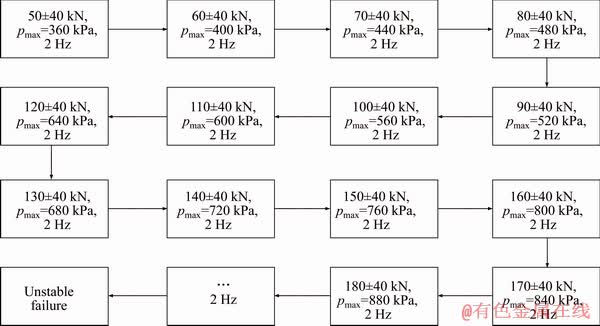
Figure 5 Way of dynamic loading
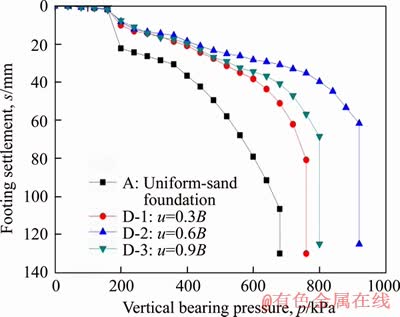
Figure 6 Pressure-settlement curves for unreinforced and reinforced foundation tests
The initial portions of the p-s curves were very nearly linear. This linear response was significantly more pronounced in the three reinforced tests (i.e., D-1, D-2, and D-3). In particular, the unreinforced test results deviated from linearity at a critical edge loading (pcr, i.e., proportional limit loading when transitioning from the compression stage to the shear stage) of 360 kPa. In tests D-1, D-2 and D-3, this occurred at values of 640, 800 and 680 kPa, respectively. These values are 1.8, 2.2 and 1.9 times the pcr value obtained in the unreinforced (i.e., “uniform sand”) test. In the latter three tests, the footing exhibited a stiffer response. Consequently, for a given value of p, the settlement of the reinforced footings was appreciably less than for the unreinforced one.
With increased vertical bearing pressure, the response in the three reinforced tests began to differ, thus showing the effect that the presence and depth of the reinforcement has on the foundation response. As evident from Figure 6, the best response (i.e., least footing settlement for a given bearing pressure) occurred for a reinforcement depth of u=0.6B (i.e., in test D-2). EL SAWWAF [60] reported similar results in model tests on geogrid-reinforced sand. The later stages of loading were characterized by a rapid increase in footing settlement at essentially a constant value of bearing pressure. In this case, the foundation was considered to be in a state of unstable failure. This final pressure value was thus taken to be the ultimate bearing capacity of the foundation, which was largest for the range of 0.3B-0.6B and is consistent with values reported by PRASAD et al [20] and KESKIN et al [29]. This indicated that the optimum depth of the first reinforcement layer obtained from static loading also applied to footings under dynamic loading. However, it was also necessary to note that the value was the maximum in the range of 0.3B-0.6B to obtain the maximum benefit of the bearing capacity on single layer reinforcement. This may be due to the fact that the sand layer between the topmost geogrid layer and the bottom face of the footing was significantly compressed when repeatedly subjected to dynamic loading. This compression effect can improve the compactness of sand and greatly control the transient deformation of reinforced soil to weaken the damage capacity of dynamic loading. Moreover, the mobilized lateral resistance for soil lateral displacement (i.e., geogrid-soil interaction) was higher under dynamic loading, thus resisting the stresses built up in the soil mass beneath the loaded area and transferring them to adjacent stable layers of soil. These results eventually led to the enhancement of the overall stiffness of the foundation structure, so as to the optimum depth of the first layer of reinforcement was so high. Meanwhile, this indicated that the mobilized response of geogrid-reinforcement is more sensitive to the dynamic loading than the static loading.
To better quantify the influence that the geogrid reinforcement has on the dynamic response of the footing, the bearing capacity ratio (BCR, Rbc) was defined as follows [27, 41, 61]:
 (1)
(1)
where qur and qu are the ultimate bearing capacity of a reinforced and unreinforced foundation, respectively. For the present dynamic model tests, the BCR was 1.1 for test D-1; it then increased to 1.4 for test D-2, before decreasing to 1.2 for test D-3. Table 5 summarizes the aforementioned BCR values. These results are explained by the fact that for shallow geogrid depths, the reinforcement-soil interaction is lower than that for the optimal depth. At larger embedment depths, the contribution of the reinforcement to the load transfer mechanism diminishes. These findings are similar to earlier ones reported by LEE and MANJUNATH [7], EL SAWWAF [60] and KESKIN et al [29]. Also listed in Table 5 are the values of the critical pressure (pcr), the maximum (total) foundation settlement (smax), and the ultimate bearing capacity (pu). These values were determined as described in the Engineering Geology Handbook [57].
As seen from the results listed in Table 5, in going from a reinforcement depth (u) of 0.3B (i.e., test D-1) to 0.6B (test D-2), the smax value decreased and the BCR value increased. As u was subsequently increased to 0.9B (test D-3), these trends reversed. Such behavior was consistent with the results of SHADMAND et al [32] and SHEN et al [62], and it is indicated that the geogrid reinforcement has less effect on the response at the greater depth. Thus, for the u values considered in the current testing program, it is evident that the best response was indeed realized for a reinforcement depth of u=0.6B (i.e., in test D-2). On the basis of this improvement, the plastic deformation capacity of foundation is enhanced, thereby effectively reduced the settlement and vastly improved the bearing capacity of foundation.
3.2 Earth pressure response
Figures 7 and 8 show the variation of vertical and horizontal pressure with depth, as measured in each of the four tests, for a footing pressure of 680 kPa. Because this pressure was the ultimate bearing capacity for a uniform-sand foundation, it can be used as a reference value to observe the distribution of earth pressure when a reinforced foundation is subjected to the same pressure. It can also give better insight into the effect that reinforcement has on the bearing capacity of a foundation. In Figures 7 and 8, H denotes the depth at which the vertical or horizontal dynamic earth pressure cell was placed, just below the center of the loading plate (see Figure 4). As evident from these two figures, the smallest earth pressures were measured in Test D-2 (i.e., for u=0.6B), which corresponds to the optimal p-s response among the three reinforcement depths considered in the present study. In general, the vertical earth pressure distributions converged with depth (Figure 7). This is to be expected, as vertical force equilibrium must be satisfied in all of the tests. However, for smaller values of H/B, the depth of reinforcement had significantly more profound effect on the vertical earth pressure, especially for u=0.6B. Although for H/B=0.5, the vertical earth pressure for the case of u=0.9B exceeded the value measured for the unreinforced foundation, this is likely due to an inaccuracy in the pressure readings at small depths. For the u=0.9B reinforcement conditions, the vertical earth pressure at the position of H=0.5B exhibited some anomalies. This is due to the fact that the geogrid for the case of u=0.9B was placed too deep, and the dynamic earth pressure cell of the first layers was located above the geogrid layer. By contrast, the vertical earth pressure at the position of H=1.7B coincided with the behavior of the case of u=0.3B and u=0.6B.
Table 5 Insight into dynamic response of a square footing
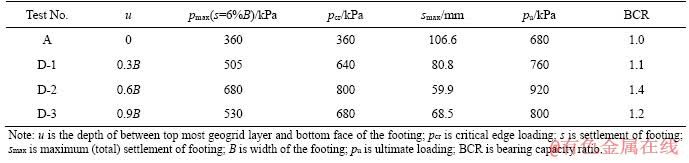
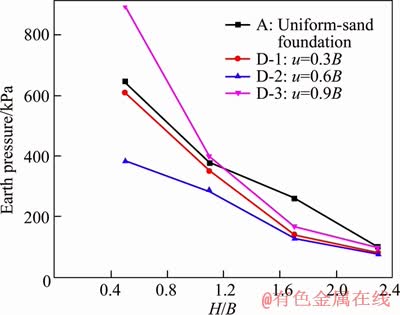
Figure 7 Distribution of vertical earth pressure in foundation soil at different depths
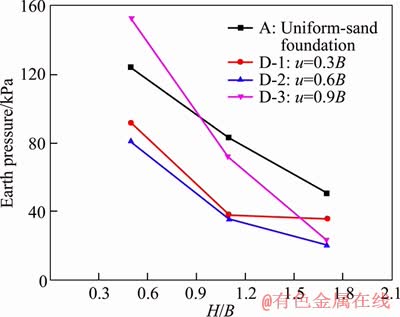
Figure 8 Distribution of horizontal earth pressure in foundation soil at different depths
From Figures 7 and 8, it is also evident that the earth pressure at the same depth under u=0.9B conditions was generally larger than those for the corresponding values of u=0.3B and u=0.6B. However, the value of earth pressure on reinforced foundation was less than the uniform-sand foundation. The effective depth of reinforcement is thus between 0.6B-0.9B for the single-layer reinforced foundation. Such values are higher than those reported by LATHA et al [63], and they indicate that the reinforcement can perhaps exert its effect deeper under dynamic loading. It can thus be concluded that the reinforcement of the single layer reinforced foundation was found to be sensitive to the dynamic loading, and this sensitivity was higher than the static loading. From Figure 7, it is also seen that when the depth of sand was beyond a certain range (i.e., H=1.7B), the curves in all the tests were relatively close to each other. In this case, the beneficial effect of the stress diffusion and strain mobilization of the reinforcement is diminished. This indicates that there exists a vertical “influential area” (i.e., H=1.7B) for the geogrid-reinforcement of single layer reinforced foundation. This value is within a similar range recommended by YETIMOGLU et al [26], SHIN et al [27], GHOSH et al [28], and LATHA et al [63], who found that the effective reinforcement depth is between 1.5B and 2.0B. It can be seen that in both static and dynamic cases, the effective depth for placing reinforcement is in the same range. However, based on the results of the load- settlement response presented in this paper, the excitation of dynamic loading makes the geogrid- soil interaction more significant.
3.3 Acceleration response
Two important quantities related to the dynamic response of reinforced footings are the vertical acceleration reached in the foundation soil and the effect of reinforcement on the attenuation of acceleration with depth below the footings. To investigate these quantities, the vertical acceleration was measured by accelerometers placed at various depths in the soil, located just below the center of the loading plate (see Figure 4).
Figure 9 shows the variation of vertical acceleration with depth (H), as measured in each of the four tests, for a footing pressure of 680 kPa. As seen from this figure, the lowest peak acceleration and greatest amount of attenuation occurred in Test D-2 (i.e., for u=0.6B), which corresponds to the most optimal p-s response among the three reinforcement depths considered in the present study. In this test, the peak vertical acceleration attenuated by 71%. This was 1.2, 1.2 and 2.1 times the total attenuation measured in Tests A, D-1 and D-3 (i.e., for unreinforced sand foundation, u=0.3B and u=0.9B, respectively). Thus, for the optimal depth of reinforcement, the interaction between the reinforcement and the soil will reduce the vertical acceleration of the footing. This reduction in vertical acceleration can be attributed to a geogrid-reinforcement mechanism that is derived from the passive soil resistance and the mobilization of the geogrid. The passive soil resistance and mobilized effect of soil confined in the geogrid apertures, along with particle interlocking limit the lateral deformation of the sand and improve the stiffness of soil. The mobilized effect of the geogrid enables the reinforcement and soil to resist the imposed horizontal shear stresses built up in the soil mass beneath the loaded area and to dissipate them to adjacent stable layers of soil. This, in turn results in a wider and deeper zone that is subjected to load. KESKIN et al [29] and SITHARAM et al [64] reported similar response.
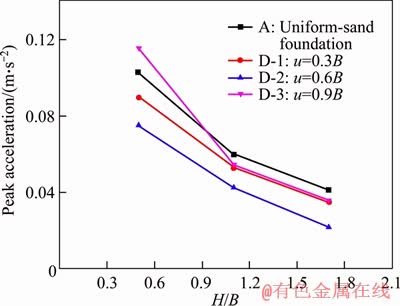
Figure 9 Acceleration response of foundation soil at different depths
Finally, it is timely to note that for H/B>1.0, the vertical accelerations measured in Tests D-1 and D-3 were very close to each other. This indicates that for such H/B values, the reinforcement placed above or below the optimal depth does not profoundly affect the dynamic response of the square footing. It is noteworthy that the aforementioned effective depth (0.6B-0.9B) was also supported by the dynamic response.
3.4 Strain in geogrid reinforcement
Figure 10 shows the variation of geogrid strain with vertical bearing pressure for the three reinforcement depths considered in the present dynamic model tests. In the case of u=0.3B (Test D-1), the strain in the geogrid was minimum appreciably before the vertical bearing pressure (p) exceeded the critical value (pcr) of 640 kPa (see Table 5). This is similar to the so-called “deep-footing effect” described by ZHOU et al [53]. Therefore, the effect of geogrid in the case of u=0.3 B was mainly a “deep-footing effect” rather than the “mobilized tension effect” of geogrid- reinforcement. The “deep-footing effect” can actually be equivalent to increasing the embedment depth of footing on the relatively shallow unreinforced foundation. Combined with the effect of reinforcement, the bearing capacity of the footing can thus be improved. When the ultimate bearing capacity of the foundation was reached, the maximum tensile strain in the geogrid was approximately 8.0% for the case of u=0.3 B. At this strain level, the tensile strength of the geogrid was not fully reached, though some local failure was observed after unloading and extracting it from the foundation soil. The reason for this may be due to damage to the reinforcement caused by the excessive impact force from the loading plate in the later stages of loading.
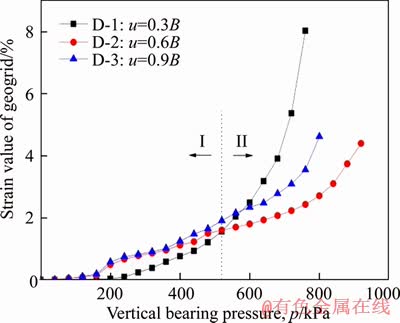
Figure 10 Variations in geogrid strain with bearing pressure and reinforcement depth
By contrast, the lowest level of maximum geogrid strain (approximately 4.4%) and lowest strain were measured in Test D-2 (i.e., for u=0.6B), which has already been associated with the most optimal pressure-settlement and vertical acceleration response. Following unloading and extraction, the geogrid was found to be undamaged. The increased ultimate load is attributed to the mobilized tension in the reinforcement, which limits the spreading and lateral deformation of sand particles [8, 59]. As evident from Figure 10, the response of the geogrid-reinforcement under the condition of u=0.6B consists of two stages. In the first stage, when p is relatively small, the effect of geogrid was mainly the “mobilized tension”. In this stage, the test results show that the strain in the geogrid increases proportionally with p. In the second stage, the strain increment in the geogrid decreased appreciably after p exceeded the value of 520 kPa. With the increased excitation of the dynamic load, the contact between the geogrid and the soil particles was increasingly through adhesion, due to the compaction of soil and the friction along soil-geogrid interfaces. Consequently, the tensile strain of the geogrid was restrained. The maximum geogrid strain measured in Test D-3 (approximately 4.6%) was quite similar to that for Test D-2. When examined after unloading, the geogrid was once again undamaged.
The geogrid will typically produce repeated “stretching effects” due to the amplitude and frequency of dynamic loading. The maximum benefit of this effect commonly occurs when the reinforcement is placed at the optimal value of the u/B ratio, where mobilized lateral resistance of lateral soil displacement was maximum under dynamic loading. QIAN et al [48] reported the similar findings for the tensioned membrane effect of geogrids for reinforced footings subjected to cyclic loading. These results again indicate the importance of using an optimal depth of first reinforcement layer in shallow footings subjected to dynamic loading. In addition, for the aforementioned acceleration response, the attenuation of the acceleration also is influenced by the “stretching effect” of geogrid.
3.5 Deformation and failure modes of footing
Figure 11 shows the failure mode at the surface of the model box for all four dynamic model tests. The failure criterion of the experiment was based on the relevant provisions in the “Code for Design of Building Foundation” [58]. The extent of cracking and deformation of the surface soil differed with the depth of reinforcement. At the ultimate state in the unreinforced test, the loading plate settled but did not rotate (Figure 11(a)). Small cracks developed at the four corners of the plate. No failure-surfaces were observed in the surrounding soil. The failure mode of the unreinforced foundation was thus a punching shear failure. EL SAWWAF et al [47] also reported such shear failure of footings on dense sand subjected to dynamic loads tests. In general, a shear failure would be expected in foundations on medium to dense sands. The present results suggest that the load transfer mechanism in the soil is influenced by the dynamic load, thus leading to the aforementioned punching shear failure of the foundation.
For a reinforcement depth of 0.3B, minor surface cracking was observed (Figure 11(b)). This is consistent with the aforementioned “deep-footing effect” exhibited by the footing in this test. For the optimal reinforcement depth of 0.6B, surface cracking and deformation was more pronounced than the case with u=0.3B (Figure 11(c)). This is largely explained by the fact that the reinforced foundation with u=0.6B has a higher bearing capacity (see Table 5). Finally, increasing the reinforcement depth to 0.9B results in increased settlement and rotation of the footing. In addition, some cracking of the soil surface is evident in the model box (Figure 11(d)). However, according to the deformation phenomena of the surface sand under dynamic tests, all of the reinforced foundations exhibited a general shear failure.
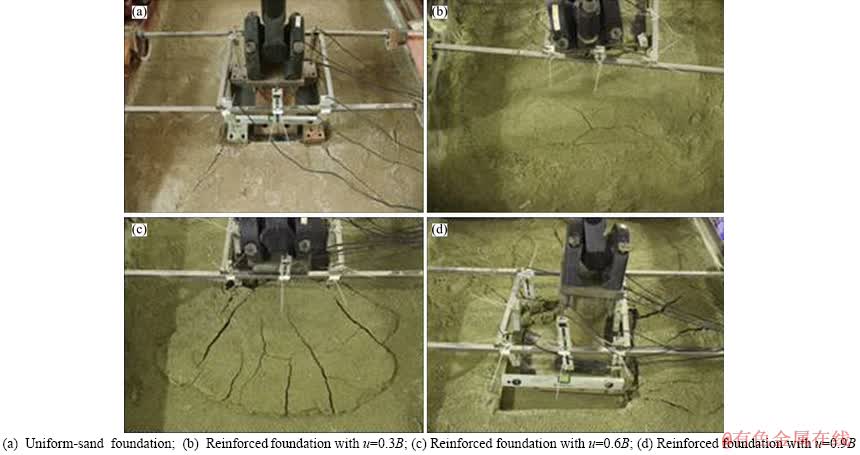
Figure 11 Ground surface condition of foundation in failure state:
3.6 Sensitivity of embedment depth to static and dynamic loading
In designing reinforced foundations, it is desirable to determine the optimal reinforcement depth. Table 6 lists information related to computation of optimal depth of first reinforcement layer. Based on theoretical considerations, LIANG et al [1] proposed the following approximate solution of the ultimate bearing capacity (qur) of the single layer reinforced foundation for a given depth of reinforcement (zi):


 (2)
(2)
where B is as previously defined, and
 (3)
(3)
 (4)
(4)
 (5)
(5)
 (6)
(6)
where φ is the internal friction angle of foundation soil, c is the cohesion intercept of soil, f ' is the friction coefficient at the interface of reinforced-soil, γ is the unit weight of soil, η is the unit width of the reinforcement rate, L1 is the length of reinforcement, H2 is the embedment depth of the footing for the shallow foundation, Nq, Nc and Nγ are the bearing capacity factors of the rough substrate.
The ultimate bearing capacity is calculated using Eqs. (2)-(6). By analyzing Eq. (2), it is shown that the maximum reinforcement effect in a reinforced foundation can be obtained when Eq.(3) takes a maximum value. The optimal depth of reinforcement layer is thus:
 (7)
(7)
Although it is likely that the value of zi is a function more simply than B and φ, LIANG’s expression is used herein as a theoretical reference value.
Table 6 Information related to computation of optimal depth of first reinforcement layer
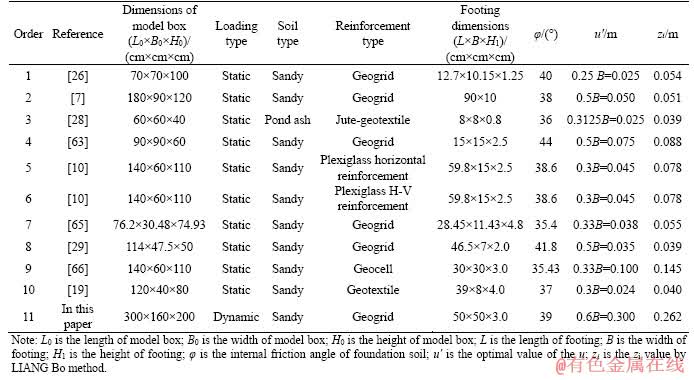
The last column in Table 6 summarizes zi values computed for a number of model tests and compares these values with the experimentally determined optimal depth (u'=the optimal of the u). Although in some cases the agreement between u' and zi is quite good, discrepancies are noted in the majority of the other cases. For static loading, the experimental value of u' is less than the theoretical value of zi; by contrast, the u' is higher than zi for dynamic loading. Such lack of agreement is likely due to the type of loading used in the tests. The theoretical value is regarded herein as the boundary value to evaluate the sensitivity of the u' to load type. On this basis, this discrepancy suggests that u' has different sensitivity to static and dynamic loading; the sensitivity of dynamic loading is higher than static loading. Similar results were reported by TAFRESHI et al [40], EL SAWWAF et al [47], QIAN et al [48], and VENKATESWARLU et al [55].
4 Conclusions
This paper presents the results of a series of dynamic model tests performed on a geogrid- reinforced square footing. The dynamic (sinusoidal) loading is applied using a MTS electro-hydraulic servo loading system. In all the tests, the amplitude of loading is ±160 kPa and the loading frequency is 2 Hz. To better ascertain the effect of reinforcement, an unreinforced square footing is also tested. This is followed by a series of tests, each with a single layer of reinforcement. The reinforcement is placed at depths of 0.3B, 0.6B and 0.9B. The following conclusions are reached based on the aforementioned series of dynamic model tests.
1) Compared to the unreinforced footing, the bearing capacity ratio of reinforced foundation increases by factors of 1.1, 1.4 and 1.2, respectively, for three reinforcement depths of 0.3B, 0.6B and 0.9B.
2) For the three reinforced tests performed, the optimal depth of reinforcement is found to be 0.6B. For this depth, the foundation settlement for a given bearing pressure is minimal; the peak vertical acceleration in the soil is minimized while increasing the amount of attenuation.
3) Under dynamic loading, for a reinforcement depth of 0.3B, the footing exhibited a strong deep- footing effect. The reinforced foundation with single layer of geogrid has an effective reinforcement depth of the 1.7B below the footing base. Beyond this area, the reinforcing effect of the foundation must be determined in conjunction with other factors related to the reinforcement.
4) The dynamic load influences the load transfer mechanism in the soils. This leads to the punching shear failure of the unreinforced foundation. The amount of deformation of the surface soil differs with reinforcement depth. Meanwhile, the increase of u (within the range of 0.9B) did not change the failure mode of the foundation with the single layer reinforcement under dynamic loading, all of which belonged to the general shear failure.
5) Based on the comparison between theoretical value and experimental values, the discrepancy of results suggests that the value of u' has different sensitivity to static and dynamic loading. The sensitivity of dynamic loading is higher than static loading.
6) The dynamic (sinusoidal) loading subjects the soil and geogrid to repeated vibratory compaction to form a dynamic soil interface effect that is a function of the amplitude and frequency of loading. This increases the stiffness of the reinforced-soil structure and reduces the transient deformation of the reinforced shallow foundation.
Notations
A
Amplitude of dynamic (sinusoidal) loading, Pa
B
Width of footing, m
BCR
Bearing capacity ratio
c
Cohesion intercept of soil, Pa
Cu
Uniformity coefficient of soil
Cc
Curvature coefficient of the soil
D10
An effective particle size of the soil, m
D30
Median particle size of the soil, m
D60
Constrained grain size of the soil, m, namely, soil particle diameter at which 30% and 60% of the mass of a soil specimen is finer, respectively
f
Frequency of dynamic (sinusoidal) loading, Hz
f ′
Friction coefficient at the interface of reinforced-soil
H
Vertical embedment depth of test acquisition instrument, m
H0
Height of model box, m
H1
Height of footing, m
H2
Embedment depth of the footing for the shallow foundation, m
L
Length of footing, m
L0
Length of model box, m
L1
Length of the reinforcement, m
N
Number of reinforcement layers
Nq , Nc , Nγ
Bearing capacity factor of rough substrate
p
Bearing capacity of the square footing, Pa
pcr
Critical edge loading, Pa
pmax
Bearing capacity peak of square footing, Pa
pu
Ultimate loading, Pa
qur
Ultimate bearing capacity of reinforced foundation, Pa
qu
Ultimate bearing capacity of unreinforced foundation, Pa
s
Settlement of footing, m
smax
Maximum (total) settlement of footing, m
u
Depth of between the top most geogrid layer and the bottom face of the footing, m
u'
Optimal u, m
zi
zi value of LIANG Bo method, m
γ
Unit weight of soil/(N・m-3)
η
Unit width of the reinforcement rate, %
φ
Internal friction angle of foundation soil, (°)
References
[1] LIANG Bo, YANG You-hai. Theory and experiment on bearing capacity of reinforced sandy soil [J]. Chinese Journal of Geotechnical Engineering, 2008, 30(1): 123-127. DOI: 10.3321/j.issn:1000-4548.2008.01.019. (in Chinese)
[2] TAFRESHI M S N, KHALAJ O, DAWSON A R. Repeated loading of soil containing granulated rubber and multiple geocell layers [J]. Geotextile and Geomembranes, 2014, 42(1): 25-38. DOI: 10.1016/j.geotexmem.2013.12. 003.
[3] KHALAJ O, DAVARIFARD S, TAFRESHI M S N, MA?EK B. Cyclic response of footing with embedment depth on multi-layered geocell-reinforced bed [C]// World Multidisciplinary Earth Sciences Symposium (WMESS 2016). IOP Conference Series: Earth and Environmental Science. Prague, Czech Republic: IOP Publishing, 2016, 44(2): 022015. DOI: 10.1088/1755-1315/44/2/022015.
[4] SHAHIN H M, NAKAI T, MORIKAWA Y, MASUDA S, MIO S. Effective use of geosynthetics to increase bearing capacity of shallow foundations [J]. Canadian Geotechnical Journal, 2017, 54(12): 1647-1658. DOI: 10.1139/cgj-2016- 0505.
[5] MEHRANNIA N, KALANTARY F, GANJIAN N. Experimental study on soil improvement with stone columns and granular blankets [J]. Journal of Central South University, 2018, 25(4): 866-878. DOI: 10.1007/s11771- 018-3790-z.
[6] HASSOUN M, VILLARD P, AL HEIB M, EMERIAULT F. Soil reinforcement with geosynthetic for localized subsidence problems: Experimental and analytical analysis [J]. International Journal of Geomechanics, 2018, 18(10): 04018133. DOI: 10.1061/(ASCE)GM.1943-5622.0001265.
[7] LEE K M, MANJUNATH V R. Experimental and numerical studies of geosynthetic-reinforced sand slopes loaded with a footing [J]. Canadian Geotechnical Journal, 2000, 37(4): 828-842. DOI: 10.1139/cgj-37-4-828.
[8] SITHARAM T G, SIREESH S, DASH S K. Model studies of a circular footing supported on geocell-reinforced clay [J]. Canadian Geotechnical Journal, 2005, 42(2): 693-703. DOI: 10.1139/t04-117.
[9] PENG F L, LI J Z, TATSUOKA F. Numerical study on deformation and failure of reinforced sand [J]. Journal of Central South University of Technology, 2005, 12(2): 220- 224. DOI: 10.1007/s11837-005-0087-0.
[10] HOU Juan, ZHANG Meng-xi, ZHANG Tao-tao, CHEN Tong. Experimental research on effect of horizontal-vertical reinforcement configurations on foundations [J]. Rock and Soil Mechanics, 2011, 32(8): 2365-2370. DOI: 10.3969/j.issn.1000-7598. 2011.08.020. (in Chinese)
[11] MOGHADDAS TAFRESHI S N, NOROUZI A H. Bearing capacity of a square model footing on sand reinforced with shredded tire-An experimental investigation [J]. Construction and Building Materials, 2012, 35: 547-556. DOI: 10.1016/ j.conbuildmat.2012.04.092.
[12] LIN Y L, ZHANG M X, JAVADI A A, LU Y, ZHANG S L. Experimental and DEM simulation of sandy soil reinforced with H-V inclusions in plane strain tests [J]. Geosynthetics International, 2013, 20(3): 162-173. DOI: 10.1680/gein.13. 00009.
[13] TAFRESHI M S N, RAHIMI M, DAWSON A, LESHCHINSKY B. Cyclic and post-cycling anchor response in geocell-reinforced sand [J]. Canadian Geotechnical Journal, 2018, 56(11) 1700-1718. DOI: 10.1139/cgj-2018-0559.
[14] XU J S, DU X L. Energy analysis of geosynthetic-reinforced slope in unsaturated soils subjected to steady flow [J]. Journal of Central South University, 2019, 26(7): 1769-1779. DOI: 10.1007/s11771-019-4132-5.
[15] BADAKHSHAN E, NOORZAD A. Effect of footing shape and load eccentricity on behavior of geosynthetic reinforced sand bed [J]. Geotextiles and Geomembranes, 2017, 45(2): 58-67. DOI: 10.1016/j.geotexmem.2016.11.007.
[16] ROY S S, DEB K. Effects of aspect ratio of footings on bearing capacity for geogrid-reinforced sand over soft soil [J]. Geosynthetics International, 2017, 24(4): 362-382. DOI: 10.1680/jgein.17.00008.
[17] MOGHADDAS TAFRESHI S N, KHALAJ O. Laboratory tests of small-diameter HDPE pipes buried in reinforced sand under repeated-load [J]. Geotextiles and Geomembranes, 2008, 26(2): 145-163. DOI: 10.1016/j.geotexmem.2007. 06.002.
[18] CHEN J F, GUO X P, XUE, J F, GUO P H. Load behaviour of model strip footings on reinforced transparent soils [J]. Geosynthetics International, 2019, 26(3): 251-260. DOI: 10.1680/jgein.19.00003.
[19] KAZI M, SHUKLA S K, HABIBI D. Behaviour of an embedded footing on geotextile-reinforced sand [J]. Proceedings of the Institution of Civil Engineers-Ground Improvement, 2015, 169(2): 120-133. Doi: 10.1680/grim.14. 00022.
[20] PRASAD B D, HARIPRASAD C, UMASHANKAR B. Load-settlement response of square footing on geogrid reinforced layered granular beds [J]. International Journal of Geosynthetics and Ground Engineering, 2016, 2(4): 1-10. DOI: 10.1007/s40891-016-0070-6.
[21] TAFRESHI M S N, KHALAJ O, HALVAEE M. Experimental study of a shallow strip footing on geogrid-reinforced sand bed above a void [J]. Geosynthetics International, 2011, 18(4): 178-195. DOI: 10.1680/gein.2011. 18.4.178.
[22] GILL K S, CHOUDHARY A K, JHA J N, SHUKLA S K. Experimental and numerical studies of loaded strip footing resting on reinforced fly ash slope [J]. Geosynthetics International, 2013, 20(1): 13-25. DOI: 10.1680/gein. 12.00036.
[23] HARIKUMAR M, SANKAR N, CHANDRAKARAN S. Behaviour of model footing resting on sand bed reinforced with multi-directional reinforcing elements [J]. Geotextiles and Geomembranes, 2016, 44(4): 568-578. DOI: 10.1016/j.geotexmem.2016.03.008.
[24] MOGHADDAS TAFRESHI S N, KHALAJ O, DAWSON A R. Pilot-scale load tests of a combined multi-layered geocell and rubber-reinforced foundation [J]. Geosynthetics International, 2013, 20(3): 143-161. DOI: 10.1680/gein.13. 00008.
[25] WANG Xiao-cun. Experimental researches and PFC numerical simulation for reinforcing mechanism and failure models of reinforced sand foundation [D]. Shanghai, China: Tongji University, 2006. DOI: 10.7666/d.y846778. (in Chinese)
[26] YETIMOGLU T, WU J T H, SAGLAMER A. Bearing capacity of rectangular footings on geogrid-reinforced sand [J]. Journal of Geotechnical Engineering, 1994, 120(12): 2083-2099. DOI: 10.1061/(ASCE)0733-9410(1994)120: 12(2083).
[27] SHIN E C, DAS B M, LEE E S, ATALAR C. Bearing capacity of strip foundation on geogrid-reinforced sand [J]. Geotechnical and Geological Engineering, 2002, 20(2): 169-180. DOI: 10.1023/A:1015059427487.
[28] GHOSH A, GHOSH A, BERA A K. Bearing capacity of square footing on pond ash reinforced with jute-geotextile [J]. Geotextiles and Geomembranes, 2005, 23(2): 144-173. DOI: 10.1016/j.geotexmem.2004.07.002.
[29] KESKIN M S, LAMAN M. Experimental and numerical studies of strip footings on geogrid-reinforced sand slope [J]. Arabian Journal for Science and Engineering, 2014, 39(3): 1607-1619. DOI: 10.1007/s13369-013-0795-7.
[30] MARTO A, OGHABI M, EISAZADEH A. The effect of geogrid reinforcement on bearing capacity properties of soil under static load: A review [J]. Electronic Journal of Geotechnical Engineering, 2013, 18: 1881-1898. http://www.ejge.com/2013/Ppr2013.181alr.pdf.
[31] ALTALHE E B, TAHA M R, ABDRABBO F M. Behavior of strip footing on reinforced sand slope [J]. Journal of Civil Engineering and Management, 2015, 21(3): 376-383. DOI: 10.3846/13923730.2014.890646.
[32] SHADMAND A, GHAZAVI M, GANJIAN N. Load-settlement characteristics of large-scale square footing on sand reinforced with opening geocell reinforcement [J]. Geotextiles and Geomembranes, 2018, 46(3): 319-326. DOI: 10.1016/j.geotexmem.2018.01.001.
[33] YAMAMOTO K, KUSUDA K. Failure mechanisms and bearing capacities of reinforced foundations [J]. Geotextiles and Geomembranes, 2001, 19(3): 127-162. DOI: 10.1016/S0266-1144(01)00003-6.
[34] XU C, LIANG C, SHEN P. Experimental and theoretical studies on the ultimate bearing capacity of geogrid- reinforced sand [J]. Geotextiles and Geomembranes, 2019, 47(3): 417-428. DOI: 10.1016/j.geotexmem.2019.01.003.
[35] LI Guang-xin. Some problems in design of geosynthetic- reinforced soil structures [J]. Chinese Journal of Geotechnical Engineering, 2013, 35(4): 605-610. DOI: 10.3969/j.issn. 1007-9580.2013.01.011. (in Chinese)
[36] CHAKRABORTY D, KUMAR J. Bearing capacity of strip foundations in reinforced soils [J]. International Journal of Geomechanics, 2012, 14(1): 45-58. DOI: 10.1061/(ASCE) GM.1943-5622.0000275.
[37] CHEN Q, ABU-FARSAKH M. Ultimate bearing capacity analysis of strip footings on reinforced soil foundation [J]. Soils and Foundations, 2015, 55(1): 74-85. DOI: 10.1016/j.sandf.2014.12.006.
[38] GAO Y, YANG S, ZHANG F, LESHCHINSKY, B. Three-dimensional reinforced slopes: evaluation of required reinforcement strength and embedment length using limit analysis [J]. Geotextiles and Geomembranes, 2016, 44(2): 133-142. DOI: 10.1016/j.geotexmem.2015.07.007.
[39] HOU J, ZHANG M, DAI Z, LI J Z, ZENG F F. Bearing capacity of strip foundations in horizontal-vertical reinforced soils [J]. Geotextiles and Geomembranes, 2017, 45(1): 29-34. DOI: 10.1016/j.geotexmem.2016.07.001.
[40] TAFRESHI M S N, DAWSON A R. Behaviour of footings on reinforced sand subjected to repeated loading-Comparing use of 3D and planar geotextile [J]. Geotextiles and Geomembranes, 2010, 28(5): 434-447. DOI: 10.1016/j.geotexmem.2009.12.007.
[41] ABU-FARSAKH M, CHEN Q, SHARMA R. An experimental evaluation of the behavior of footings on geosynthetic-reinforced sand [J]. Soils and Foundations, 2013, 53(2): 335-348. DOI: 10.1016/j.sandf.2013.01.001.
[42] SARIDE S, RAYABHARAPU V K, VEDPATHAK S. Evaluation of rutting behaviour of geocell reinforced sand subgrades under repeated loading [J]. Indian Geotechnical Journal, 2015, 45(4): 378-388. DOI: 10.1007/s40098-014- 0120-8.
[43] TAFRESHI M S N, DAWSON A R. A comparison of static and cyclic loading responses of foundations on geocell-reinforced sand [J]. Geotextiles and Geomembranes, 2012, 32(32): 55-68. DOI: 10.1016/ j.geotexmem.2011.12.003.
[44] TURKER E, SADOGLU E, CURE E, UZUNER B A. Bearing capacity of eccentrically loaded strip footings close to geotextile-reinforced sand slope [J]. Canadian Geotechnical Journal, 2014, 51(8): 884-895. DOI: 10.1139/ cgj-2014-0055.
[45] TAFRESHI M S N, KHALAJ O. Analysis of repeated-load laboratory tests on buried plastic pipes in sand [J]. Soil Dynamics and Earthquake Engineering, 2011, 31(1): 1-15. DOI: 10.1016/j.soildyn.2010.06.016.
[46] KHALAJ O, DARABI J N, TAFRESHI M S N, MA?EK B. Protection of buried pipe under repeated loading by geocell reinforcement [C]// World Multidisciplinary Earth Sciences Symposium (WMESS 2017). Prague, Czech Republic: IOP Publishing, 2017: 022030. DOI: 10.1088/1755-1315/95/2/ 022030.
[47] EL SAWWAF M A, NAZIR A K. Cyclic settlement behavior of strip footings resting on reinforced layered sand slope [J]. Journal of Advanced research, 2012, 3(4): 315-324. DOI: 10.1016/j.jare.2011.10.002.
[48] QIAN Y, HAN J, POKHAREL S K, PARSONS R L. Performance of triangular aperture geogrid-reinforced base courses over weak subgrade under cyclic loading [J]. Journal of Materials in Civil Engineering, 2012, 25(8): 1013-1021. DOI: 10.1061/(ASCE)MT.1943-5533.0000577.
[49] LIU Ze. Test study numerical analysis on the static and dynamic characteristic of eco-reinforced earth retaining wall [D]. Changsha, China: Central South University, 2012. DOI: 10.7666/ d.y2197992. (in Chinese)
[50] XU R, FATAHI B. Influence of geotextile arrangement on seismic performance of mid-rise buildings subjected to MCE shaking [J]. Geotextiles and Geomembranes, 2018, 46(4): 511-528. DOI: 10.1016/j.geotexmem.2018.04.004.
[51] KHALAJ O, TAFRESHI M S N, MA?EK B, DAWSON A R. Improvement of pavement foundation response with multi-layers of geocell reinforcement: Cyclic plate load test [J]. Geomechanics and Engineering, 2015, 9(3): 373-395. DOI: 10.12989/gae.2015.9.3.373.
[52] KHALAJ O, DARABI J N, TAFRESHI M S N, JENICEK S. Damping ratio of foundation bed with multilayered rubber-soil mixture [C]// World Multidisciplinary Earth Sciences Symposium (WMESS 2018), IOP Conference Series: Earth and Environmental Science. Prague, Czech Republic: IOP Publishing, 2019: 012008. DOI: 10.1088/ 1755-1315/ 221/1/012008.
[53] ZHOU Jian, KONG Xiang-li, WANG Xiao-cun. Bearing capacity behaviours and failure models of reinforced ground [J]. Chinese Journal of Geotechnical Engineering. 2008, 30(9): 1265-1269. DOI: 10.3321/j.issn:1000-4548.2008.09. 001. (in Chinese)
[54] WANG Jia-quan, ZHANG Liang-liang, LIU Zheng-quan, ZHOU Yuan-wu. Large model test on geogrid reinforced sand soil foundation under dynamic loading [J]. Rock and Soil Mechanics, 2018, 39(10): 3539-3547. DOI: 10.16285/j.rsm.2017.0191. (in Chinese)
[55] VENKATESWARLU H, UJJAWAL K N, HEGDE A. Laboratory and numerical investigation of machine foundations reinforced with geogrids and geocells [J]. Geotextiles and Geomembranes, 2018, 46(6): 882-896. DOI: 10.1016/j.geotexmem.2018.08.006.
[56] OLIAEI M, KOUZEGARAN S. Efficiency of cellular geosynthetics for foundation reinforcement [J]. Geotextiles and Geomembranes, 2017, 45(2): 11-22. DOI: 10.1016/ j.geotexmem.2016.11.001.
[57] Engineering Geology Handbook Compilation Committee. Engineering geology handbook [M]. Fourth Edition. Beijing: China Architecture and Building Press, 2007: 218-224. (in Chinese)
[58] Ministry of Housing and Urban-Rural Development of the People’s Republic of China. GB50007-2011, code for design of building foundation [S]. Beijing: China Architecture and Building Press, 2011: 53-54. (in Chinese)
[59] DASH S K. Effect of geocell type on load-carrying mechanisms of geocell-reinforced sand foundations [J]. International Journal of Geomechanics, 2011, 12(5): 537-548. DOI: 10.1061/(ASCE)GM.1943-5622.0000162.
[60] EL SAWWAF M A. Behavior of strip footing on geogrid-reinforced sand over a soft clay slope [J]. Geotextiles and Geomembranes, 2007, 25(1): 50-60. DOI: 10.1016/j.geotexmem.2006.06.001.
[61] YUN D H, KIM Y T. Experimental study on settlement and scour characteristics of artificial reef with different reinforcement type and soil type [J]. Geotextiles and Geomembranes, 2018, 46(4): 448-454. DOI: 10.1016/ j.geotexmem.2018.04.005.
[62] SHEN Pan-pan, XU Chao. Numerical analysis of the bearing capacity of geosynthetic reinforced soil foundation [J]. Journal of Yangtze River Scientific Research Institute, 2014, 31(3): 106-110. DOI: 10.3969/j.issn.1001-5485.2014.03.018. (in Chinese)
[63] LATHA G M, SOMWANSHI A. Bearing capacity of square footings on geosynthetic reinforced sand [J]. Geotextiles and Geomembranes, 2009, 27(4): 281-294. DOI: 10.1016/ j.geotexmem.2009.02.001.
[64] SITHARAM T G, SIREESH S. Model studies of embedded circular footing on geogrid-reinforced sand beds [J]. Proceedings of the Institution of Civil Engineers-Ground Improvement, 2004, 8(2): 69-75. DOI: 10.1680/grim.2004. 8.2.69.
[65] KOLAY P K, KUMAR S, TIWARI D. Improvement of bearing capacity of shallow foundation on geogrid reinforced silty clay and sand [J]. Journal of Construction Engineering, 2013, 12: 1-10. DOI: 10.1155/2013/293809.
[66] HAN Xiao, ZHANG Meng-xi, LI Jia-yang, JIANG Sheng- wei. Model test of sand foundation reinforced with high- strength geocell [J]. Journal of Yangtze River Scientific Research Institute. 2014, 31(3): 27-33. DOI: 10.3969/j.issn. 1001-5485.2014.03.004. (in Chinese)
(Edited by FANG Jing-hua)
中文导读
土工格栅加筋方形基础受反复荷载作用的承载特性
摘要:本文介绍了土工格栅加筋砂土地基方形基础的系列动载模型试验研究结果。采用力学测试与仿真电液伺服加载系统对砂土地基施加反复荷载(正弦)作用。在所有的动载试验中,加载振幅为±160 kPa,加载频率为2 Hz。为了更好地研究加筋效果,首先对未加筋地基的承载性能进行了动载试验。随后分别针对加筋深度为0.30B,0.60B和0.90B的单层加筋砂土地基开展了系列动载试验(B为基础宽度)。结果表明,单层加筋地基在反复荷载作用下最佳的加筋深度为0.60B。同时,试验结果量化了采用最佳加筋深度与其他两个加筋深度对加筋地基承载性能的影响。单层土工格栅的有效加筋深度为基础底部以下1.7B的范围内。对于单层加筋地基,最顶层的土工格栅到方形基础底部之间距离的增加(在0.9B范围内)不会改变加筋地基的破坏模式。
关键词:反复荷载;土工格栅;方形基础;加筋深度;承载力
Foundation item: Projects(41962017, 51469005) supported by the National Natural Science Foundation of China; Project(2017GXNSFAA198170) supported by the Natural Science Foundation in Guangxi Province, China; Project supported by the Guangxi University of Science and Technology Innovation Team Support Plan, China; Project supported by the High Level Innovation Team and Outstanding Scholars Program of Guangxi Institutions of Higher Learning, China
Received date: 2019-09-27; Accepted date: 2019-12-05
Corresponding author: WANG Jia-quan, PhD, Professor; Tel: +86-772-2686010; E-mail: wjquan1999@163.com; ORCID: 0000-0002- 8887-3388

