J. Cent. South Univ. Technol. (2011) 18: 285-289
DOI: 10.1007/s11771-011-0692-8
Prediction model of residual stress field in aluminum alloy plate
GONG Hai(龚海), WU Yun-xin(吴运新), LIAO Kai(廖凯)
School of Mechanical and Electrical Engineering, Central South University, Changsha 410083, China
? Central South University Press and Springer-Verlag Berlin Heidelberg 2011
Abstract: Residual stress distributions in 7075 aluminum alloy thick plates with different thicknesses and different quenching speeds were measured. A shape function of stress distribution was proposed based on the internal stress distribution characteristics of aluminum alloy. Using nonlinear regression technology, the function between stress value of key points on internal stress curve and surface stress of the plate was obtained. Based on the measured surface stress, stress value of key points and stress distribution shape, the internal stress distribution can be reconstructed. The experiments show that the model is of good engineering practicality.
Key words: aluminum alloy; residual stress; thick plate; surface stress; prediction model
1 Introduction
Wrought aluminum alloys are used for aerospace applications because of their good property combination of high strength, stress-corrosion-cracking resistance, and toughness [1]. The quenching process that results in high strength also leaves high residual stresses always up to 200 MPa, which cannot be thermally relieved while maintaining the favorable mechanical properties of the alloy. To reduce the high level residual stresses, additional technologies such as pre-stretching are needed. Thus, predicting the inner quenching residual stresses in aluminum alloy plate quickly and rightly is of great help for adjusting quenching technology and establishing reasonable stress relieving scheme.
At present, study on residual stress of aluminum alloy plate is mainly focused on numerical simulation [2-6] and experiment research [1, 7-9]. There are several problems in these studies. 1) Numerical simulations are based on lots of idealized hypotheses. Some key boundary conditions and initial conditions such as surface heat exchanging coefficients during quenching can only be obtained by experiment, which increases the simulation difficulty and inevitably influences the precision. 2) For single experiment methods, X-ray diffraction and drilling are only fit for surface stress, while crack compliance method, layer removal method and layer by layer drilling are fit for inner stress test. However, these methods need special specimens and are time-consuming, therefore they are not suitable for engineering applications.
In this work, internal residual stress in aluminum alloy plates with different thicknesses and different quenching speeds were studied in-depth.
2 Residual stress distribution rules
2.1 Experiments
Internal residual stresses in aluminum alloy plates with different thicknesses and different quenching speeds were tested. Thick plates of 7075 aluminum alloy with dimensions of 1 200 mm×220 mm×(30, 40, 50) mm were chosen for study. After solution heat treatment, the plates were quenched with three different quenching speeds using 20 °C water: immerging quench, high speed spraying quench (hydraulic pressure: about 0.8 MPa, current flux: about 300 L/min), and low speed spraying quench (hydraulic pressure: about 0.34 MPa, current flux: about 136 L/min).
The surface residual stress was measured using the Proto X-ray-diffraction stress measurement system, while the internal residual stress in the plates was measured using crack compliance method [8, 10-15].
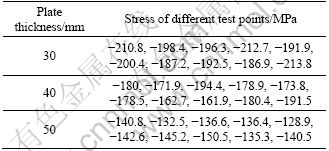
The internal stress distributions in immerging quenched plates of different thicknesses are shown in Fig.1, in which X-coordinate is normalized by plate thickness d. Surface stress values are listed in Table 1, in which ten points of different positions were tested for each plate of different thicknesses. Compared with Fig.1, it can be seen that the internal stress results are in good accordance with the surface stress results, which validates the accuracy of the internal stress results.
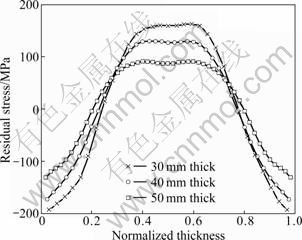
Fig.1 Residual stress in quenched aluminum alloy plates
Table 1 X-ray diffraction results of surface stress
2.2 Analysis
Normalized stress distributions of Fig.1 are shown in Fig.2, in which X-coordinate and Y-coordinate are normalized by plate thickness and surface stress, respectively. It can be seen that, stress distributions in plates of different thicknesses have similar rules. On the whole, the stress distribution is like a parabola; near surface there exists great stress gradient; while at the core the stress changes gently. Near surface there exists the peak value of the compressive stress, while over a layer of 0.3 to 0.7 times the thickness, there exists peak value of the tensile stress. The tensile stress peak value is approximately 3/4 of the compressive stress peak value.
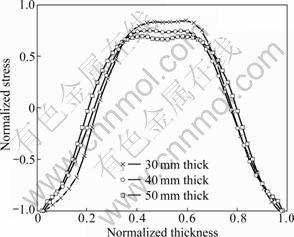
Fig.2 Normalized stress distributions in quenched aluminum alloy plates
According to the similarity of stress distributions in aluminum alloy plates, if stress values of key points (the peak value of the tensile stress at thickness center) can be obtained, then the stress distribution can be obtained.
3 Shape function of stress distribution
Stress distribution curves from experiments were normalized by surface stress, and the normalized stress corresponding to the normalized thickness was obtained by statistical method. A shape function of the residual stress distribution was constructed by fitting the data points based on Legendre series, which can be expressed as a function of normalized thickness z:


 (1)
(1)
4 Regression of key points
4.1 Model design
Plate thickness and heat exchanging speed are main factors that influence the residual stress. The influence of these factors on σk (stress value of key points, namely peak value of tensile stress) is supposed to be expressed as
 (2)
(2)
where C, A and B are constants, and σs is the surface stress.
According to theory of heat transfer, the quenching process of aluminum plate can be simplified as a one-dimensional heat transfer problem, which follows the heat exchange equation (Eq.(2)) and the boundary condition (Eq.(3)):
 (3)
(3)
where Z is the coordinate of plate thickness, T is the plate temperature, t is the time, r is the material density, c is the specific heat, and l is the heat exchange coefficient.
 (4)
(4)
where h is the surface heat exchange coefficient, Td is the surface temperature of plate, and To is the temperature of the quench agent.
While the formation of residual stresses in aluminum plate follows the theories of thermal elasto-plastic mechanics, surface stress σs contains the information of temperature T and surface heat exchange coefficient h(T), which can be expressed as σs=σs(T, h(T), …).
Equation (2) can be changed to a linear function:
 (5)
(5)
The linear regression equation corresponding to Eq.(5) is
 (6)
(6)
where y is the stress of key points of logarithm scale; x1 and x2 are the plate thickness and the surface stress of logarithm scale, respectively; a, b1 and b2 are the evaluating parameters.
4.2 Experiment results
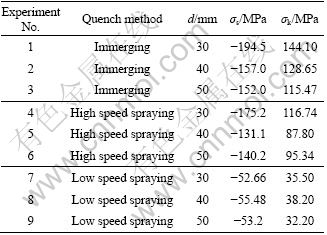
All nine group measurement results of σs (surface stress) and σk (stress value of key points) in the previous experiments are listed in Table 2.
Table 2 Measurement results of σs and σk
4.3 Parameter estimation
A least squares fit was used to evaluate the regression coefficients of the regression model [16], that is
 (7)
(7)
where X is the coefficient matrix of independent input variables in linear regression equation (Eq.(6)) and Y is the measured value of σk.
By making use of data in Table 1, a regression model obtained can be expressed as
 (8)
(8)
Significance of independent input parameters was estimated by variance analysis technology. Therefore, a constructed F-statistic was tested, namely
 (9)
(9)
where bi is the partial regression coefficients of variable xi in regression equation (Eq.(6)); Cii is the diagonal element of matrix (XTX)-1; S2 is the residual variance.
Under given significance level α, if calculated value Fi satisfies Fi>Fα(1, n-m-1), then it can be considered that under significance level α the input parameter xi is significant in the model. The results are listed in Table 3. It can be seen that, under significance level α=0.01, surface stress σs has significant influence on σk, however, even under significance level α=0.1, the influence of plate thickness on σk is not significant.
Thus, the thickness variable d should be removed from the equation, and the best regression equation can be
 (10)
(10)
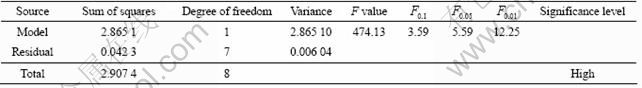
4.4 Significance of regression model
Significance of the regression model was estimated by making use of variance analysis technology. Therefore, a constructed F-statistic was tested, namely
 (11)
(11)
where Qx is the regression sum of squares; Qe is the residual sum of squares; m and (n-m-1) are the degrees of freedom of Qx and Qe, respectively.
Under given significance level α, if the calculated value F satisfies F>Fα(m, n-m-1), then under significance level α the established regression equation is significant. The results in Table 4 show that, under significance level α=0.01, the established regression equation is highly significant.
Table 3 Significance estimation of independent input parameters
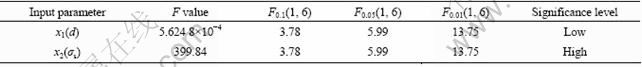
Table 4 Variance analysis of regression model
4.5 Regression precision
Standard residual error S was used to evaluate the precision of the regression equation, and S is defined as
 (12)
(12)
Therefore, the confidence interval of measured value y0 under significance level α=0.01 is
 (13)
(13)
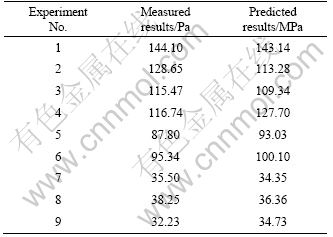
The predicted results and measured results of σk are listed in Table 5.
Table 5 Predicted results and measured results of σk
5 Application of prediction model
5.1 Residual stress distribution reconstruction
Residual stress distribution shape was constructed from the measured stress distributions of quenched aluminum plates. For a quenched plate with unknown stress condition, surface stress can be tested by X-ray diffractometry. Using the regression model, σk can be predicted by surface stress σs, then a proportion coefficient can be determined. By proportional zooming to stress distribution shape function according to the proportion coefficient and shifting the curve by σs, an approximate residual stress distribution of the plate can be obtained as
 (14)
(14)
where Snormalized(z) is the stress distribution shape function, while σps and σpk are the surface stress and the peak value of the tensile stress of the predicted plate, respectively, and σp(z) is the stress distribution of the predicted plate.
5.2 Application
A specimen with dimensions of 200 mm×200 mm× 80 mm was cut from a roller hearth quenched plate with dimensions of 6 000 mm×2 800 mm×80 mm. The initial quenching surface stress is about 200 MPa, using Eq.(10), and the calculated peak value of the tensile stress is about 158 MPa. Comparison of the measured results and predicted results is shown in Fig.3. It can be seen that the two results are in good agreement on the whole, which indicates the good engineering applications of the model.
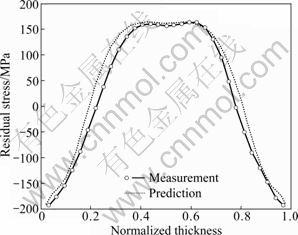
Fig.3 Predicted and measured results of residual stresses in aluminum alloy plate
6 Conclusions
1) The experiments show that the internal stress distributions in aluminum alloy plates with different thicknesses and quenching speeds have similar distribution rules. A stress distribution shape function is proposed based on these rules.
2) Using the nonlinear regression technology, the function between the peak value of the internal tensile stress and the surface stress is established.
3) Based on the surface stress from test and the stress value of key points from the regression model, the internal stress distribution curve in aluminum alloy plate can be reconstructed. The experiments show that the predicted result is in good accordance with measured result.
4) Using this model, only surface stress measurement is required, and the stress condition of a plate can be predicted correctly, conveniently and promptly.
References
[1] MICHAEL B P, MICHAEL R H. Residual stress, stress relief, and inhomogeneity in aluminum plate [J]. Scripta Materialia, 2002, 46(1): 77-82.
[2] MUAMMER K, JOHN C, TAYLAN A. Prediction of residual stresses in quenched aluminium blocks and their reduction through cold working processes [J]. Journal of Materials Processing Technology, 2006, 174(1/2/3): 342-354.
[3] ZHAO Li-li, ZHANG Yi-du. FEM simulation for residual stress in quenched aeronautics aluminium alloy thick-plate based on rolled residual stresses distribution [J]. Journal of Beijing University of Aeronautics and Astronautics, 2006, 32(1): 88-91. (in Chinese)
[4] ZHAO Zu-de, WANG Qiu-cheng, KANG Feng, WANG Jian-guo. Numerical simulation of three-dimensional residual-stress field in 7A04 aluminum cone-shaped part after the quench-cooling process [J]. Journal of Zhejiang University of Technology, 2007, 35(3): 304-307. (in Chinese)
[5] YAO Can-yang. Numerical simulation of quench temperature field and internal stress field of aluminum alloy 7050 thick plate [D]. Changsha: Central South University, 2007. (in Chinese)
[6] KE Ying-ling, DONG Hui-yue. Pre-stretching process and its application in reducing residual stress of quenched 7075 aluminum alloy thick-plates [J]. The Chinese Journal of Nonferrous Metals, 2004, 14(4): 639-645. (in Chinese)
[7] VAIDYNATHAN S, IAIN F. Determination of residual stresses from stress intensity factor measurements [J]. Journal of Basic Engineering, 1971, 93(4): 242-246.
[8] GONG Hai, WU Yun-xin, LIAO Kai. Influence of pre-stretching on residual stress distribution in 7075 aluminum alloy thick-plate [J]. Transactions of Materials and Heat Treatment, 2009, 30(6): 201-205. (in Chinese)
[9] LIAO Kai, WU Yun-xin, GONG Hai, ZHANG Shu-yuan. Application of integral method on residual stress calculation along depth in aluminium alloy thick plate [J]. The Chinese Journal of Nonferrous Metals, 2009, 19(6): 1006-1011. (in Chinese)
[10] WEILI C, IAIN F. Residual stress measurement and the slitting method [M]. New York: Springer, 2006: 70-82.
[11] MICHAEL B P. Experimental procedure for crack compliance measurements of residual stress [EB/OL]. http://www.lanl.gov/ residual/. 2002.
[12] MICHAEL B P. Residual stress measurement by successive extension of a slot: the crack compliance [J]. Applied Mechanics Review, 1999, 52(2): 75-96.
[13] MICHAEL B P, THOMAS G H. Residual stress measurements in a thick, dissimilar aluminium alloy friction stir weld [J]. Acta Materialia, 2006, 54(15): 4013-4021.
[14] MICHAEL B P, MICHAEL H R. Uncertainty analysis, model error, and order selection for series-expanded, residual-stress inverse solutions [J]. Journal of Engineering Materials and Technology, 2006, 128(2): 175-185.
[15] MICHAEL B P, PIERLUIGI P. Uncertainty, model error, and improving the accuracy of residual stress inverse solutions [C]// Proceedings of the 2006 SEM Annual Conference and Exposition on Experimental and Applied Mechanics. Los Alamos: 2006: 176-187.
[16] HE Shao-hua, WEN Zhu-qing, LOU Tao. Experiment design and data processing [M]. Changsha: National University of Defence Technology Press, 2002: 144-185. (in Chinese)
(Edited by YANG Bing)
Foundation item: Projects(2005CB623708, 2010CB731703) supported by the National Basic Research Program of China
Received date: 2010-03-03; Accepted date: 2010-10-27
Corresponding author: WU Yun-xin, Professor, PhD; Tel: +86-731-88877840; E-mail: wuyuanxin@mail.csu.edu.cn

