Trans. Nonferrous Met. Soc. China 29(2019) 194-199
Low-temperature phase transitions of sodium aluminate solutions
Wei LIU, Zhou-lan YIN, Zhi-ying DING
School of Chemistry and Chemical Engineering, Central South University, Changsha 410083, China
Received 31 December 2017; accepted 3 June 2018
Abstract: A series of low-temperature phase transitions of sodium aluminate solutions were studied by differential scanning calorimetry (DSC) and Raman spectroscopy. The results indicate that NaOH concentration is a primary impact factor for the binary eutectic point and ice melting temperature of sodium aluminate solutions with low NaOH concentration. In addition, the phase transition process of sodium aluminate solutions with low NaOH concentration from 123.15 to 283.15 K is divided into four steps: non-crystal to crystal, ternary eutectic reaction, binary eutectic reaction and ice melt. The projection phase diagram of NaOH-Al(OH)3-H2O system at low temperature was plotted, in which the ternary eutectic temperature for sodium aluminate solutions is 183.15 K.
Key words: sodium aluminate solution; low-temperature phase transition; differential scanning calorimetry; Raman spectroscopy; eutectic reaction
1 Introduction
Because of the unique structure and crystallization property of sodium aluminate solution, there are many problems in alumina production, such as slow decomposition rate, tedious production cycle and materials accumulation [1]. The study on its structure is the basis of intensifying the decomposition process. Since the technology of shocking-cooling can solidify its primitive components, it is applied to investigating the structure of sodium aluminate solution. During this process, it will inevitably involve the phase transition of sodium aluminate solution at low temperatures. Therefore, we will focus on it in this paper.
Many technologies are used to measure the low-temperature phase transition, in which thermal analysis (TA), differential scanning calorimetry (DSC) and differential thermal analysis (DTA) are popular [2]. Remarkably, many significant improvements of DSC technique have been established, such as temperature- modulated DSC (TMDSC) [3], stepwise DSC (SW-DSC) [4] and fast-scan DSC [5]. Moreover, BILOND et al [6] used the dynamic mechanical thermal analysis (DMTA) to study the frozen aqueous solutions. OLEAGAL and SALAZAR [7] designed an AC photopyroelectric (PPE) calorimeter which was mounted to work at low temperatures (12-77 K). This high quality measurement system was used to study the transitions of RMnO3 (R=Sm, Tb, Dy).
In general, Raman spectroscopy is used to study the relationship among molecular architecture, non-linear response and hyperpolarizability, which supports the discovery of new, efficient materials for technological applications [8]. Meanwhile, many researchers measured a large number of Raman spectra of different sodium aluminate solutions at room temperature, and used the spectrum data to infer the structure of different Al-containing species [9-13]. With the development of technology, Raman spectroscopy with temperature controlling technique was applied to studying phase transition. BAIER-SAIP et al [14] studied the influence of grain size on the phase transitions of ferroelectric from 77.15 to 873.15 K by micro Raman spectroscopy. It was found that the transition temperatures depended on the grain size and all particles showed hysteresis. ZHANG et al [15] investigated the phase transitions of highly diluted KTNx crystals with temperature by Raman spectroscopy, and discussed the features in the phonon spectrum associated to each phase transition. DURICKOVIC et al [16] studied the water phase tran- sition from 283.15 to 258.15 K by Raman spectroscopy.
It was devoted to the change of OH-stretching band with temperature and efficient identification of the liquid/solid phase transition of water.
In addition, RADNAI et al [17] researched the structures of sodium aluminate solutions in a wide concentration range by the X-ray diffraction, which were little affected by the nonspecific solute-solute interactions. MEGYES et al [18] combined solution X-ray diffraction and simulation to study a series of concentrated solutions of sodium hydroxide, which was the first systematic report about the NaOH solution structure with high concentration. Besides, DESERT et al [19] used X-ray diffraction to study the solution- growth of LiKSO4, which was carried out between 70 and 300 K with special attention to the IV and V phases. SUZUKI et al [20] developed a low-temperature X-ray diffractometer with a dilution refrigerator, which was used to investigate the phase transitions of PrPtBi and Ge0.7La0.3B6. It was found that the phase transition of PrPtBi was antiferro-quadrupole ordering and the phase IV in Ge0.7La0.3B6 was in ferro-quadrupole ordered state. Meanwhile, the X-ray diffraction was also used to study the low-temperature structural phase transition of other substances [21,22].
The technology for studying the low-temperature phase transition of liquid (or solid) has been developed. In this study, low-temperature phase transitions of sodium aluminate solutions with low NaOH concentration were studied by differential scanning calorimetry (DSC) and Raman spectroscopy. Then, the projection phase diagram of NaOH-Al(OH)3-H2O system at low temperature was plotted.
2 Experimental
2.1 Solution preparation
Sodium aluminate solutions were prepared by adding aluminum hydroxide (AR grade, Sinopharm Chemical Reagent Co., Ltd., China) into freshly prepared sodium hydroxide (AR grade, Sinopharm Chemical Reagent Co., Ltd., China) solutions gradually, heated and magnetically stirred in a stainless steel vessel. After dissolution, solutions were firstly filtered through qualitative papers and then through caustic resistant 0.22 ��m membrance filters. 5 wt.% NaOH solution was prepared by dissolving NaOH into water directly. All solutions were prepared using high purity water. In the experiments, the caustic ratio (��k) was calculated as follows:
 (1)
(1)
where cNaOH and  are the concentrations of NaOH and Al(OH)3 in sodium aluminate solutions, respectively, which were determined by chemical titration method.
2.2 Differential scanning calorimetry
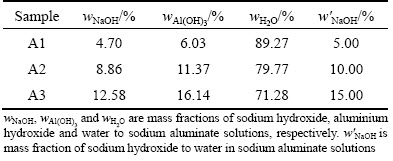
Table 1 shows the compositions of the sodium aluminate solutions of different samples, which were used for DSC tests. The DSC tests were performed using a Diamond DSC (Perkin Elmer, USA) with mechanical intercooler. The sodium aluminate solution (~10 mg) was sealed in platinum pans, initially and rapidly cooled to 223.15 K, kept for 30 min, then heated to 283.15 K at 2 K/min.
Table 1 Chemical compositions of sodium aluminate solutions with ��k=1.52
In addition, the melting characteristics of sodium aluminate solution (��k=3.51, cNaOH=1.61 mol/L) were measured by DSC Q10 (TA Instruments Ltd., USA) with liquid nitrogen refrigeration system. The sodium aluminate solution (~10 mg) was sealed in platinum pan, initially and rapidly cooled to 153.15 K, kept for 5 min, and then heated to 283.15 K at 2 K/min.
2.3 Raman spectroscopy measurement
Raman spectra were recorded on a RGB laser system equipped with CCD detector (Andor Newton) and 1200 g/mm grating (Andor Shamrock) from Germany. The laser wavelength was 532 nm (laser power of 60 mW) with a spot diameter of 2 ��m. The typical accumulation time for each spectrum is 15 s. Frequency calibration of the Raman spectrum was realized using the characteristic 521 cm�C1 line of silicon. All spectra were collected in the range of 200-3700 cm�C1 with a spectral resolution of 1 cm�C1. A Linkam THMS600 heating and freezing stage was used to take measurements from 123.15 to 283.15 K by introducing liquid nitrogen and resistance heating. Before each test, the sample was rapidly cooled to 123.15 K. Each temperature interval lasted for 10 min after collecting the spectrum.
3 Results and discussion
3.1 Phase diagram plotting of NaOH-H2O system
Table 2 shows the freezing points of NaOH solutions from literature [23]. According to the phase rule, the phase diagram of NaOH-H2O system is plotted in Fig. 1, where the high freezing points appear at 40% NaOH and 70% NaOH, which correspond to NaOH��3H2O and NaOH��H2O, respectively. The eutectic temperature of H2O(s)-NaOH��3H2O(s) is 247.15 K, which is the lowest eutectic point in NaOH-H2O system.
Table 2 Freezing points of NaOH solutions


Fig. 1 NaOH-H2O phase diagram
3.2 DSC analysis
Figure 2 shows the DSC profiles of sodium aluminate solutions with different concentrations at the same caustic ratio in the temperature range from 223.15 to 283.15 K. Each DSC melting profile has only one endothermic peak, which is attributed to the ice melt. The phase transition temperatures are at 267.04, 259.38 and 250.22 K, respectively. This is illustrated that the NaOH concentration is a major factor to the ice melting temperature in sodium aluminate solutions with low concentrations.
Figure 3 shows the DSC profile of sodium aluminate solution (��k=3.51, cNaOH=1.61 mol/L) from 153.15 to 283.15 K. It is obvious that the DSC profile also has only one endothermic peak, which is attributed to the ice melt.
It is worth mentioning that the endothermic peak of binary or ternary eutectic reaction was not detected by DSC analysis. It might be that the eutectic reaction did not occur in the given temperature range, or the heat flow of eutectic reaction was little, which is beyond the detection limit of DSC analysis.

Fig. 2 DSC melting profiles of sodium aluminate solutions with ��k=1.52 and different w��NaOH values
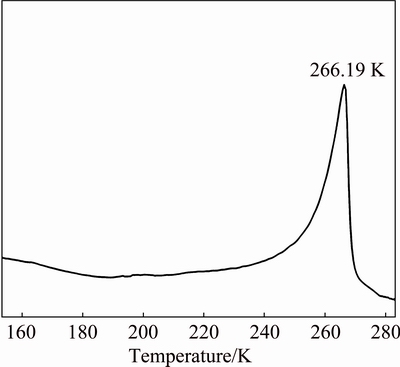
Fig. 3 DSC melting profile of sodium aluminate solution with 1.61 mol/L NaOH and ��k=3.51 in temperature range of 153.15-283.15 K
3.3 Low-temperature Raman spectra of NaOH solution
Figure 4 shows the Raman spectra of 5% NaOH solution in the wavenumber range of 200-3700 cm�C1 from 123.15 to 283.15 K. The bands at 3000-3700 cm�C1 mainly contribute to the OH- and O��H stretching vibrations of water [24]. The vibration strengths of the bands at 3100 and 3220 cm�C1 decrease with the decrease of temperature. In particular, the band at 3220 cm�C1 disappears at 223.15 K.
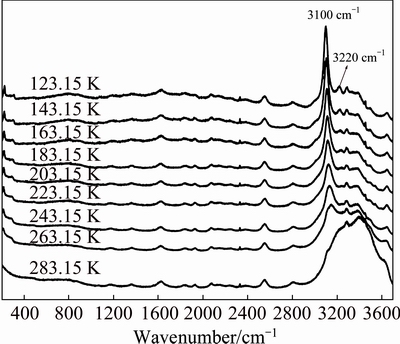
Fig. 4 Raman spectra for 5% NaOH solution in temperature range of 123.15-283.15 K
Moreover, the bands at 3000-3700 cm�C1 obviously change from 243.15 to 283.15 K. In Fig. 1, the binary eutectic reaction temperature for the low concentration of NaOH solution is 247.15 K. This indicates that the eutectic reaction proceeds at 243.15 K in Fig. 4.
It is remarkable that the temperature is rapidly cooled to 123.15 K in the experiments. Thus, it is possible to infer that the decrease of vibration strength of the bands at 3100 and 3220 cm-1 is attributed to the transformation of non-crystal to crystal from 123.15 to 223.15 K. Subsequently, the binary eutectic reaction and ice melt gradually proceed from 243.15 to 283.15 K.
3.4 Low-temperature Raman spectra of sodium aluminate solutions
Figure 5 shows the Raman spectra of sodium aluminate solution (��k=1.48, cNaOH=2.42 mol/L) at temperatures ranging from 123.15 to 283.15 K, where the bands at 3000-3700 cm-1 change regularly. The vibration strengths of the bands at 3100 and 3220 cm-1 decrease with the decrease of temperature. Moreover, the bands at 3220 cm�C1 basically disappear at 183.15 K, which is corresponding to the transformation of non-crystal to crystal. Then, the ternary eutectic reaction begins at 183.15 K. In addition, significant changes are observed in wavenumber range of 3000-3700 cm�C1 from 243.15 to 263.15 K. These changes show similar trends, which indicates that the same phase transition has been occurred. In Fig. 4 and the binary eutectic temperature is 247.15 K, and the binary eutectic reaction occurs at 223.15-263.15 K.
Figure 6 shows the Raman spectra of sodium aluminate solution with high concentration (wNaOH<40%) in the wavenumber range of 200-3700 cm�C1 from 123.15 to 283.15 K. It is found that the vibration strength of the band at 3200 cm�C1 decreases from 123.15 to 183.15 K. As the frozen sodium aluminate solution melts completely at 203.15 K, the bands at 3000-3700 cm-1 from 203.15 to 283.15 K are basically unchanged.
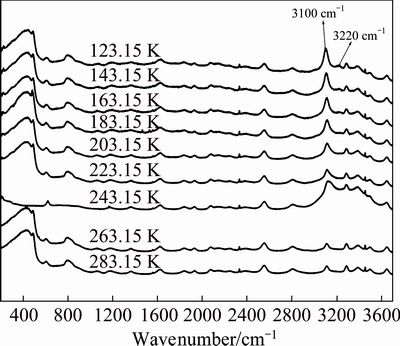
Fig. 5 Raman spectra for sodium aluminate solution with 2.42 mol/L NaOH and ��k=1.48 in temperature range of 123.15-283.15 K
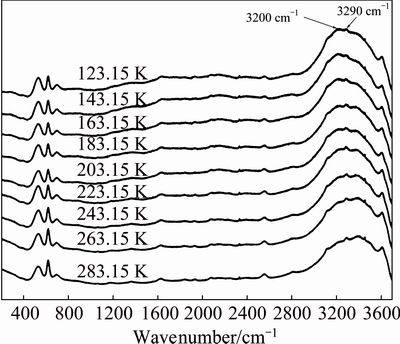
Fig. 6 Raman spectra for sodium aluminate solutions with 11.29 mol/L NaOH and ��k=1.48 in temperature range of 123.15-283.15 K
In Figs. 5 and 6, the bands at 3000-3700 cm�C1 mainly contribute to the stretching vibrations of OH-, O��H of water and  [24,25]. Our future studies will investigate the stretching vibrations of other Al-containing species.
3.5 Phase diagram plotting of NaOH-Al(OH)3-H2O system
For the supersaturated sodium aluminate solutions, it is extremely difficult to plot the comprehensive low-temperature phase diagram of NaOH-Al(OH)3-H2O system as the accurate phase transition is difficult to measure with current technologies. Therefore, a pre- liminary projection phase diagram of NaOH- Al(OH)3-H2O system is plotted in Fig. 7 according to the compositions of sodium aluminate solutions and their phase transition temperatures. The phase transition process of sodium aluminate solutions can be divided into three steps: ternary eutectic reaction, binary eutectic reaction and ice melt. The ternary eutectic reaction proceeds at 183.15 K. In addition, the binary eutectic reaction begins when the temperature decreases, and then the binary eutectic points for different concentrations of sodium aluminate solutions would form a line. The temperatures of ice melting isotherms for sodium aluminate solutions with low concentrations of 5%, 10% and 15% are about 267.15, 260.15 and 250.15 K, respectively, which decrease with the increase of NaOH concentration. In this experiment, it is noted that the NaOH concentration (<40%) and ��k (>1) of sodium aluminate solutions are limited as the low temperature is hard to achieve. Meanwhile, the transformation of non-crystal to crystal cannot be plotted in Fig. 7.

Fig. 7 NaOH-Al(OH)3-H2O projection phase diagram at low temperatures
4 Conclusions
(1) The DSC and Raman spectroscopy were used to investigate the phase transitions of sodium aluminate solutions at low temperatures. The results indicate that NaOH concentration is a major factor for the ice melting temperature and binary eutectic point in sodium aluminate solutions with low NaOH concentration.
(2) The ternary eutectic point of sodium aluminate solutions is 183.15 K. Therefore, the phase transition process for sodium aluminate solutions with low NaOH concentration from 123.15 to 283.15 K could be divided into four steps: non-crystal to crystal, ternary eutectic reaction, binary eutectic reaction and ice melt. Notably, a preliminary phase diagram of NaOH-Al(OH)3-H2O system at low temperatures was plotted.
References
[1] LI Wang-xing. Theory and technics of alumina production [M]. Changsha: Central South University Press, 2010: 90-94. (in Chinese)
[2] del BARRIO E P, CADORET R, DARANLOT J, ACHCHAP F. Infrared thermography method for fast estimation of phase diagrams [J]. Thermochimica Acta, 2016, 625: 9-19.
[3] MESQUIDA P, LE COUTRE A, KRUGER J K. Temperature modulated DSC at intermediate-low temperatures [J]. Thermo- chimica Acta, 1990, 330: 137-144.
[4] LIESEBACH J, LIM M, RADES T. Determination of unfrozen matrix concentrations at low temperatures using stepwise DSC [J]. Thermochimica Acta, 2004, 411: 43-51.
[5] CHEN Y X, CHEN X, ZHOU D S, SHEN Q D, HU W B. Low-temperature crystallization of P(VDF-TrFE-CFE) studied by Flash DSC [J]. Polymer, 2016, 84: 319-327.
[6] BILOND G, IVAVOVA K, SIMATOS D. Reliability of dynamic mechanical thermal analyses (DMTA) for the study of frozen aqueous systems [J]. Journal of Rheology, 1994, 38(6): 1693-1703.
[7] OLEAGAl A, SALAZAR A. Phase transitions at low temperature (<77 K) by means of photopyroelectric calorimetry [J]. International Journal of Thermophysics, 2012, 33(10-11): 2159-2166.
[8] SUDHARSANA N, SHARMA A, KUS N, FAUSTO R, RAMOSU LUISA M, KRISHNAKUNAR V, PAL R, ROW T N G, NAGALAKSHMI R. Low temperature FTIR, Raman, NMR spectroscopic and theoretical study of hydroxyethylammonium picrate [J]. Journal of Molecular Structure, 2016, 1104: 40-51.
[9] SIPOS P, HEFTER G, MAY P M. 27Al NMR and Raman spectroscopic studies of alkaline aluminate solutions with extremely high caustic content�CDoes the octahedral species Al(OH)63- exist in solution? [J]. Talanta, 2006, 70(4): 761-765.
[10] SIPOS P, MAY P M, HEFTER G. Quantitative determination of an aluminate dimer in concentrated alkaline aluminate solutions by Raman spectroscopy [J]. Dalton Transactions, 2006(2): 368-375.
[11] WATLING H R, SIPOS P M, BYRNE L, HEFTER G T, MAY P M. Raman, IR, and 27Al-MAS-NMR spectroscopic studies of sodium (hydroxy)aluminates [J]. Applied Spectroscopy, 1999, 53(4): 415-422.
[12] SIPOS P. The structure of Al(��) in strongly alkaline aluminate solutions��A review [J]. Journal of Molecular Liquids, 2009, 46(1): 1-14.
[13] WATLING H. Spectroscopy of concentrated sodium aluminate solutions [J]. Applied Spectroscopy, 1998, 52(2): 250-258.
[14] BAIER-SAIP J A, RAMOS-MOOR E, CABRERA A L. Raman study of phase transitions in KNbO3 [J]. Solid State Communications, 2005, 135(6): 367-372.
[15] ZHANG N N, WEI R S, WANG J Y, HU X B, ZHANG H J, SANTOS C C, GUEDES I. Phase transitions investigation by Raman spectroscopy in highly diluted KTN crystals [J]. Journal of Alloys and Compounds, 2012, 531: 14-17.
[16] DURICKOVIC I, CLAVERIE R, BOURSON P, MARCHETTI M, CHASSOTH J M, FONTANA M D. Water-ice phase transition probed by Raman spectroscopy [J]. Journal of Raman Spectroscopy, 2011, 42(6): 1408-1412.
[17] RADNAI T, MAY P M, HEFTER G T, SIPOS P. Structure of aqueous sodium aluminate solutions: A solution X-ray diffraction study [J] Journal of Physical Chemistry A, 1998, 102: 7841-7850.
[18] MEGYES T, BALINT S, GROSZ T, RADNAI T, BAKO I, SIPOS P. The structure of aqueous sodium hydroxide solutions: A combined solution X-ray diffraction and simulation study [J]. Journal of Chemical Physics, 2008, 128(4): 044501.
[19] DESERT A, GIBAUD A, RIGHIT A, LEITAO U A, MOREIRA R L. An X-ray scattering study of the low-temperature phase transitions of LiKSO4 [J]. Journal of Physics: Condensed Matter, 1995, 7(44): 8445-8452.
[20] SUZUKI H, XUE Y, NAHERA S, YAMAUCHIA R, ASADAA S, MIZUNOA M, ABEA S, KUNIIB S, KASAYAB M. Phase transitions studied by ultra-low-temperature X-ray diffraction [J]. Physica B, 2004, 345(1-4): 239-242.
[21] KOPPELHUBER-BITSEHNAU B, MAUTNER F A, YVON K. Low-temperature structural phase transition in SrMo6S8 studied by X-ray powder diffraction [J]. Monatshefte fur Chemie, 1990, 121(6-7): 501-509.
[22] KLAPPER H, JENNISSEN H D, SCHERF C, HAHN T. X-ray topographic and polarisation-optical study of the low-temperature phase transitions and domain structures of KLiSO4 [J]. Ferroelectrics, 2008, 376(1): 25-45.
[23] LIU Guang-qi, MA Lian-xiang, LIU Jie. Chemistry and chemical engineering property datasheet [M]. Beijing: Chemical Industry Press, 2002: 294-295. (in Chinese)
[24] SCHOONOVER J R, ZHANG S L L, JOHNSTON C T. Raman spectroscopy and multivariate curve resolution of concentrated Al2O3-Na2O-H2O solutions [J]. Journal of Raman Spectroscopy, 2003, 34(6): 404-412.
[25] QIU Guo-fang, CHEN Nian-yi, YAN Li-chen, LI Yu. Spectroscopic study on highly concentrated sodium aluminate solutions [J]. The Chinese Journal of Nonferrous Metals, 1996, 6(1): 53-56. (in Chinese).
��������Һ�ĵ��������Ϊ
�� ΰ��������������Ӣ
���ϴ�ѧ ��ѧ����ѧԺ����ɳ 410083
ժ Ҫ�����ò�ʾɨ�����ȷ���(DSC)�������������о���������Һ�ĵ��������Ϊ����������������ڵ����£���Ũ����������Һ��NaOHŨ����Ӱ����Һ��Ԫ������ͱ��ڻ��¶ȵĹؼ����ء����¶ȴ�123.15���ߵ�283.13 Kʱ����Ũ����������Һ�������̿ɷ�Ϊ4���Σ��Ǿ���ת��Ϊ���塢��Ԫ������Ӧ����Ԫ������Ӧ�ͱ����ڻ�����������Һ����Ԫ�����¶�Ϊ183.15 K�������Ƴ�������NaOH-Al(OH)3-H2O��ϵ����ԪͶӰ��ͼ��
�ؼ��ʣ���������Һ��������䣻��ʾɨ�����ȷ����������ף�������Ӧ
(Edited by Wei-ping CHEN)
Foundation item: Project (51374251) supported by the National Natural Science Foundation of China
Corresponding author: Zhi-ying DING; Tel: +86-13549681042; E-mail: zy.ding@csu.edu.cn
DOI: 10.1016/S1003-6326(18)64928-3

