A new product family mining method based on PLM database
��Դ�ڿ������ϴ�ѧѧ��(Ӣ�İ�)2017���11��
�������ߣ��� ������ ����ƽ �� ��Ժ�� ����
����ҳ�룺2513 - 2523
Key words��product family; product life-cycle management database; multi-space product data; data mining
Abstract: Product family (PF) is the most important part of product platform. A new method is proposed to mine PF based on multi-space product data in PLM database. Product structure tree (PST) and bill of material (BOM) are used as the data source. A PF can be obtained by mining physics space, logic space and attribute space of product data. In this work, firstly, a PLM database is described, consisting of data organization form, data structure, and data characteristics. Then the PF mining method introduces the sequence alignment techniques used in bio-informatics, which mainly includes data pre-processing, regularization, mining algorithm and cluster analysis. Finally, the feasibility and effectiveness of the proposed method are verified by a case study of high and middle pressure valve, demonstrating a feasible method to obtain PF from PLM database.
Cite this article as: HU Xiang-yang, PENG Wei-ping, LEI Jin, DOU Jun-hao, ZHONG Yuan-hua, JIANG Rui. A new product family mining method based on PLM database [J]. Journal of Central South University, 2017, 24(11): 2513�C2523. DOI:https://doi.org/10.1007/s11771-017-3664-9.
J. Cent. South Univ. (2017) 24: 2513-2523
DOI: https://doi.org/10.1007/s11771-017-3664-9

HU Xiang-yang(������), PENG Wei-ping(����ƽ), LEI Jin(��),
DOU Jun-hao(��), ZHONG Yuan-hua(��Ժ��), JIANG Rui(����)
School of Power and Mechanical Engineering, Wuhan University, Wuhan 430072, China
 Central South University Press and Springer-Verlag GmbH Germany, part of Springer Nature 2017
Abstract: Product family (PF) is the most important part of product platform. A new method is proposed to mine PF based on multi-space product data in PLM database. Product structure tree (PST) and bill of material (BOM) are used as the data source. A PF can be obtained by mining physics space, logic space and attribute space of product data. In this work, firstly, a PLM database is described, consisting of data organization form, data structure, and data characteristics. Then the PF mining method introduces the sequence alignment techniques used in bio-informatics, which mainly includes data pre-processing, regularization, mining algorithm and cluster analysis. Finally, the feasibility and effectiveness of the proposed method are verified by a case study of high and middle pressure valve, demonstrating a feasible method to obtain PF from PLM database.
Key words: product family; product life-cycle management database; multi-space product data; data mining
1 Introduction
With the application of product life-cycle management (PLM), the product data of an enterprise are rapidly growing. These product data exist in PLM database, containing a large amount of product process knowledge and advanced management ideas [1]. How to scientifically manage these product data is the key to reduce the enterprise spending. Under the mass customization (MC) environment, to satisfy diversity demands needs to constantly increase the varieties of serial products [2]. The material of bill (BOM) may be very similar for these serial products because of a large number of identical parts. With the increasing of serial products, the BOM will be more and more redundancy. The management of variety product data will seem to be much more cumbersome and inefficient. The standardized products are difficult to satisfy the personalized demands of customers. Customers need truly personalized products, and put forward higher requirements for product design. Tiihonen et al [3], Sundgren [4], Hernandez et al [5] have proposed a PF model to describe large amount of product variety with a limited amount of data. PF is a flexible and standardized model which shares general technologies and components [6, 7]. How to mine the PF from the existing product data and design experience is the important foundation to support the construction of product platform.
In recent years, PF has been becoming a research hotspot in academia and industry, which mainly focuses on two aspects: PF design and PF partition. PF design includes modular design and parametric design. Modular design is to make products functional decomposition and to obtain a series of sub-modules. Then different products can be obtained through different combinations of sub-modules. Parametric design includes how to divide the public parameters and adjustable parameters, and how to select the parameters. Tseng et al [8] proposed a modular design method based on product intrinsic or extrinsic similarity, which classified the products of high similarity as the same family. Jiao et al [9] used the hierarchical tree structure to manage the modules generated from the design of PF. LI et al [10] proposed a PF design method based on fuzzy clustering, which includes the re-planning and the scheme evaluation. Dai and SCOTT [11] proposed a PF design method based on variable parameter values. The range of variable parameters was evaluated and the PF was planned by clustering algorithm. Nayak et al [12] proposed a PF development method based on the variance, and solved parametric planning issues with the CDSP. Kumar et al [13, 14] proposed a parametric PF planning method based on customer requirements, and used the ant colony algorithm to optimize the PF. However, many enterprises have not made a global planning for the PF model at present. When the enterprise has been developed to a certain scale, they begin to plan PF that suits the products�� characteristics and production patterns to meet MC. Therefore, some scholars have carried out some related researches on PF mining. Lan et al [15] proposed axiomatic design [16], comparing the degree of similarity on functional requirements and design parameters to divide PF. LI et al [17] constituted a similarity indexes matrix measuring similarity among products. Similarity indexes include structure similarity, versatility similarity, re-usability similarity, etc. They applied improved hierarchical clustering algorithm to dispose similar matrix to obtain PF partition.
In summary, these methods on obtaining PF mainly plan PF from the product source. There are few practices of mining PF from the existing PLM database. PF mining is a complex multi-criteria decision-making problem. Scholars have mainly adopted descriptive methods, mathematical programming methods and artificial intelligence methods to research PF mining. These methods are based on structure related and function related partition criteria. These methods take the similarity, versatility and re-usability of parts among products as the criteria [18]. Since the products contain many parts, and their structures have hierarchy relationships. Therefore, it is difficult to accurately obtain results of PF mining only by structure related and function related. Moreover, these methods have a great advantage for a small amount of data processing, while its computation is amazing for product data in PLM database [19, 20].
In consideration of the limitations of the above methods, a new PF mining method is proposed based on multi-space product data in PLM database. The multi-space product data refer to storage relationship, logic structure and function information of a product. Moreover, using the sequence alignment techniques which are mainly applied in bio-informatics [21] for reference, the method includes a mining algorithm and the cluster analysis. The mining algorithm is based on product main characteristic sequences alignment. Finally, the PF can be obtained by setting the threshold in cluster analysis. The PF mining improves the efficiency of product data management and lays the foundation for building product platforms [22].
2 Structure of multi-space product data in PLM
Data in PLM database might be a simple string, and it can also be complicated tree structure, 2D table, geometric model diagram, product documentation, program files, multimedia files, etc. PLM database generally adopts hierarchical tree structure to manage product attributes, geometric models, process documentations, configuration tables and workflows. Tree structure can clearly describe the structure of the hierarchy and the relation between component and part, which can effectively manage all product-related information.
According to the existing forms in the PLM database, product data can be divided into three kinds of space data in this work, namely physics space, logic space and attribute space. The physics space refers to storage of all product-related information and their connection relationships. The logic space consists of nodes (parts) and their connection relationships. The definition and description of node (part) compose the attribute space. The relationships of the three kinds of space data are shown in Fig. 1.
Physics space can be expressed by the metadata. The metadata is a kind of describing data, which mainly includes storage location, resource retrieval and file record. Logic space refers to the logical relationship between component and part of product. For example, the BOM stores some specific product-related information, such as product composition, parent nodes and other information. The BOM is the table-structured form of the PST. Attribute space is attribute information of products and parts, including structure attributes, function attributes, process attributes, management attributes, etc. Physics space stores the identification (ID) of the other two space data. All relevant data can be searched through its ID.
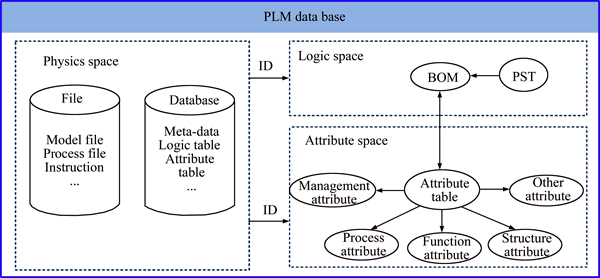
Fig. 1 Relationships of multi-space product data in PLM
Structured data in the form of table are usually stored in the PLM database, while unstructured data in the form of files are stored in the file system. The five tables in PLM database are built to achieve the storage of structured data: node table, product attribute table, documentation table, engineering drawing record table and BOM. The relationships of the five tables are shown in Fig. 2.
The node table and the product attribute table are connected by node ID, and the information of the corresponding node can be viewed in the attribute table. The product attribute table is connected with the document record table and engineering drawing by document coding and engineering drawing coding, respectively. The BOM table is used to configure a specific module by referencing related components in the node table, which inherits the attributes of parts. Documents and drawings can be found on the corresponding file server using document address and engineering drawing address.
3 PF mining method
A PF mining method is proposed based on the characteristics of the multi-space product data in PLM database, which mainly includes four steps. Firstly, the method completes a preliminary selection according to the locations where product data are stored in PLM. Secondly, the data pre-processing methods are used to ensure the accuracy and the filtered data are regularized to meet the requirements of computer��s operation. Thirdly, the alignment algorithm is designed to complete the PF mining. Finally, threshold valve is set to carry out the cluster analysis. The procedure is shown in Fig. 3.
3.1 Pre-processing
Product data in PLM have some defects like complex relationship, fuzzy expression, redundant data, and so on. Therefore, data pre-processing is very necessary for mining PF. The pre-processing mainly includes data normative processing and structural logic inspection.
3.1.1 Data normative processing
Data normative processing embraces product coding consistency processing, ambiguity processing and attribute data normalization.
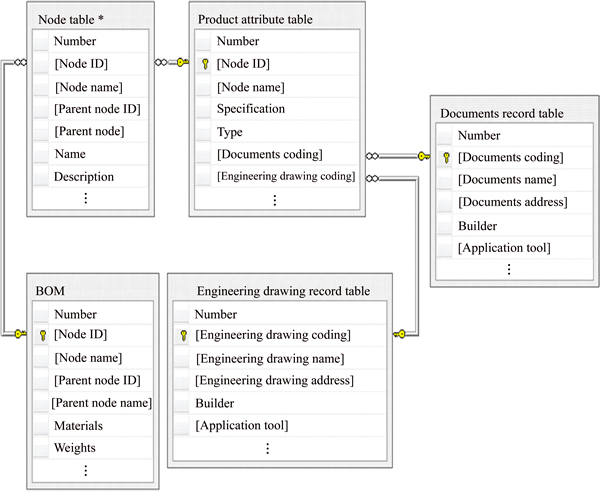
Fig. 2 Relationships among data tables in PLM database
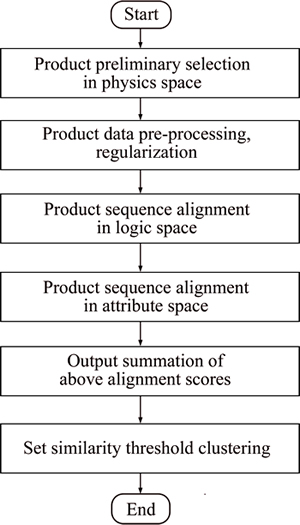
Fig. 3 Procedure of PF mining method
1) Coding consistency processing
Coding needs to comply with these principles such as uniqueness, integrity, simplicity, tractability and inheritance [23]. In the PLM database, each data object has its own code and the corresponding code rules. However, due to the difference of designers or departments, the coding rules may be inconsistent. For the convenience of mining PF, coding rules in data dictionary are adopted. Parts and components are sorted according to different function modules, such as in order of supporting and connection module, driver module, transmission module, execution module, etc. Parts inside the module are ranked in accordance with their importance.
2) Ambiguity processing
Ambiguity means that the product is lack of standardization for its name. The main task is to check out these ambiguous products. An improved near sorting algorithm is used to detect ambiguous objects, which consists of the following steps.
Step 1: Select the product objects to be detected in PLM database. An object is a record, including product name, structure, function, process and other attributes.
Step 2: Select key fields to sort. For example, key fields are the structure, function, process and other main attributes.
Step 3: Sort. Sorting key fields are chosen to conduct multiple times sort to the entire data set. The ambiguous records should be as close as possible in physics location.
Step 4: Compare the ambiguous products with the data dictionary and correct them.
The ambiguity detection method is shown in Fig. 4. A fixed window is chosen and slid in the data set. The first record in the window compares all the rest records one by one. In the similarity calculation process, calculate the similarity of each field and then re-calculate the similarity between the two records according to the weight of all fields. If the similarity value of two records is greater than a given threshold, it will be considered that the two records described the same object product, namely there exists ambiguity. The threshold is generally set based on experience. The detection is finished until the window sliding to the end of the data set.
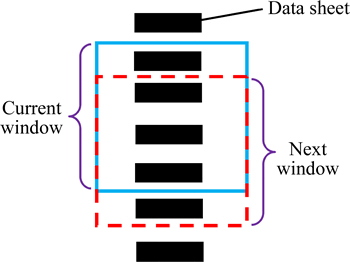
Fig. 4 Record detection window
3) Attribute data normalization
Statistical analysis method. The Chebyshev��s theorem is adopted to calculate the expectancy of attribute values and the range of standard deviation values. Then value interval of each attribute is examined to judge whether the attribute is abnormal or wrong.
Binning. Attribute values are distributed to a series of equal height or width ��box��. Then the averages of elements are calculated in the box and the missing or anomalous attribute value is replaced with the average.
Employing industry standards or constraints in attribute values analysis, such as value of attribute 1 is twice the value of the attribute 2. If the result of actual test does not satisfy the constraint rules, the value of the attribute is problematic.
3.1.2 Structural logic inspection
Structural logic inspection mainly includes structural integrity inspection and correlation correctness inspection. Structural integrity inspection is to search every component and part of a product to judge whether the structure is complete. Correlation correctness inspection is to check the correctness of the relationship between parts and components of product on the logical connection.
The product P is taken as an example to concretely illustrate the structural logic inspection.
Structural integrity inspection is to check the integrity of product composition. If all parts and components can be searched, which shows that the structure of the product is complete, otherwise is not.
The correlation correctness inspection is to check the correlation between the parts and components of the product P. For example, if the parent node of part 3-1, part 3-2, and part 3-3 is the component 1, Fig. 5 will show that the connection is not correct. It needs to be corrected. When all the correlations of product P are in accord with Fig. 5, it is proved that the logic connection relationship is correct.
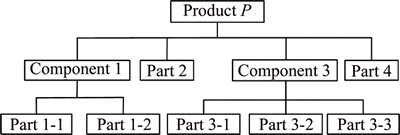
Fig. 5 Structure tree of product P
3.2 Regularization
Regularization processing is to express a complex data structure with a simple string. It also has some advantages like flexible expression, accurate expression and clear correlation. For convenience of sequence alignment, it is necessary to transform the PST into a suitable data format, which can avoid the direct comparison of complicated space structure data. In this work, regularization for the multi-space product data mainly aims at the product logic space and the product attribute space. Product physics space does not need to be regularized, which can be achieved by invoking general SQL inquiry statements in this work.
1) Regularization of product logic space
The product P is taken as an example to illustrate the regularization processing in product logic space. The main structure of the product P is shown in Fig. 5. The regularization of product logic space includes the following two steps.
Step 1: Breadth-first traversing in accordance with hierarchy relationship. The order is component 1, part 2, component 3, part 4, part 1-1, part 1-2, part 3-1, part 3-2 and part 3-3.
Step 2: Consistency processing. During sequence alignment, if the sequence contains complex characters, it will not be suitable to be processed by computer language. Therefore, consistency processing is necessary. For example, a represents component 1; b represents part 1-1; c represents part 1-2; d represents part 2; e represents component 3; f represents part 3-1; g represents part 3-2; h represents part 3-3; i represents part 4. The parts and components are ranked according to the supporting connection module, driver module, transmission module, execution module and other modules. Finally, the regularized product P can be expressed as the sequence (a, d, e, i, b, c, f, g, h).
2) Regularization of product attribute space
Product attribute space includes function information, process information, structure information, management information, etc. Function attribute is firstly chosen to mine PF. Function attributes of products, parts and components are stored in the attribute table. If a part has a certain function (i.e., connection and supporting, driving or transmission), it will be marked as number 1 in the sequence alignment, otherwise 0. Finally, these numbers are ranked according to the sequence order in the logic space.
3.3 Mining algorithm
The PF mining can further integrate product resources. In the process of PF mining, a large number of products will be divided into limited product families and these products in a PF should be as similar as possible. The main characteristic sequence alignment is used in similarity analysis during PF mining. This method quotes the dynamic programming algorithm of bio-informatics sequence alignment [24] to carry out the product sequence alignment. Since similar parts may not be expressed with a single character. For example, a difference in structure of the valve body, it is required to use a fixed character representation of the valve body and use a variable to show structural differences. Therefore, the improved dynamic programming algorithm can be used in alignment for a number of characters. The process of the algorithm is as follows.
1) Preliminary selection in physics space
The metadata is used to achieve four aspects work: searching, cataloging, administration and archiving. Metadata query includes query by full text, query by name of data set, query by abstract of data set and query by keyword. Through the metadata table and the relationships among the five tables in Fig. 2, it is easy to find all relevant information. Products of the same or similar function will be retained and unrelated products will be removed by calling SQL query statement.
The preliminary selection in physics space can reduce calculation capacity and improve efficiency for PF mining.
2) Sequence alignment in logic space
After the regularization in Section 3.2, the parts and components of the products are represented with characters. For example, the two main characteristic sequences of the product in logic space are A=(a1, a2, ��, am) and B=(b1, b2, ��, bn), which are listed in a 2D table as shown in Table 1.
The iterative method is adopted to calculate the similarity scores of the two sequences. The similarity scores, Mi,j, are stored in a matrix. The calculation method is as follows:
Table 1 A 2D table of main characteristic sequences
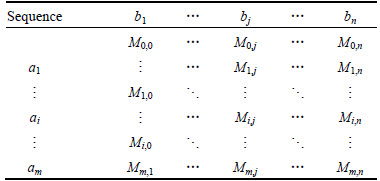
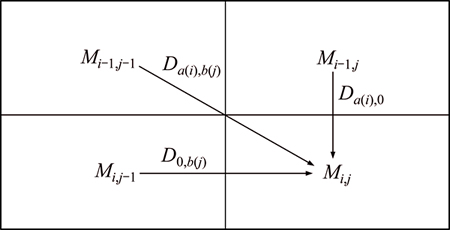
Fig. 6 Calculation method of Mi,j
The Mi,j is calculated and at the same time, a pointer is used to record the path of the highest score. The score is calculated in the following three cases.

 (1)
(1)
where i represents the length of the sequence A, and  j represents the length of the sequence B, and
 Mi,j represents the current element; Mi,j�C1 represents the element which is adjacent to Mi,j�C1 in the horizontal direction; Mi�C1,j represents the element which is adjacent to Mi,j�C1 in the vertical direction. Da(i),b(j) represents the score value between the ith element of the sequence A and the jth element and of sequence B; Da(i),0 represents the score value between the ith element of the sequence A and vacancy; D0,b(j) represents the score value between vacancy and the jth element of the sequence B. The fixed vacancy penalty
model is prescribed in this work: 


3) Sequence alignment in attribute space
A same function can be realized by different structure modules, for example, the driver mode has manual and electric type. So the sequence alignment in logic space cannot fully determine whether the result of the mining is reasonable. In this regard, the functions of parts and components are selected to compare to further confirm the accuracy of PF mining. Functions of parts and components constitute the sequence according to the order of product sequence in logic space. The score is recorded as 1 for the same function. Otherwise is recorded as 0.
4) Algorithm design
The main characteristic sequences of N products in logic space and attribute space are inputted into the program, respectively. The algorithm procedure is shown in Fig. 7. The flow chart of the PF mining algorithm is shown in Fig. 8.
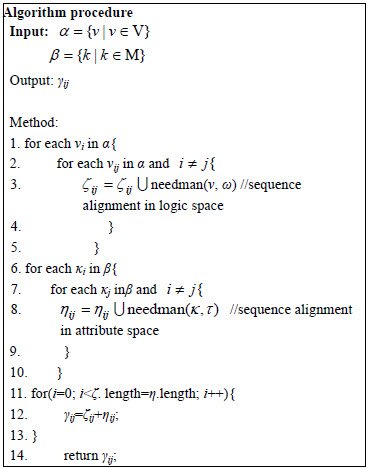
Fig. 7 Pseudo code of algorithm procedure
3.4 Cluster analysis
The scores outputted from the algorithm still cannot be directly used for clustering analysis. They need to be normalized, and the details are shown as follows:
 (2)
(2)
 (3)
(3)
 (4)
(4)
Similarity=1�CD (5)
where Max(Si,j) is the maximum value and Min(Si,j) is the minimum value.
Finally, the dynamic clustering chart is plotted by clustering process, and the PF can be obtained by setting the similarity threshold. Different similarity thresholds will lead to different cluster results. The optimal results can be obtained according to the actual production requirements, which can be used to establish the PF and the configurable model, showing a certain practicality and effectiveness.
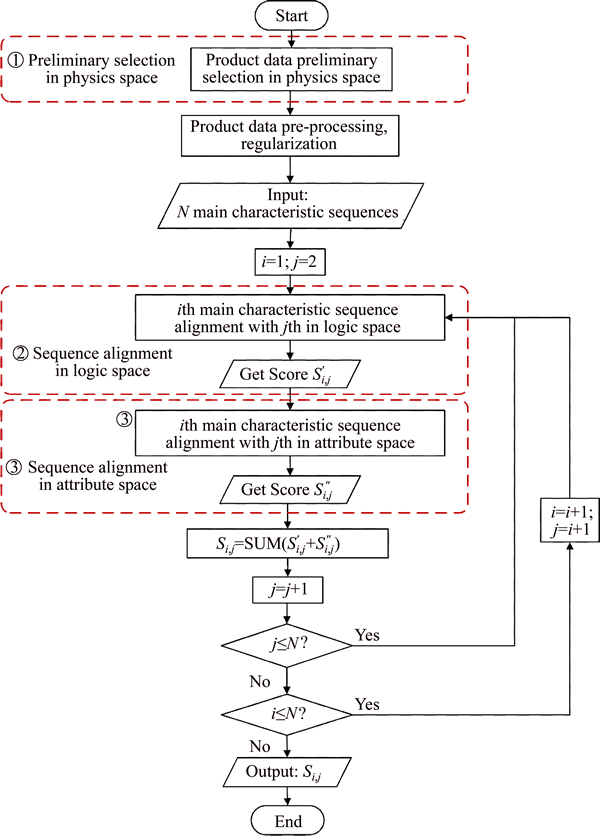
Fig. 8 Flow chart of PF mining algorithm
The MC is gradually evolved from the cutting edge of technology to an inevitable trend [25]. A new method of PF mining is proposed, which is based on PLM database. Products are divided into different product families using this method. All the product variants of the PF will be generated through parametric configuration. The cost of customized products will be reduced and the delivery time will be shortened. The method can improve the management efficiency and design efficiency. The mining results provide a basis for the development and design of product platform.
4 Case study
The valve of a certain high and middle pressure valve factory is taken as an example in this work to verify the proposed method. This method is suitable for general product. The general cutoff valve is considered as the source data.
1) Data preparation
Preliminary selection is applied in physics space. The cutoff valve is separated from the valve database by different memory addresses, including cutoff valve, check valve, diaphragm valve,regulating valve, safety valve and reducing valve. The structure of the valve database is shown in Fig. 9.
As a result, the related cutoff valves will be extracted by preliminary selection in physics space. The engineering drawings of relevant valves can be obtained through the corresponding addresses, which can be used to directly verify whether the PF mining is correct or not. The structure schematic diagrams of some representative valves are shown in Figs. 10 and 11, which includes the valves 1�C4.
Figure 10 shows the internal components of the valve 1. The schematic diagrams of the valves 2�C4 are shown in Fig. 11.
According to the proposed method in Section 3.1,relevant product data of cutoff valve are extracted from valve database. Then, the codes of data objects (i.e., products, parts, documents, 2D/3D models, etc.) are compared with the codes in data dictionary. If the code of a same object is inconsistent, it will be corrected according to the coding standard of data dictionary. These ambiguity objects are detected using the improved near sorting algorithm and corrected according to the data dictionary. Moreover, these methods (statistical analysis method, binning and the constraint relationship among attributes) are used to process the missed or wrong product data. The unknown classes of valves are ranked in order of supporting and connection module, driver module, transmission module, open/close module and sealing module as shown in Table 2.
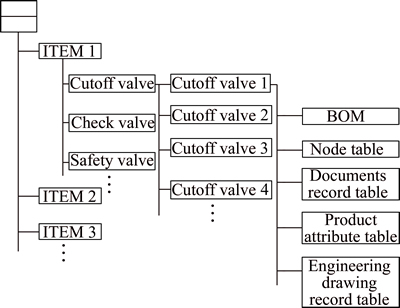
Fig. 9 Structure of valve database
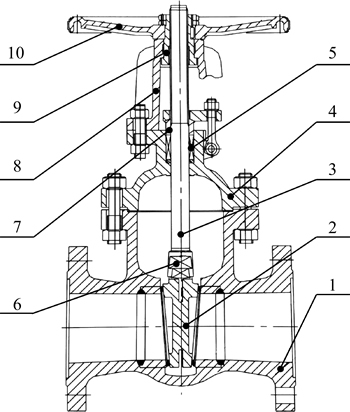
Fig. 10 Structure schematic diagram of valve (1�CValve body; 2�CDisc; 3�CStem; 4�CBonnet; 5�CSeal ring; 6�CSeat ring; 7�CStuffing box; 8�CBracket; 9�CStem nut; 10�CHand wheel)
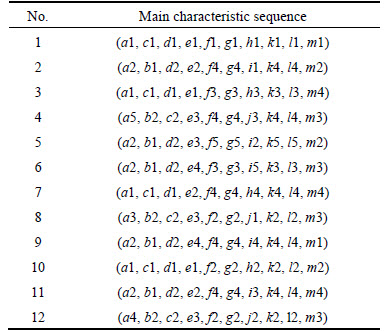
Regularization is applied using the proposed method in Section 3.2. Components and parts of products are replaced with characters or numbers. And their functions are replaced with the numbers 0 or 1. The regularized valve sequences in logic space are shown as follows.
Each row represents main characteristic sequence of a product in logic space in Table 3. The combination of character and number represents a specific component or part. For example, a1 represents the valve body 1.
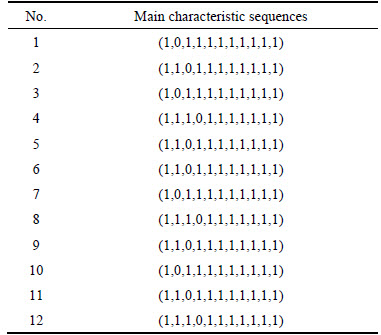
In the same way, their functions of cutoff valve are replaced with numbers. It is easy to obtain the sequences in attribute space as shown in Table 4.
Each row represents a product main characteristic sequence in attribute space, which is ranked according to the order of the parts in Table 2. The number 1 represents the function of a certain part, and the number 0 represents that a certain part missing or does not have the function.
2) Results of the cluster analysis
The regularized main characteristic sequences of the twelve valve products in logic space and attribute space are inputted to the algorithm, respectively. Then the algorithm executes the two sequence alignment of product and calculates sums of comparison scores in logic space and attribute space. Finally, scores are outputted, which are shown in Table 5.
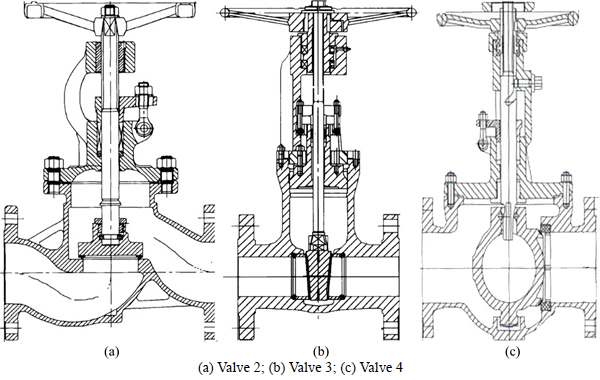
Fig. 11 Structure schematic diagrams of valves:
Table 2 Valve data
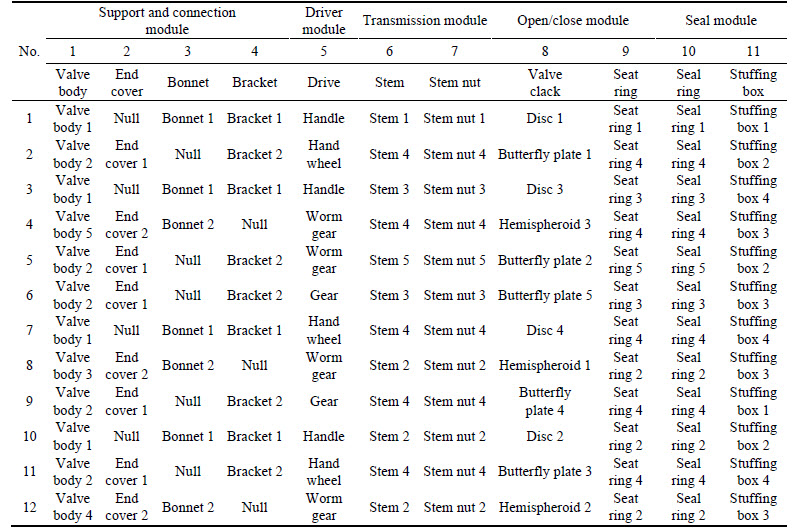
Table 3 Main characteristic sequences in logic space
The scores of the different valves are generally different. Table 5 shows that the differences are obvious in the aspects of structure and function among the cutoff valves. For example, the score between the valve 2 and the valve 11 is the highest score of 16 points while the score between the valve 2 and the valve 8 is �C4 points.
Table 4 Main characteristic sequences in attribute space
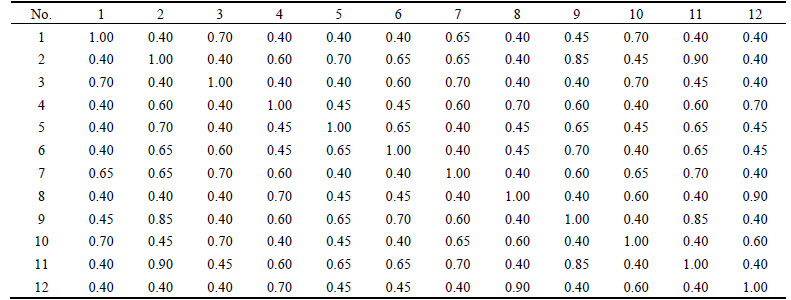
The scores in Table 5 need to be normalized according to Eqs. (2)�C(5). In this case, the maximum value is 20, that is, the sequence alignment of the product itself. The minimum value is �C20, that is, the minimum value according to the fixed vacancy penalty model. The results are shown in Table 6.
Table 5 Scores of sequence alignment
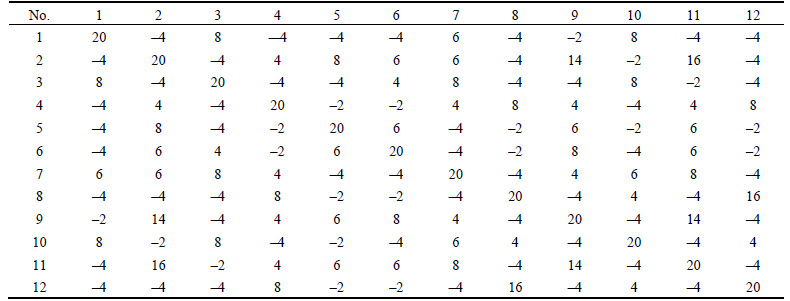
Table 6 Similarity matrix of valve products
The similarity of two valves is difficult to show the similarity of more than three valves. Therefore, the dynamic clustering chart is plotted as shown in Fig. 12.
3) Results analysis
In this work, the agglomeration clustering method [26], a bottom-up strategy, is adopted. Each object is regarded as a cluster. Then these clusters are merged to a larger cluster until all objects are in one cluster, or a termination condition is satisfied. As can be seen in Fig. 12, the valve 8 and the valve 12 are clustered together, indicating the highest degree of similarity. With the reducing of similarity, the valve 4 also is clustered together with the valves 8 and 12. Similarly, the valves 2, 11, 9, 6 and 5 are clustered into a group. The valves 1, 3, 10 and 7 are clustered into a group. The length of horizontal line represents the similarity among the same cluster or different clusters.
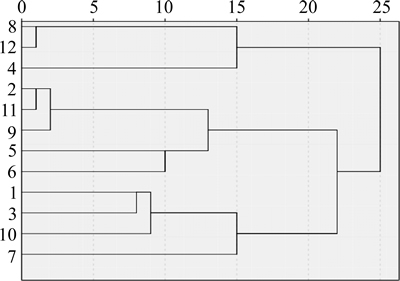
Fig. 12 Dynamic clustering chart of PF mining
According to the production situation and market demand, the cutoff valve generally can be divided into gate valve, ball valve and butterfly valve [27]. When the clustering threshold value is set to 0.5, these valves can be divided into three clusters. According to the information provided by BOM, the three clusters are gate valves, butterfly valves and ball valves, namely the gate valve family, butterfly valve family and ball valve family. If the threshold value is set smaller, these valves will be clustered into one group, namely the cutoff valve family. The mining results agree with the actual situation, so the PF mining algorithm is practicable.
5 Conclusions
1) In the proposed method, the PF can be extracted from the existing product data derived from PLM database based on the multi-space product data. The application of product data in physic space can make it possible to process massive data sets, and the efficiency of mining is greatly improved. The combination of product data in logic space and attribute space makes the mining results more accurate. Moreover, the proposed method can deal with the problems of complex relationships in the data source, vague expressions and data quality defects. It also makes full use of the existing product data information of the enterprise.
2) In the PF mining algorithm, main characteristic sequence alignment of product is used to avoid directly comparing the complicated structural data, which introduces the sequence alignment technology. The sequence alignment technology is more concise and accurate, which is very suitable for computer language processing.
3) The feasibility and effectiveness of the proposed method is verified by a case study of high and middle pressure valves. The product families obtained by this method are consistent with the manual calculation, showing a feasible method to obtain PF from PLM database.
References
[1] Waurzyniak P. Speeding product development through PLM [J]. Manufacturing Engineering, 2010, 144(6): 41�C45.
[2] Silveira G D, Borenstein D, Fogliatto F S. Mass customization: Literature review and research directions [J]. International Journal of Production Economics, 2001, 72(1): 1�C13.
[3] Tiihonen J, Lehtonen T, Soininen T. Modeling configurable product families [C]// Proceedings of 4th wok workshop on Product Structuring. Decf: Delft University of Technology, 1998: 1139�C1142.
[4] Sundgren N. Introducing interface management in new product family development [J]. Journal of Product Innovation Management, 1999, 16(1): 40�C51.
[5] Hernandez G, Allen J K, Woodruff G W. Robust design of families of products with production modeling and evaluation [J]. Journal of Mechanical Design, 2001, 123(2): 183�C190.
[6] Simpson T W, Maier J R, Mistree F. Product platform design: Method and application [J]. Research in Engineering Design, 2001, 13(1): 2�C22.
[7] Erens F, Verhulst K. Architectures for product families [J]. Computers in Industry, 1997, 33(2): 165�C178.
[8] Tseng M M, Jiao J, Merchant M E. Design for mass customization [J]. CIRP Annals-Manufacturing Technology, 1996, 45(1): 153�C156.
[9] JIAO Jian-xin, ZHANG Lian-feng, POKHAREL S, HE Zhen. Identifying generic routings for product families based on text mining and tree matching [J]. Decision Support Systems, 2007, 43(3): 866�C883.
[10] LI Zhong-kai, TAN Jian-rong, FENG Yi-xiong. Optimization and redesign of the product family by bottom-up optimization [J]. Journal of Computer Aided Design and Graphics, 2009, 21(8): 1083�C1091. (in Chinese)
[11] DAI Zhi-huang, Scott M J. Product platform design through sensitivity analysis and cluster analysis [J]. Journal of Intelligent Manufacturing, 2007, 18(1): 97�C113.
[12] Nayak R U, Chen W, Simpson T W. A variation-based methodology for product family design [J]. Journal of Engineering Optimization, 2002, 34(1): 65�C81.
[13] Kumar D. A market-driven approach to the design of platform- based product families [J]. AIAA Journal, 2006(9): 200�C224.
[14] Kumar R, Allada V. Scalable platforms using ant colony optimization [J]. Journal of Intelligent Manufacturing, 2007, 18(18): 127�C142.
[15] LAN Lin-chun, DAN Bin, FENG Tao, ZHANG Xu-mei. A mass customization oriented product family classification [J]. Journal of Chongqing University, 2004, 27(7): 97�C101. (in Chinese)
[16] Suh N P. Axiomatic design [M]. New York: Oxford University Press, 2001: 10�C187.
[17] LI Jian-yong, LIU Jie-ping, MA Li-mei. Product family of reconfigurable manufacturing system based on improved hierarchical clustering algorithm [J]. Mechanical Design and Manufacturing, 2011(8): 78�C80. (in Chinese)
[18] DENG Ke, LIN Jie. Study on the classification of mass customization product modules based on ant colony algorithm [J]. Computer Engineering and Application, 2008, 44(2): 130�C132. (in Chinese)
[19] KANTARDZIC M. Data mining: concepts, models, methods, and algorithms [M]. 2nd ed. John Wiley & Sons, Inc., 2014: 1�C18.
[20] Singh N, Rajamani D. Cellular manufacturing systems design, planning and control [M]. New York: Springer, 1996.
[21] Zahra N, Hamid B, Hassan A. A new genetic algorithm for multiple sequence alignment [J]. International Journal of Computational Intelligence & Applications, 2013, 11(4): 1�C18.
[22] Jiao J, Simpson T W, Siddique Z. Product family design and platform-based product development: A state-of-the-art review [J]. Journal of Intelligent Manufacturing, 2007, 18(1): 5�C29.
[23] XU Jing, JI Yang-jian, QI Guo-ning, LIU Xi-ze, SONG Li-wei. Classification and coding method of mechanical parts for the design process of mass customization [J]. Journal of Mechanical Engineering, 2010, 46(11): 149�C155. (in Chinese)
[24] Mehmet K, Abdullah S, Reda A. Multiple sequence alignment with affine gap by using multi-objective genetic algorithm [J]. Computer Methods & Programs in Biomedicine, 2014, 114(1): 38�C49.
[25] LI Guo, GUAN Xu, LIU Meng-qi, SHAN Mi-yuan. Two-echelon inventory model with service level constraint and controllable lead time sensitive to order quantity [J]. Journal of Central South University, 2013, 20(11): 3324�C3333.
[26] LU Zhi-mao, LIU Chen, Massinanke S, ZHANG Chun-xiang, WANG Lei. Clustering method based on data division and partition [J]. Journal of Central South University, 2014, 21(1): 213�C222.
[27] Lyons J L. Valve technical manual [M]. YUAN Yu-qiu. Beijing: China Machine Press, 1991. (in Chinese)
(Edited by HE Yun-bin)
Cite this article as: HU Xiang-yang, PENG Wei-ping, LEI Jin, DOU Jun-hao, ZHONG Yuan-hua, JIANG Rui. A new product family mining method based on PLM database [J]. Journal of Central South University, 2017, 24(11): 2513�C2523. DOI:https://doi.org/10.1007/s11771-017-3664-9.
Foundation item: Project(51275362) supported by the National Natural Science Foundation of China; Project(2014ZX04015021) supported by National Science and Technology Major Project, China
Received date: 2016-01-31; Accepted date: 2016-06-17
Corresponding author: LEI Jin, PhD, Lecturer; Tel: +86�C18086513376; E-mail: jinlei@whu.edu.cn

