温度对地下结构中声发射源定位精度的影响
来源期刊:中国有色金属学报(英文版)2021年第8期
论文作者:董陇军 陶晴 胡清纯
文章页码:2468 - 2478
关键词:声发射;温度变化;定位精度;结构开裂
Key words:acoustic emission; temperature change; location accuracy; structural cracks
摘 要:通过声发射实验探讨温度对声发射定位精度的影响。采用空心半球形试件模拟常见地下结构。在火焰加热过程中,以恒定频率的脉冲信号作为声发射源,采集各传感器接收到的声发射信号,比较不同温度下的定位精度。结果表明,声发射定位误差在加热初期和加热中期基本相同。在加热后期,由于裂纹的出现,声发射的定位误差急剧增大。这为减少由温度变化引起结构开裂导致的定位误差,提高地下结构防灾减灾能力提供了有益的建议。
Abstract: An acoustic emission (AE) experiment was carried out to explore the AE location accuracy influenced by temperature. A hollow hemispherical specimen was used to simulate common underground structures. In the process of heating with the flame, the pulse signal of constant frequency was stimulated as an AE source. Then AE signals received by each sensor were collected and used for comparing localization accuracy at different temperatures. Results show that location errors of AE keep the same phenomenon in the early and middle heating stages. In the later stage of heating, location errors of AE increase sharply due to the appearance of cracks. This provides some beneficial suggestions on decreasing location errors of structural cracks caused by temperature and improves the ability of underground structure disaster prevention and control.
Trans. Nonferrous Met. Soc. China 31(2021) 2468-2478
Long-jun DONG, Qing TAO, Qing-chun HU
School of Resources and Safety Engineering, Central South University, Changsha 410083, China
Received 24 August 2020; accepted 28 February 2021
Abstract: An acoustic emission (AE) experiment was carried out to explore the AE location accuracy influenced by temperature. A hollow hemispherical specimen was used to simulate common underground structures. In the process of heating with the flame, the pulse signal of constant frequency was stimulated as an AE source. Then AE signals received by each sensor were collected and used for comparing localization accuracy at different temperatures. Results show that location errors of AE keep the same phenomenon in the early and middle heating stages. In the later stage of heating, location errors of AE increase sharply due to the appearance of cracks. This provides some beneficial suggestions on decreasing location errors of structural cracks caused by temperature and improves the ability of underground structure disaster prevention and control.
Key words: acoustic emission; temperature change; location accuracy; structural cracks
1 Introduction
In the early 1950s, Kaiser’s research marked the beginning of modern acoustic emission (AE) technology. AE instruments are used to detect transient elastic wave signals generated by the rapid release of energy in the structure [1]. As a new non-destructive testing technology of dynamic monitoring, AE technology has been widely used in pressure vessels, rotating equipment, composite materials, aerospace, rock, concrete, and other engineering fields [2-4]. Particularly, it plays an essential role in monitoring fault and rock micro-fracture signals in tunnels and mining projects [5-12]. One of the AE detection’s main goals is to determine the position of the AE source, and its accuracy reflects the degree of coincidence between the probe position of the AE source and the actual position of the AE source. Meanwhile, location accuracy can directly reflect whether the detecting method is effective. It is of great significance to improve the source location accuracy for controlling rockburst [13-15].
However, the AE source location accuracy is affected by many factors in the field of practical engineering. Exploring the factors and reducing their impact can effectively improve the AE source location accuracy. The accurate pickup of the arrival time is one of the most important factors to locate the source precisely. In the engineering site, the monitoring environment, discontinuous media, and background noise make it difficult to pick up the arrival time accurately. In recent decades, a large number of excellent arrival time pickup algorithms (such as WS/LK [16], AR-AIC [17], and S/L-K-A [18]) have been proposed to eliminate background noise and interference signals, which significantly improve the accuracy of the source location. Furthermore, some new technologies, such as pattern recognition, artificial intelligence, and neural network, also have been introduced to improve the accuracy of signal acquisition [19].
The deviation of wave velocity will cause a large error. It is of great importance to apply the appropriate wave velocity model for source localization [20]. For example, ZHOU et al [21] used the multi-layer wave velocity model in the layered structure, and HU et al [22,23] approximated the wave velocity of the empty area to zero in the structure with the empty area. These algorithms all have achieved good results. The layout of AE sensors also has a great influence on location accuracy [24,25]. Usually, the source inside the sensor network can reach high location accuracy. Besides, the AE source location algorithm, distance change between AE source and sensor, structure and uniformity of propagation medium, sensor array spacing, and type of AE source all have been proved to impact AE source location accuracy by many scholars [26,27]. However, there is little research about the influence of temperature change caused by fire on the AE source location accuracy. In the actual underground structure, such as tunnels and subways, fire disasters will cause structural damage and engineering instability [28,29]. It is essential to determine the structural damage and the failure position in the fire disaster. Therefore, it is of great significance to explore the influence of temperature stress field on the location accuracy of AE source.
This study designed an AE experiment to explore the effect of temperature on the source location accuracy. A hollow hemispherical specimen was heated with the flame to simulate the fire in the underground structure. During the heating process, the AE source was simulated by a constant frequency pulse, and then the AE signals received by sensors were collected for localization. Meanwhile, this paper explored how to improve the AE location accuracy in the changing temperature field and put forward suggestions for the AE source localization.
2 Methods
Node Block Location Method (NBLM) [22,25] was used in this work for localization because it can meet the high-precision location requirements of the common structures with excavation regions. The specific steps are as follows.
2.1 Meshing entity
The entity and empty areas of the structure to be located have meshed into cubes of the same size. The size of the meshed cube is determined by the volume size and location accuracy requirements.
A node matrix M is established, and the index tag (i, j, k) for the element in M corresponds one-to-one with the grid nodes N. If the grid node falls in the entity area, its corresponding element in the node matrix M is set to be 0, which means that it can pass; the others are set to be 1, which means that they cannot pass.
A block matrix m is established, and the elements in the block matrix m correspond one-to-one with the cube. If the whole cube falls into the entity area, the corresponding element in the matrix m is set to be 0, which means that it can pass; the others are set to be 1.
2.2 Searching shortest wave path
The converted coordinate value of the sensor is input, which corresponds to the grid node. Assuming that every grid node is a potential position of the AE source, the optimized A* search algorithm is used to search for the theoretical shortest distance  between the qth sensor and the grid node N(i, j, k). If the grid node is located in the empty area, then
  .
.
2.3 Acquiring AE signal
AE events are screened out and the actual arrival time of the AE sources is sort out. The difference between the actual arrival time of the AE source to the pth sensor (xp, yp, zp) and to the qth sensor (xq, yq, zq) is expressed by △tpq.
2.4 Determining location of AE source
The theoretical arrival time difference between the AE source to the pth sensor (xp, yp, zp) and to the qth sensor (xq, yq, zq) is expressed by △t′pq, which is as
 (1)
(1)
where  and represent the shortest propagation path distance from the potential AE source to the pth and qth sensors, respectively; C represents the P-wave velocity. The deviation D represents the deviation between the actual AE source and the grid node N(i, j, k), and then,
 (2)
(2)
when Dijk takes Dmin, and the corresponding coordinate value can be regarded as the position of the AE source.
3 Experimental
An AE experiment was designed to explore the effect of temperature on the source location accuracy. The test selected a hollow hemisphere specimen to simulate underground structures (such as large underground warehouses). Generally, underground structures are constructed of concrete and rock. The AE performance of these materials is consistent with the gypsum [30,31].
Therefore, due to the excellent plasticity, gypsum material was used to make the model. The inner radius of the hollow hemisphere gypsum specimen is 200 cm, and the outer radius is 300 cm. To facilitate the analysis of the experimental results, a point heat source was used to heat the specimen at the center of the sphere. Obviously, the temperature of the inner and outer walls of the structure is easy to measure during the heating process. However, the internal temperature of the structure cannot be directly obtained. For the sake of measuring the temperature inside the gypsum, a flat section was taken at 260 cm from the bottom (see Fig. 1(a)), so that the temperature of the gypsum at different radii could be measured. Eight and seven spring-loaded K-type thermocouples were uniformly adhered to the inner and outer walls of the specimen with inorganic high-temperature resistant adhesive, respectively, as shown in Figs. 1(b, c). The measurement range of the thermocouple is 0-600 °C. It has the advantages of a wide temperature range and fast response speed. The UT terminals of the thermocouple were connected to the K-type thermocouple temperature collection system, which could be used to collect the real-time temperature during the heating process. AE monitoring equipment adopted multi-channel equipment (composed of parallel measurement channels). It has 32 channels for collecting AE signals. The sampling frequency was 10 MHz, and the gain of the preamplifier was 34 dB (select the type of amplifier). The sensor model is VS45-H, and the sensor coordinates are shown in Table 1.

Fig. 1 Experimental diagram
Table 1 Position coordinates of sensors (cm)
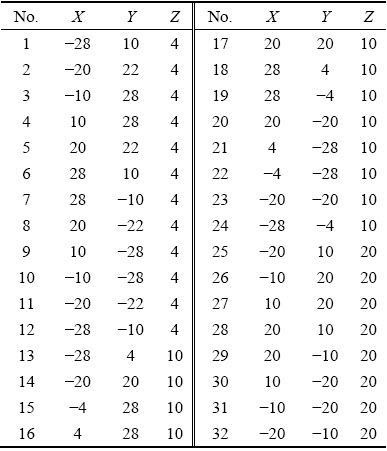
32 AE sensors were symmetrically arranged in the specimen for localization, which were divided into three layers according to the height of the specimen: the first layer arranged 12 sensors, the second layer arranged 12 sensors, and the third layer arranged 8 sensors. The relative position of each sensor is shown in Fig. 1(a). The sensors were fixed on the surface of the specimen with custom-made supporting fixtures. Vaseline was used as a coupling agent on the joint surface of the sensors and the specimen to reduce signal attenuation, and then following by the connection of sensors, preamplifier, and AE acquisition system. Before the formal experiment, lead-break tests were conducted near each sensor to check if the amplitude of the lead-break signal received by each sensor was above 95 dB to ensure the coupling quality of the sensor and the specimen [32]. During the lead-break process, it was found that the amplitudes of Nos. 30 and 31 sensors were lower than 90 dB, while the signals of other sensors could be greater than 98 dB. The intensity of the signal received by these two sensors will become weak and cannot exceed the threshold value. It will also delay the arrival times, which will affect the location accuracy of the AE source. Therefore, it can be concluded that the coupling effect of the Nos. 30 and 31 sensors was poor, so these two sensors were excluded during the test data acquisition and localization. Before continuous monitoring, environmental noise was collected, and the amplitude of the environmental noise received by the sensor was mostly concentrated below 40 dB. Considering the two aspects of reducing the impact of environmental noise and improving the reliability of signal acquisition, the threshold value was set to be 40 dB.
The specimen was perched on a custom-made stainless-steel frame. A solid alcohol furnace was placed in the center of the frame (Fig. 1(a)). During the test, the pulse signal emitted by sensors was used as the AE source, and the interval of pulse emission was 1s. One sensor channel emitted four pulses. Before heating, each channel transmitted four pulses in advance. Then, by lighting the alcohol lamp and adjusting the height of the alcohol furnace, the flame center was located at the geometric ball center of the specimen. After continuous heating, the temperature of the specimen rose continuously from 28 °C (ambient temperature). Thermocouples recorded the temperature in the whole process. AE channels circularly emitted pulses and received the pulses signal at the same time. The monitoring process was stopped until the specimen was broken entirely. Limited by the site conditions, the whole test was conducted outdoors. Although the outdoor temperature may fluctuate slightly, the effect of temperature fluctuation can be ignored because the test time was short.
4 Results and discussion
4.1 Location results and errors with changing temperature
The main purpose of this work is to explore the influence of temperature change caused by fire on AE source location accuracy. During the heating process, according to the temperature collected by the K-type thermocouple temperature acquisition system, it is found that there is no noticeable temperature change in the seven thermocouples on the outer wall of the test piece, while the temperature of the inner wall rises rapidly.
Therefore, the average value of the internal is taken as the temperature of the specimen at each moment. Taking all the pulse signals of AE channels as one round, the experiment process can be divided into the following five stages: room temperature (28 °C), 28-48 °C, 48-69 °C, 69-82 °C, and 82-94 °C. From the beginning of heating the specimen to the moment when the specimen cracked and the test cannot be continued, the entire process only took 9 minutes. Since an AE channel emits four pulses, each pulse point has four location results in every round (the size of the grid element is 1cm for localization). It can be easily noticed that in the first and second round pulses, the locating results showed abnormal values when the sensors 3 and 5 launched for the first time, but the following data were within the normal range. It seems likely that the voltage of sensors 3 and 5 is not stable when they start to transmit pulses. Then these two sets of abnormal data were excluded during the analysis. The location errors are shown in Table 2. To display the locating results more intuitively, the results of the five stages are visualized in Fig. 2. On the whole, it can be seen from the experimental results that with the increase of temperature, the overall trend of the average location errors of the pulse points increases, as well as the standard deviation of the errors.
Table 2 Location errors of four pulses per sensor (cm)

It can be seen from the results that when the specimen is not heated, the average location error of the source points is 1.7 cm, and the standard deviation of location errors is 1.3 cm. This location accuracy is used as the reference value of location accuracy at different temperatures during the test. In the process of heating the specimen, the temperature keeps rising. The temperature of the inner wall reached 48 °C after the AE pulse emitted for one round. In this stage of time, the influence of the temperature change on the location accuracy of the source can almost be ignored. In the third stage, the overall average location accuracy of AE pulses remains unchanged. However, it can be found that the location results of 17 effective pulse points have changed by further comparison. The nodes with increased location accuracy and the nodes with decreased location accuracy account for about half, respectively. For every single pulse point, the temperature change of the specimen has affected its location accuracy in this stage.
As the temperature of the specimen continues to rise, when the 28th sensor emits the pulse in the fourth round, the first crack appears on the specimen after a loud burst. When the fourth round of pulse emission is launched, the average temperature of 8 thermocouples on the inner wall is 82 °C. It is obvious that the temperature rise in this stage is slower than before. The possible reason is that when the temperature is higher than 70 °C, gypsum is easy to be dehydrated, and water vapor evaporation will take away a lot of heat [33]. In this stage, the location accuracy of the pulse point is the same as that of the third stage before the 28th sensor transmitted the pulse. However, after the 28th sensor emitted pulse, the specimen cracked, and the location error increased obviously. When the 29th sensor emitted the pulse in the fifth stage, the specimen made two continuous burst sounds. The inner part of the specimen expands with heat and breaks into three pieces (Fig. 3), which makes it impossible to continue the test. In this stage, the location error increases obviously with the increase of temperature. The average location error reaches 8.9 cm, and its standard deviation reaches 6.1 cm.

Fig. 2 Location results of AE sources obtained by NBLM
4.2 Analysis based on location errors
Figure 4 shows the visualization of the average error of 4 source location results in each stage. It can be seen from the results that five stages can be divided into three periods according to the influence of temperature on location error. The first period is the initial stage of heating (room temperature to 49 °C). This period is stable. The temperature has little influence on the average location error, and the internal stress environment of the specimen is little changed. The second period is the middle period of heating (from the 3rd to the 4th stage until the crack appears). During this period, the internal thermal expansion of the specimen results in the change of internal stress and wave velocity. The location errors of most pulse points are changed, whereas the overall location accuracy is still not changed. Because most existing location methods assume that the wave velocity of the whole specimen is homogeneous, and the wave velocity in homogeneity caused by material in homogeneity is not taken into account. When the temperature inside the specimen increases, the stress inside the specimen will be redistributed. The change of the stress will lead to the change of the wave velocity of the specimen so that the location results of most pulse points in the middle period of heating are different from that in the room temperature state. But the results show that the overall location accuracy is still not changed. It reflects that the location error caused by the temperature is slight, even smaller than the location error caused by the material’s in homogeneity. Meanwhile, this is partly due to the selected NBLM, which takes the influence of wave velocity into account and sets the wave velocity value as an unknown. It can effectively reduce the locating error caused by the change of wave velocity.
The third period is the later period of heating (the specimen cracks). In this period, the location errors will increase significantly because the elastic wave cannot pass through the crack and needs to bypass the crack (Fig. 5), which causes that the waveform path of theoretical calculation is not equal to the real wave path [34]. It will introduce a large location error.
4.3 Suggestion for reducing location errors and next research plan
The appearance of crack will cause huge location errors. Therefore, although there is no need to adjust the location scheme in the early period of fire, it is necessary to effectively reduce the location error after the structural cracking caused by fire. The common methods to improve the location accuracy, such as picking up the accurate arrival time and increasing the number of sensors, may reduce the location error to a certain extent [35,36]. But it is difficult to solve the location error caused by thermal cracking fundamentally. For example, as shown in Fig. 5, three cracks divide the specimen into three parts: A, B, and C. The actual waveform path of the pulse signal generated by sensor 25 in area A to signal 27 in area C is no longer equal to the pre-calculated path. Therefore, the calculated path is no longer related to the actual arrival time difference between the two sensors.
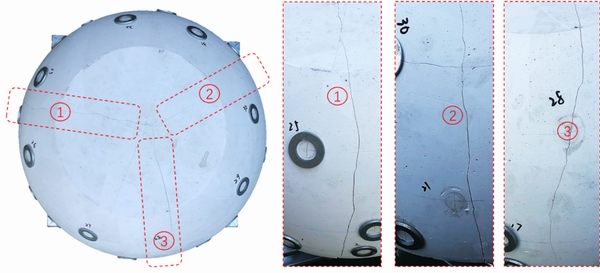
Fig. 3 Crack diagram of cracked gypsum
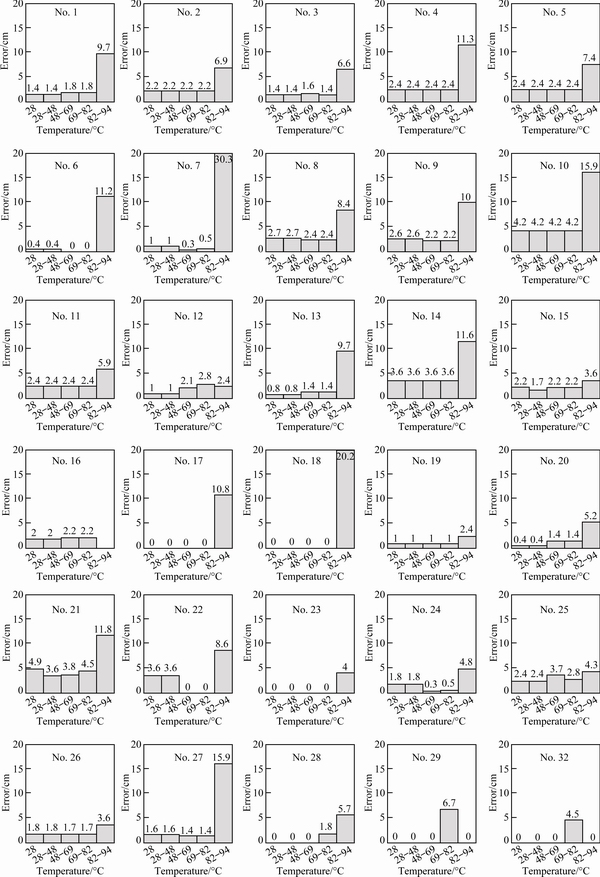
Fig. 4 Average error of 4 source localization results in each stage
If the pre-calculated path continues to be used for source localization, it will introduce a non-negligible error. To avoid the error caused by cracking, only the arrival information received by the sensors in area A should be used to locate the AE events in area A. Of course, areas B and C should be in the same way. In the test, the time and position of cracking can be determined by visual recognition and burst sound. However, in practical engineering, technicians cannot be on the first scene in real-time, and the environmental noise in the fire may drown the crack sound of the structure. It is more difficult to find the crack position in a series of AE events. Therefore, it is of great safety significance to accurately determine the time and location of the structural cracking in the fire and select sensors with more suitable positions for localization in the actual project.
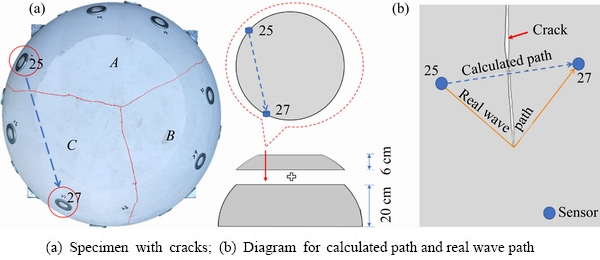
Fig. 5 Calculated path and real wave path for specimen with cracks
5 Conclusions
(1) According to the influence of temperature on location errors, the experimental process can be divided into three periods: the initial period of heating, the middle period of heating, and the later period of heating. In the initial period of heating, when the temperature of the specimen is relatively low, the location error of the pulse point is basically the same as that of the room temperature. In the middle period of heating, the average location error of the pulse point remains unchanged as the temperature increases. However, the location results of each pulse point fluctuate because the thermal expansion inside the structure causes the change of the wave velocity in the structure.
(2) In the later period of heating, the internal expansion of the structure leads to structural cracking, and the location error of the pulse point increases sharply. Because the elastic wave cannot pass through the crack directly and needs to bypass the crack, the actual wave path is no longer equal to the pre-calculated path.
(3) To reduce the location error caused by the structural crack in the fire, it is of great importance to distinguish whether the calculated path between the sensor and the source is related to their actual travel time. Therefore, determining the time and position of structural cracking accurately and selecting sensors in more appropriate places will be meaningful to reduce the location error. This work provides some beneficial suggestions on decreasing location errors of structural cracks caused by temperature change, and it also improves the ability of underground structure disaster prevention and control. The next research is to judge the concrete cracking of the practical structure in the fire.
Acknowledgments
The authors are grateful for the financial support from the National Natural Science Foundation of China (No. 51904334).
References
[1] ZAKI A, CHAI H K, AGGELIS D G, ALVER, N. Non-destructive evaluation for corrosion monitoring in concrete: A review and capability of acoustic emission technique [J]. Sensors, 2015, 15(8): 19069-19101.
[2] DONG Long-jun, CHEN Yong-chao, SUN Dao-yuan, ZHANG Yi-han. Implications for rock instability precursors and principal stress direction from rock acoustic experiments[J]. International Journal of Mining Science and Technology, 2021, https://doi.org/10.1016/j.ijmst.2021.06. 006.
[3] TZIAVOS N, HEMIDA H, DIRAR S, PAPAELIAS M, METJE N, BANIOTOPOULOS C. Structural health monitoring of grouted connections for offshore wind turbines by means of acoustic emission: An experimental study [J]. Renewable Energy, 2020, 147(3): 130-140.
[4] QIU Li-ming, SONG Da-zhao, LI Zhong-hui, LIU Bao-bei, LIU Jie. Research on AE and EMR response law of the driving face passing through the fault [J]. Safety Science, 2019: 184-193.
[5] WANG Yun-hai, LIU Yong-feng, MA Hai-tao. Changing regularity of rock damage variable and resistivity under loading condition [J]. Safety Science, 2012, 50(4): 718-722.
[6] DONG Long-jun, WESSELOO J, POTVIN Y, LI Xi-bing. Discrimination of mine seismic events and blasts using the fisher classifier, naive Bayesian classifier and logistic regression [J]. Rock Mechanics and Rock Engineering, 2016, 49(1): 183-211.
[7] PARK B, SOHN H, OLSON S E, DESIMIO, M P, BROWN, K S, DERRISO, M M. Impact localization in complex structures using laser-based time reversal [J]. Structural Health Monitoring-an International Journal, 2012, 11(5): 577-588.
[8] LONG Yi, LIU Jian-po, LEI Gang, SI Ying-tao, ZHANG Chang-yin, WEI Deng-cheng, SHI Hong-xu. Progressive fracture processes around tunnel triggered by blast disturbances under biaxial compression with different lateral pressure coefficients [J]. Transactions of Nonferrous Metals Society of China, 2020, 30(9): 2518-2535.
[9] LOU Quan, SONG Da-zhao, HE Xue-qiu, LI Zhen-lei, QIU Li-Ming, WEI Meng-han, He Sheng-quan. Correlations between acoustic and electromagnetic emissions and stress drop induced by burst-prone coal and rock fracture [J]. Safety Science, 2019: 310-319.
[10] HIRATA A, KAMEOKA Y, HIRANO T. Safety management based on detection of possible rock bursts by AE monitoring during tunnel excavation [J]. Rock Mechanics and Rock Engineering, 2007, 40(6): 563-576.
[11] DONG Long-jun, TONG Xiao-jie, LI Xi-bing, ZHOU Jian, WANG Shao-feng, LIU Bing. Some developments and new insights of environmental problems and deep mining strategy for cleaner production in mines [J]. Journal of Cleaner Production, 2019: 1562-1578.
[12] HE Hu, DOU Lin-ming, GONG Si-yuan, HE Jiang, ZHENG You-lei, ZHANGXiong. Microseismic and electromagnetic coupling method for coal bump risk assessment based on dynamic static energy principles [J]. Safety Science, 2019: 30-39.
[13] LI Zhen-lei, HE Xue-qiu, DOU Lin-ming, SONG Da-zhao, WANG Gui-feng, XU Xing-liang. Investigating the mechanism and prevention of coal mine dynamic disasters by using dynamic cyclic loading tests [J]. Safety Science, 2019: 215-228.
[14] DAVYDOVA D G, KUZMIN A N, RIZVANOV R G, AKSEL'ROD, E G. Identification of acoustic-emission sources during testing of technological equipment with a high noise level [J]. Russian Journal of Nondestructive Testing, 2015, 51(5): 292-302.
[15] JIAO Jing-pin, WU Bin, HE Cun-fu. Acoustic emission source location methods using mode and frequency analysis [J]. Structural Control & Health Monitoring, 2008, 15(4): 642-651.
[16] LI Xi-bing, SHANG Xue-yi, WANG Ze-wei, DONG Long-jun, WENG Lei. Identifying P-phase arrivals with noise: An improved Kurtosis method based on DWT and STA/LTA [J]. Journal of Applied Geophysics, 2016: 50-61.
[17] BAI Tian-yang, WU Shun-chuan, WANG Jin-jin. Review of P-onset picking of acoustic emission compression waves and optimized improvement [J]. Chinese Journal of Rock Mechanics and Engineering, 2016, 035(009):1754-1766. (in Chinese)
[18] SHANG Xue-yi, LI Xi-bing, MORALES-ESTEBAN A, DONG Long-jun. An improved P-phase arrival picking method S/L-K-A with an application to the Yongshaba mine in China[J]. Pure and Applied Geophysics, 2018, 175(6): 2121-2139.
[19] YU Zi-ye, CHURi-sheng, SHENG Min-han. Pick onset time of P and S phase by deep neural network [J]. Chinese Journal of Geophysics, 2018,61(12): 4873-4886. (in Chinese)
[20] LI Qi-yue, DONG Long-jun, LI Xi-bing, YIN Zhi-qiang, LIU Xi-ling. Effects of sonic speed on location accuracy of acoustic emission source in rocks [J]. Transactions of Nonferrous Metals Society of China, 2011, 21(12): 2719-2726.
[21] ZHOU Zi-long, RUI Yi-chao, ZHOU Jing, DONG Long-jun, CAI Xin. Locating an acoustic emission source in multilayered media based on the refraction path method [J]. IEEE Access, 2018, 6: 25090-25099.
[22] XIAO Pan, HU Qing-chun, TAO Qing, DONG Long-jun, YANG Zhan-feng, ZHANG Wei-bin. Acoustic emission location method for quasi-cylindrical structure with complex hole [J]. IEEE Access, 2020, 8: 35263-35275.
[23] HU Qing-chun, DONG Long-jun. Acoustic emission source location and experimental verification for two-dimensional irregular complex structure [J]. IEEE Sensors Journal, 2020, 20(5): 2679-2691.
[24] DONG Long-jun, TONG Xiao-jie, MA Ju. Quantitative investigation of tomographic effects in abnormal regions of complex structures [J]. Engineering, 2021, 7(7): 1011-1022.
[25] DONG Long-jun, HU Qing-chun, TONG Xiao-jie, LIU You-fang. Velocity-free MS/AE source location method for three-dimensional hole-containing structures [J]. Engineering, 2020,6(7): 827-834.
[26] YANG Hui-ming, WEN Guang-cai, HU Qian-ting, LI Yuan-yuan, DAI Lin-chao. Experimental investigation on influence factors of acoustic emission activity in coal failure process [J]. Energies, 2018, 11(6): 1414.
[27] TIANAo-xue. Experimental study on influential factors of acoustic emission location experiment [D]. College Of Resources And Environmental Science of Chongqing University, Chongqing, China 2015: 17-27. (in Chinese)
[28] WANG Yun-jia, TIAN Feng, HUANG Yi, WANG Jian, WEI Chang-jing. Monitoring coal fires in Datong coalfield using multi-source remote sensing data [J]. Transactions of Nonferrous Metals Society of China, 2015, 25(10): 3421-3428.
[29] MUHAMMAD K, AHMAD J, BAIK S W. Early fire detection using convolutional neural networks during surveillance for effective disaster management [J]. Neurocomputing, 2017, 288: 30-42.
[30] JI Hong-guang. Research and application of acoustic emission performance in concrete materials [M]. Beijing: Coal Industry Press, 2004. (in Chinese)
[31] LIU Yu-jun, HUANG Kan, ZHANG Ke-neng. Experimentation and research on properties of simulated rock [J]. Building Technique Development, 2003, 30(8): 62-63.(in Chinese)
[32] ZHOU Zi-long, ZHOU Jing, CAI Xin, RUI Yi-chao, CHEN Lian-jun, WANG Hai-quan. Acoustic emission source location considering refraction in layered media with cylindrical surface [J]. Transactions of Nonferrous Metals Society of China, 2020, 30(3): 789-799.
[33] FATU D. Kinetics of gypsum dehydration [J]. Journal of Thermal Analysis and Calorimetry, 2001, 65(1): 213-220.
[34] GOLLOB S, KOCUR G K, SCHUMACHER T, MHAMDI L, VOGEL T. A novel multi-segment path analysis based on a heterogeneous velocity model for the localization of acoustic emission sources in complex propagation media [J]. Ultrasonics, 2017(74): 48-61.
[35] DONG Long-jun, LI Xi-bing, ZHOU Zi-long, CHEN Guang-hui, MA Ju. Three-dimensional analytical solution of acoustic emission source location for cuboid monitoring network without pre-measured wave velocity [J]. Transactions of Nonferrous Metals Society of China, 2015, 25(1): 293-302.
[36] DONG Long-jun, TANG Zheng, LI Xing-bing, CHEN Yong-chao, XUE Jin-chun. Discrimination of mining microseismic events and blasts using convolutional neural networks and original waveform [J]. Journal of Central South University, 2020, 27(10): 3078-3089.
董陇军,陶 晴,胡清纯
中南大学 资源与安全工程学院,长沙 410083
摘 要:通过声发射实验探讨温度对声发射定位精度的影响。采用空心半球形试件模拟常见地下结构。在火焰加热过程中,以恒定频率的脉冲信号作为声发射源,采集各传感器接收到的声发射信号,比较不同温度下的定位精度。结果表明,声发射定位误差在加热初期和加热中期基本相同。在加热后期,由于裂纹的出现,声发射的定位误差急剧增大。这为减少由温度变化引起结构开裂导致的定位误差,提高地下结构防灾减灾能力提供了有益的 建议。
关键词:声发射;温度变化;定位精度;结构开裂
(Edited by Xiang-qun LI)
Corresponding author: Qing-chun HU, Tel: +86-18390907933, E-mail: 0202130221@csu.edu.cn
DOI: 10.1016/S1003-6326(21)65667-4
1003-6326/  2021 The Nonferrous Metals Society of China. Published by Elsevier Ltd & Science Press

