2050 Al-Li合金的流变曲线修正及加工图
来源期刊:中国有色金属学报(英文版)2018年第3期
论文作者:朱瑞华 刘晴 李劲风 陈永来 张绪虎 郑子樵
文章页码:404 - 414
关键词:2050铝锂合金;加工图;动态回复;动态再结晶;流变集中
Key words:2050 Al-Li alloy; processing map; dynamic recovery; dynamic recrystallization; flow localization
摘 要:采用热压缩实验研究2050 Al-Li合金在变形温度为340~500 °C、应变速率为0.001~10 s-1范围内的热变形行为。分析摩擦及温度变化对流变应力的影响,并对流变曲线进行修正处理;基于动态材料模型及修正后的真应力数据,获得真应变为0.5条件下合金的加工图;利用金相显微镜对压缩试样显微组织变化进行观察。结果表明,在热变形过程中材料的摩擦及温度变化对流变应力有显著影响;合金合适加工区域位于变形温度为370~430 °C、应变速率为0.01~0.001 s-1区域,以及变形温度为440~500 °C、应变速率为0.3~0.01 s-1区域内;失稳区位于高应变速率下(3~10 s-1)所有温度范围内;动态回复和动态再结晶是2050 Al-Li合金在稳定加工区域内主要变形机理,而在失稳区合金变形机理主要表现为流变集中。
Abstract: Hot compression tests of 2050 Al-Li alloy were performed in the deformation temperature range of 340-500 °C and strain rate range of 0.001-10 s-1 to investigate the hot deformation behavior of the alloy. The effects of friction and temperature difference on flow stress were analyzed and the flow curves were corrected. Based on the dynamic material model, processing map at a strain of 0.5 was established. The grain structure of the compressed samples was observed using optical microscopy. The results show that friction and temperature variation during the hot compression have significant influences on flow stress. The optimum processing domains are in the temperature range from 370 to 430 °C with the strain rate range from 0.01 to 0.001 s-1, and in the temperature range from 440 to 500 °C with the strain rate range from 0.3 to 0.01 s-1; the flow instable region is located at high strain rates (3-10 s-1) in the entire temperature range. Dynamic recovery (DRV) and dynamic recrystallization (DRX) are the main deformation mechanisms of the 2050 alloy in the stable domains, whereas the alloy exhibits flow localization in the instable region.
Trans. Nonferrous Met. Soc. China 28(2018) 404-414
Rui-hua ZHU1, Qing LIU1, Jin-feng LI1, Yong-lai CHEN2, Xu-hu ZHANG2, Zi-qiao ZHENG1
1. School of Materials Science and Engineering, Central South University, Changsha 410083, China;
2. Aerospace Research Institute of Materials and Processing Technology, Beijing 100076, China
Received 5 June 2015; accepted 8 December 2015
Abstract: Hot compression tests of 2050 Al-Li alloy were performed in the deformation temperature range of 340-500 °C and strain rate range of 0.001-10 s-1 to investigate the hot deformation behavior of the alloy. The effects of friction and temperature difference on flow stress were analyzed and the flow curves were corrected. Based on the dynamic material model, processing map at a strain of 0.5 was established. The grain structure of the compressed samples was observed using optical microscopy. The results show that friction and temperature variation during the hot compression have significant influences on flow stress. The optimum processing domains are in the temperature range from 370 to 430 °C with the strain rate range from 0.01 to 0.001 s-1, and in the temperature range from 440 to 500 °C with the strain rate range from 0.3 to 0.01 s-1; the flow instable region is located at high strain rates (3-10 s-1) in the entire temperature range. Dynamic recovery (DRV) and dynamic recrystallization (DRX) are the main deformation mechanisms of the 2050 alloy in the stable domains, whereas the alloy exhibits flow localization in the instable region.
Key words: 2050 Al-Li alloy; processing map; dynamic recovery; dynamic recrystallization; flow localization
1 Introduction
Compared with conventional Al alloys, Al-Li alloys typically possess lower density, higher elastic modulus and improved fatigue crack growth resistance. 2050 alloy is one of the 3rd generation Al-Li alloys targeting static and fatigue properties to be equal or better than 7050 alloy with 4% density reduction and 5% elastic modulus enhancement [1]. Heretofore, 2050 Al-Li alloy has many applications in transport aircraft from wing spars and ribs to other internal structures in wings and fuselages [2]. These components are usually formed by hot working, either by rolling or forging [2]; the high forming temperatures result in microstructural changes that significantly influence the final mechanical response of the alloy [3]. Though 2050 Al-Li alloy has been widely used in aircraft industry, limited works on the hot deformation behavior of this alloy are found in open publication so far. In view of this, the fundamentals of the thermomechanical process, hot deformation characteristics and microstructural evolution, specific to 2050 Al-Li alloy should be made clear.
The isothermal hot compression test has been widely used to determine a material’s stress-strain response at elevated temperatures [4]. However, friction between sample and die during the compression process has to be considered before further investigation [5-7], because practical measured flow curve departs from the real response of the material to a certain degree. This is especially true in hot compression process, where the friction is hard to eliminate completely even when the lubricant is added [8]. Hence, reducing the friction coefficient during the metalworking and correcting the flow curve for real behavior are of great importance. In addition, compression test at elevated temperature usually leads to a temperature rise or decrease of the deformed specimen due to adiabatic heating or heat dissipation; the resulting flow stresses are therefore lower or higher than the actual flow stress for the desired test temperature under isothermal conditions [9,10]. This could also lead to some errors in further research. In view of the above factors, the true stress-strain data directly obtained from the compression test must be corrected for friction and temperature difference.
The processing map technique was widely used to understand the hot workability of many materials in terms of microstructural process operating over ranges of temperatures and strain rates [11-16]. Developed on the basis of dynamic material model (DMM) [17], processing map not only presents the stable domains in which a decisive deformation mechanism of specific microstructure takes place, but also describes the instability regions which should be avoided during hot working [18]. Meanwhile, the processing map is a practical tool for optimizing hot working processing parameters. Therefore, processing map provides a strong method to design hot processes of materials and more effectively control microstructure by hot processes.
In this work, a detailed description of performing the friction and temperature difference correction was presented. Based on the DMM, the processing map of 2050 Al-Li alloy was developed in order to analyze the instability regions and optimize the hot working parameters. Moreover, various deformation mechanisms of the alloy were validated by microstructure observations.
2 Experimental
The chemical composition (mass fraction) of the 2050 Al-Li alloy used in this study was as follows: 3.4% Cu, 1.2% Li, 0.4% Mg, 0.4% Ag, 0.35% Mn, 0.1% Zr, 0.1% Zn, and balance Al. The rectangular ingot was prepared by melting in an electric furnace protected by argon atmosphere and pouring into a water-cooled copper chilled mold and then homogenized at 450 °C for 16 h and 500 °C for 18 h. Figure 1 shows optical metallographic images of the as-cast and homogenized alloys. The typical cast structure is shown in Fig. 1(a). After homogenization, dendrite segregation was almost eliminated and massive secondary phases along grain boundary dissolved into the matrix, as shown in Fig. 1(b).

Fig. 1 Optical metallographic images of alloys
Cylindrical specimens with a diameter of 10 mm and a height of 15 mm were machined from the homogenized ingot. Uniaxial compression tests were conducted on a Gleeble-3180D thermal-mechanical simulator (Dynamic Systems Inc., America) in the temperature range from 340 to 500 °C with an interval of 40 °C and the strain rate range from 0.001 to 10 s-1. Graphite foils were placed between the specimen and die for lubrication. In order to capture the temperature changes occurring during the test, a thermocouple with a diameter of 0.25 mm and a response time of 0.1 s was welded on the specimen surface at the mid-height. The specimen was heated to the preset temperature at a rate of 5 °C/s, soaked for 180 s to homogenize the temperature in the whole sample, compressed by 40% in height and then quenched in water quickly, as illustrated in Fig. 2.
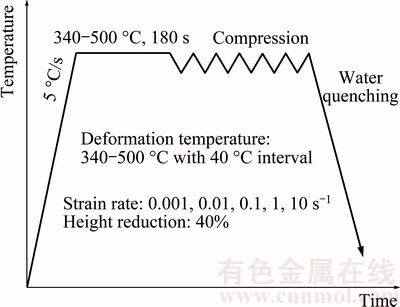
Fig. 2 Schematic diagram of hot compression test
The deformed specimens were sectioned parallel to the compression axis for microstructure observation. Their grain structures were viewed with cross-polarized light on a Leica DMILM optical microscope (OM, Leica Microsystems Wetzlar GmbH, Germany). The thermo-physical parameters (specific heat and thermal conductivity) of the 2050 Al-Li alloy were measured by a Laser Flash Apparatus JR-3 (Central South University Precision Instrument Co., Ltd., Changsha, China) for data correction.
3 Results and discussion
3.1 True stress-strain curves
Representative true stress-strain curves of the 2050 Al-Li alloy at various strain rates with a given temperature of 380 °C and at various temperatures with a given strain rate of 0.1 s-1 are illustrated in Figs. 3(a) and (b), respectively. As expected for this alloy, the flow stress is significantly affected by deformation temperatures and strain rates. At a given temperature, the flow stress increases with the increase of the strain rate (Fig. 3(a)). While at a given strain rate, the flow stress decreases with increasing the deformation temperature (Fig. 3(b)). It should be mentioned that, at the strain rate of 0.1 s-1 with different testing temperatures, almost all the flow curves exhibit a further increase in the flow stress at strains above ~0.2. Such an increase could be attributed to the effects of friction and temperature variation, either alone or together. Further study is needed to clarify the underlying mechanisms.
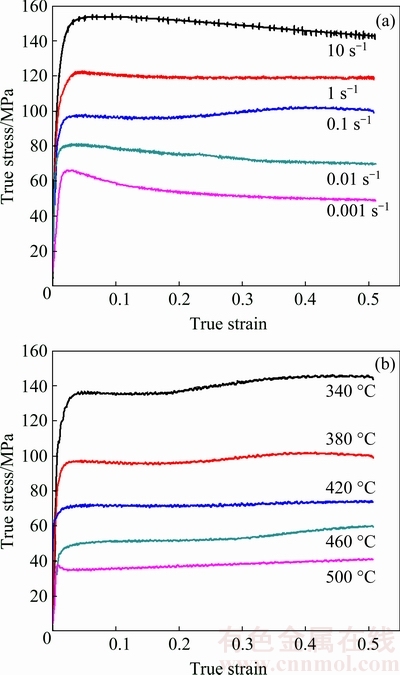
Fig. 3 Typical true stress-strain curves of 2050 Al-Li alloy at various strain rates with given temperature of 380 °C (a) and various deformation temperatures with given strain rate of 0.1 s-1 (b)
3.2 Correction for friction and temperature difference
3.2.1 Friction correction based on upper-bound theory
The application of suitable lubricant can reduce the friction between specimen and die during deformation, but cannot eliminate it completely. Friction increases nonhomogeneous deformation, leading to the barreled shape of specimens, as shown in Fig. 4. H0 and R0 are the initial height and radius of the cylinder sample, respectively; H is the height after deformation, RM and RT are the maximum and top radii after deformation, respectively. ROEBUCK et al [19] developed a criterion for evaluating the effect of friction by a barreling coefficient B, which can be expressed as
 (1)
(1)
When 1<B<1.1, the difference between the measured and true flow stress is slight, the flow curves do not need to be corrected; when B≥1.1, however, the difference cannot be overlooked. Based on the criterion, the values of B are calculated as a range of 1.593-1.835. Hence, the measured flow stresses should be corrected.

Fig. 4 Simple representation of hot compression test
Based on the upper-bound theory, a simple theoretical analysis of barrel compression test was developed by EBRAHIMI and NAJAFIZADEH [20] to determine the friction factor by the following relationship:
 (2)
(2)
where μ is the friction coefficient varying from 0 (perfect sliding) to 1 (sticking), b is the barreling parameter, R is the average radius of cylinder after deformation, ΔR is the difference between the maximum and top radius (ΔR=RM-RT) and ΔH is the height reduction. In practice, the accurate measurement of the top radius (RT) is difficult, because the contacting profiles between specimen and die are formed by both the surface in the middle area and the area formed from the side surface of the sample in the outer area, as shown in Fig. 4. Therefore, with approximation of the barreled specimen with an arc of a circle, RT can be determined by the following equation [20]:
 (3)
(3)
The equations for friction correction are as follows [4]:
 (4)
(4)
where σf is the flow stress after friction correction, P is the measured flow stress under frictional conditions and k is the equivalent friction coefficient (k=σf/P).
In the compression process, the contacting profiles between specimen and die increase with the increase of the true strain, leading to an increase in the friction coefficient. However, directly predicting the friction coefficient at an instantaneous strain is difficult during the working process. Recently, LI et al [21] provided a model regarding the friction coefficient evolution as an empirical function of true strain. In this model, the instantaneous friction coefficient follows an approximately linear relationship with the true strain at lower strain levels (ε≤0.6). In the present study, the true strain is 0.51, since the equivalent friction coefficient k is equal to 1 when ε=0 and it can be determined when ε=0.51 according to Eqs. (2)-(4), by using the two sets of data, a linear relationship is thereby established between k and ε to calculate the value of k at various strain levels between 0 and 0.51.
Based on the above approach, the flow stress after friction correction under various deformation conditions can be obtained. The corrected and uncorrected true stress-strain curves at various deformation temperatures with a given strain rate of 0.1 s-1 are shown in Fig. 5. The corrected flow stresses are generally lower than those of the uncorrected ones, which nicely reflect the ill effects of the friction on the flow stress. The difference is more significant at higher strain levels, indicating that the effect of friction increases with the increase of the true strain. Actually, all the true stress-strain curves at other strain rates show similar trend, which is hence omitted. It should be emphasized here that only some curves were omitted because of their similar trend, but the difference was included in the corrections.
3.2.2 Temperature difference correction
The specimen’s temperature usually rises or deceases during hot compression process due to adiabatic heating or heat dissipation. For accurate flow stress at strain rate ≥ 10-3 s-1, the data must be corrected for flow softening or hardening due to temperature variation [22].
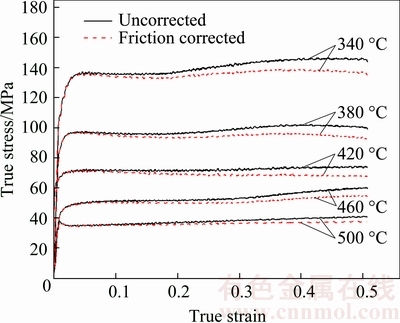
Fig. 5 True stress-strain curves uncorrected and corrected for friction at various temperatures with given strain rate of 0.1 s-1
The first step in the correction is to determine the temperature difference.
Figure 6 shows the variation of temperature difference (ΔT) with the true strain (ε) under various deformation conditions. At the strain rate of 10 s-1, there exists an almost linear increase in ΔT with increasing ε due to adiabatic heating. At a lower strain rate of 1 s-1, the temperature difference rises at a certain strain level, and then decreases continuously as a result of heat dissipation through dies to the environment. At an even lower strain rate of 0.1 s-1, due to an inevitable delay for the external heating to react, the deformation heat appears to be unable to compensate for the heat dissipation, and the specimen temperature lowers continuously by a few degrees under the pre-set temperature. At strain rates of 0.01 and 0.001 s-1, there is enough time for heat loss and also for heat compensation by the external heating so that the measured specimen temperature remains stable throughout the compression process [23].
It should be noted that the temperature difference at strain rates ≤1 s-1 is directly measured, while that at 10 s-1 is calculated and its calculated approach will be described in detail as follows. In the present study, the thermocouple for temperature measurement possesses a response time of 0.1 s, which is able to capture the temperature variation during the compression process at a strain rate ≤1 s-1 with a deformation duration ≥0.51 s up to the true strain of 0.51. At a higher strain rate of 10 s-1, however, the thermocouple becomes unable to capture the temperature changes, because the compression process only lasts for 0.051 s. It was reported that at this high strain rate of 10 s-1, the deformation heat due to plastic work did not have enough time to dissipate from the sample and consequently the sample temperature rose [4,22]. In this case, the process will be adiabatic. The temperature increase due to adiabatic heating during deformation is usually calculated by [24]
 (5)
(5)
where ΔT is the temperature difference, ηtemp is the adiabatic correction factor,  is the mechanical work, cp is the specific heat capacity, ρ is the material density, and the factor of 0.95 is the fraction of mechanical work transformed to heat.
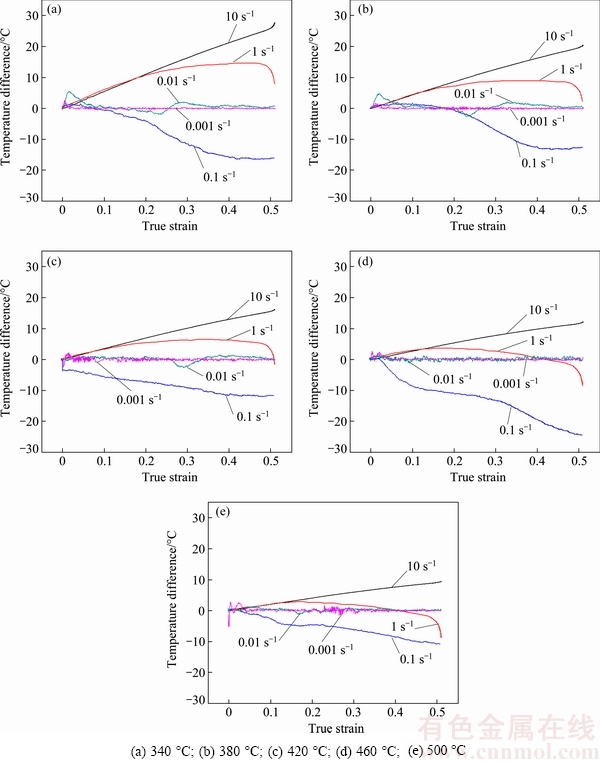
Fig. 6 Variation of temperature difference with true strain at various temperatures
The adiabatic correction factor, ηtemp, is the fraction of the adiabatic heat retained in the specimen and is defined as [23]:
 (6)
(6)
ηtemp has a value between 0 and 1, spanning from the isothermal condition at a very low strain rate to the adiabatic condition at a very high strain rate. Using the finite element method (FEM) and a one-dimensional, lumped parameter method, GOETZ and SEMIATIN [22] suggested that ηtemp was a complex function of strain, thermal conductivities of the specimen and die, and heat-transfer coefficient (HTC) of the interface, which can be expressed as follows:
 (7)
(7)
where xS is one-half of the height of the specimen, △ε is the strain change,  is the strain rate, and HHTC is an overall HTC that lumps together the thermal resistances of the specimen interior, specimen/die interface contact area, and the die interior, which is given by
 (8)
(8)
where kS is the thermal conductivity of the specimen, KHTC is the interface heat-transfer coefficient, xD is the distance from the die surface to the die interior where temperature is constant, and kD is the thermal conductivity of the die. One-half of the height of the specimen xS is given by [22]
 (9)
(9)
where x0 is the initial half-height, and tS is the time.
In the case of the 2050 Al-Li alloy investigated in this study, ρ is 2650 kg/m3 measured by Archimedes method. The values of cp and kS at different temperatures are listed in Table 1. The hot-pressed silicon nitride (HPSN) dies used in the present study have a thermal conductivity (kD) of 10 W/(m・K), a KHTC of 10 kW/(m2・K) and a xD of 3.3 mm. According to Eqs.(5)-(9) and the above thermal physical parameters, the temperature difference caused by adiabatic heating at a strain rate of 10 s-1 is therefore calculated.
Table 1 Measured values of specific heat capacity and thermal conductivity of investigated 2050 Al-Li alloy at different temperatures

With both measured and calculated temperatures of specimens, the isothermal flow stress σT (after temperature difference correction following friction correction) can be determined using the following equation [25]:
 (10)
(10)
where σf is the flow stress after friction correction,  is regarded as a temperature sensitivity of the flow stress, and it can be determined from the yield stress σ0 dependence on temperature through the following relationship:
 (11)
(11)
It should be noted that, up to the yield stress, as the plastic strain is very small, the thermal heating and heat dissipation can be neglected. According to the measured true stress-true strain curves, the σ0-T relationship under various deformation conditions is given in Fig. 7. To determine the yield stress dependence on temperature ,appropriate polynomials are used to fit the yield stress at various strain rates. By following Eqs. (5)-(11), the isothermal flow stress σT at any temperature, strain rate and strain level can be calculated.

Fig. 7 σ0-T relationship under various deformation conditions
Figure 8 shows the comparison between the true stress-true strain curves after friction-temperature difference correction and friction correction at strain rates of 10 s-1 and 0.1 s-1. The effect of temperature difference correction on flow stress is different with the strain rate. At the high strain rate of 10 s-1, flow curves after friction-temperature difference correction generally are higher than those of friction corrected ones (Fig. 8(a)). While at the lower strain rate of 0.1 s-1, the flow curves after friction-temperature difference correction are lower than those after friction correction, as shown in Fig. 8(b). The above differences are attributed to the temperature variation caused by different strain rates. At the higher strain rate of 10 s-1, the adiabatic heating causes a marked increase in sample temperature (see black lines in Fig. 6) and therefore results in a significant softening. While at 0.1 s-1, the temperature decease of the sample due to heat dissipation (see blue lines in Fig. 6) leads to a flow stress increase. At the lower strain rates of 0.01 and 0.001 s-1, the effect of temperature difference correction on flow stress is superficial due to a much small temperature difference (Fig. 6), of which the corrected true stress-strain curves are therefore omitted.
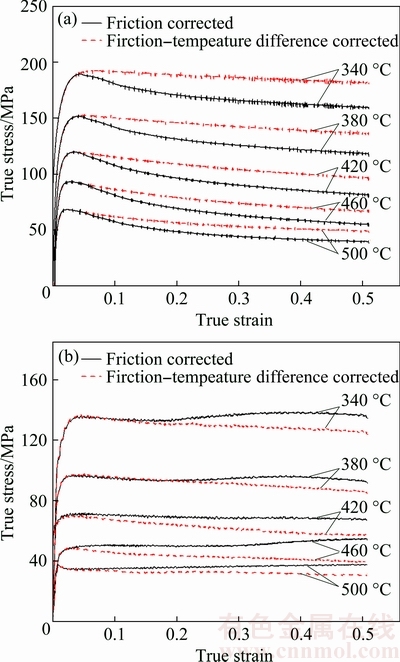
Fig. 8 True stress-true strain curves after friction-temperature difference correction and friction correction at strain rates of 10 s-1 (a) and 0.1 s-1 (b)
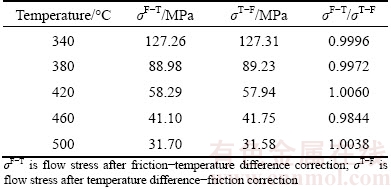
It is well known that the effects of friction and temperature variation on the flow stress are simultaneous during hot deformation. While performing the friction and temperature difference corrections, a sequential step procedure should be used [4]. A question should be considered whether the correction order has a noticeable effect on the correction result. Table 2 compares the corrected flow stresses with two correction orders. It is observed that the difference is very slight and therefore the effect of correction order is neglectable.
Table 2 Comparison of corrected flow stresses with different correction order at strain of 0.5 and strain rate of 0.1 s-1
3.3 Processing map
Since the processing map is mainly related to the evolution of microstructure, the above mentioned factors such as friction and temperature variation effect do not essentially correlate with the change in microstructure [24]. The flow stresses only after friction and temperature variation correction are employed to conduct processing map for avoiding external influences. Processing map in this study, including both power dissipation map and instability map, are developed based on the DMM. This model considers that mechanical is a system and that the work-piece is a nonlinear dissipater of power [17]. At a given strain rate, the instant power dissipated consists of two complementary parts of G and J, the former content relates to the temperature rise whereas the latter relates to the dissipation caused by metallurgical processes [26,27]. G and J can be related by the strain rate sensitivity (m), which can be determined by [12]
 (12)
(12)
and J can be expressed as [28]
 (13)
(13)
For an ideal linear dissipater, m=1 and J=Jmax= The efficiency of power dissipation (η) is expressed as a dimensionless parameter as follows [18,29]:
 (14)
(14)
The variation of η with temperature and strain rate constitutes the power dissipation map, from which some specific microstructure processes can be judged. The continuum criterion for the occurrence of flow instability is determined based on the principle of maximum rate of entropy production, which is given by [26]
 (15)
(15)
The parameter  can be plotted as a function of temperature and strain rate, the region in which this parameter is negative will exhibit flow instability. Such plot is called instability map. By superimposing the instability map over the power dissipation map, the regions of flow instabilities can be obtained.
Based on the corrected flow stresses, typical processing map in the temperature range of 340-500 °C and strain rate range of 0.001-10 s-1 at a strain of 0.5 (which is the steady state strain) is established, as shown in Fig. 9. In the processing map, the contour numbers represent constant power dissipation efficiencies that are expressed in percentage, and the dotted domain indicates the region of flow instability. As shown in this figure, the map exhibits two domains with high power dissipation efficiency value. Domain I with efficiency values in the range from 26% to 37% is in temperature range of 370-430 °C and strain rate range of 0.01-0.001 s-1; domain II with efficiency values in the range of 28%-33% occurs in temperature range of 440-500 °C and strain rate range of 0.3-0.01 s-1. The peak efficiency of approximately 37% is observed at 400-410 °C and 0.001 s-1. The instability domain is found at high strain rate (3-10 s-1) in the entire temperature range, which locates at the upper part of processing map, and the corresponding efficiency value is relatively low (<10%). Generally, microstructure evolution in the stable domains is likely to be dynamic recovery (DRV), dynamic recrystallization (DRX) or superplasticity, and the material exhibits good workability when the specimen deforms in the domain with higher efficiency of power dissipation [11]. In the unstable region, however, material possibly exhibits instabilities in terms of flow localization, adiabatic shear bands or dynamic strain aging. These instabilities affect the formability of the material while shaping and degrading its mechanical properties [18]. By considering the power dissipation map and the instability map together, it is thought that Domain I and Domain II correspond to the optimum conditions for the deformation process of the 2050 Al-Li alloy.

Fig. 9 Processing map of 2050 Al-Li alloy at true strain of 0.5
To verify the accuracy of the established processing map and investigate the specific deformation mechanism in the stable and unstable regions, microstructures of the specimen deformed at specific process parameters will be discussed in the next section.
3.4 Microstructural evolution
Figure 10 shows typical OM images of the specimens deformed at different process parameters that include the stable and the unstable regions. Comparing micrographs in Figs. 10(a), (b) and (c) with those in Figs. 10(d), (e) and (f), the microstructures of 2050 Al-Li alloy deformed in stable regions are more homogenous than those in unstable region. The unstable domain is mainly located in the region with high strain rate, the corresponding microstructures obviously exhibit the formation of flow localization (Figs. 10(a), (b) and (c)). In addition, the flow localization becomes weak with increasing temperature. In general, the flow localization is easily generated at low temperature and high strain rate during hot deformation. This is because the strain rate is too rapid and the heat cannot release in time, which results in localized temperature rise [30].
Typical microstructures of the sample deformed in stable domains are shown in Figs. 10(d), (e) and (f). When deformed at the temperature of 340 °C and the strain rate of 1 s-1, the grains are obviously elongated, only a few fine DRX grains are found, as shown in Fig. 10(d). This indicates that the deformation mechanism in this region is mainly dominated by DRV. With increasing temperature and decreasing strain rate (Fig. 10(e)), numerous fine DRX grains are observed along the boundaries of the elongated grains. When deformed at 460 °C and 0.1 s-1 (Fig. 10(f)), the sample is fully recrystallized with coarse equiaxed grains. These observations suggest that DRX becomes the dominant deformation mechanism in Domain I and Domain II. It is well known that DRX is a beneficial process during hot deformation since it provides stable flow and ideal workability by simultaneous softening and reconstituting the microstructure [11,31]. Based on the observation of the deformed microstructures and the above-mentioned analysis, it is concluded that the established processing map is effective for the 2050 Al-Li alloy.
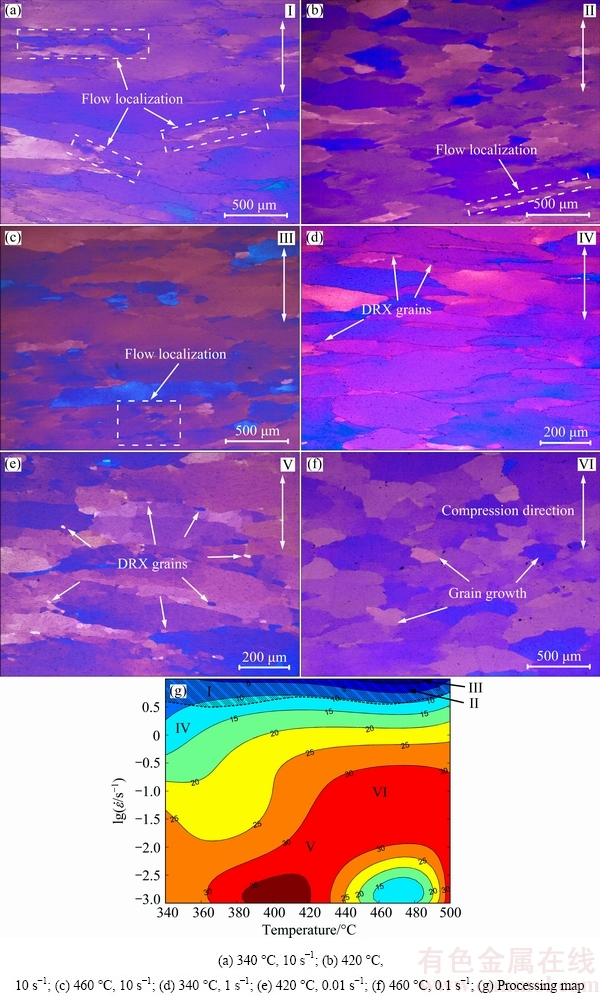
Fig. 10 OM images of 2050 Al-Li alloy under deferent compression conditions and its processing map
4 Conclusions
1) The flow behavior of 2050 Al-Li alloy was investigated by means of hot compression tests over a temperature range of 340-500 °C and strain rate range of 0.001-10 s-1. The true stress-strain curves were corrected for friction and temperature difference. Based on the corrected flow curves and dynamic material model, the processing map was conducted subsequently. Moreover, microstructures of the specimen deformed at specific process parameters were observed and analyzed.
2) Friction between specimen and die causes an increase in flow stress, and the difference is more obvious at higher strain levels. The increase or decrease in sample temperature is caused by adiabatic heating or heat dissipation during hot compression, which in turn leads to flow softening or hardening.
3) According to the processing map, the optimum processing parameters are obtained in temperature range of 370-430 °C and strain rate range of 0.01-0.001 s-1, and in temperature range of 440-500 °C and strain rate range of 0.3-0.01 s-1; the flow instability region is found at high strain rate of 3-10 s-1 in the entire temperature range.
4) Based on the microstructural observation, the deformation mechanisms of 2050 Al-Li alloy in the stable domains include DRV and DRX, whereas the alloy exhibits flow localization in the instability region.
References
[1] CHILL M J, CHELLMAN D J, BALMUTH E S, PHILBROOK M, SMITH K P, CHO A, NIEDZINSKI M, MUZZOLINI R, FEIGER J. Evolution of AA2050-T87 Al-Li alloy crack turning bahavior [J]. Materials Science Forum, 2006, 519-521: 1323-1328.
[2] PRASAD N E, GOKHALE A A, WANHILL R J H. Aluminum- lithium alloys [M]. Boston: Elsevier, 2014: 27-57, 187-219.
[3] CAVALIERE P. Hot and warm forming of 2618 aluminium alloy [J]. Journal of Light Metals, 2002, 2: 247-252.
[4] ZHANG Jing-qi, DI Hong-shuang, WANG Xiao-yu, CAO Yu, ZHANG Jie-cen, MA Tian-jun. Constitutive analysis of the hot deformation behavior of Fe-23Mn-2Al-0.2C twinning induced plasticity steel in consideration of strain [J]. Materials & Design, 2013, 44: 354-364.
[5] GAO Z Y, GRANDHI R V. Microstructure optimization in design of forging processes [J]. International Journal of Machine Tools and Manufacture, 2000, 40: 691-711.
[6] BRIOTTET L, JONAS J J, MONTHEILLET F. A mechanical interpretation of the activation energy of high temperature deformation in two phase materials [J]. Acta Materialia, 1996, 44: 1665-1672.
[7] BAY N. Friction stress and normal stress in bulk metal-forming processes [J]. Journal of Mechanical Working Technology, 1987, 14: 203-223.
[8] GHOSH S K. Tribology in metalworking: Friction, lubrication and wear [J]. Journal of Mechanical Working Technology, 1987, 14: 242-245.
[9] PANTLEON W, FEANCKE D, KLIMANEK P. Modeling adiabatic heating during high-speed deformation [J]. Computational Materials Science, 1996, 7: 75-81.
[10] XU Guo-fu, PENG Xiao-yan, LIANG Xiao-peng, LI Xu, YIN Zhi-min. Constitutive relationship for high temperature deformation of Al-3Cu-0.5Sc alloy [J]. Transactions of Nonferrous Metals Society of China, 2013, 23: 1549-1555.
[11] LI Bo, PAN Qing-lin, YIN Zhi-min. Characterization of hot deformation behavior of as-homogenized Al-Cu-Li-Sc-Zr alloy using processing maps [J]. Materials Science and Engineering A, 2014, 614: 199-206.
[12] HU H E, WANG Xin-yun, DENG Lei. High temperature deformation behavior and optimal hot processing parameters of Al-Si eutectic alloy [J]. Materials Science and Engineering A, 2013, 576: 45-51.
[13] SLOOFF F A, DZWONCZYK J S, ZHOU J, DUSZCZYK J, KATGERMAN L. Hot workability analysis of extruded AZ magnesium alloys with processing maps [J]. Materials Science and Engineering A, 2010, 527: 735-744.
[14] ANBUSELVEN S, RAMANATHAN S. Hot deformation and processing maps of extruded ZE41A magnesium alloy [J]. Materials & Design, 2010, 31: 2319-2323.
[15] MA Xiong, ZENG Wei-dong, WANG Kai-xuan, LAI Yun-jin, ZHOU Yi-gang. The investigation on the unstable flow behavior of Ti17 alloy in α+β phase field using processing map [J]. Materials Science and Engineering A, 2012, 550: 131-137.
[16] ZHANG W, LIU Y, LI H Z, LI Z, WANG H, LIU B. Constitutive modeling and processing map for elevated temperature flow behaviors of a powder metallurgy titanium aluminide alloy [J]. Journal of Materials Processing Technology, 2009, 209: 5363-5370.
[17] PRASD Y, SESHACHARULU T. Processing maps for hot working of titanium alloys [J]. Materials Science and Engineering A, 1998, 243: 82-88.
[18] KARTIKA I, LI Y P, MATSUMOTO H, CHIBA A. Constructing processing maps for hot working of Co-Ni-Cr-Mo superalloy [J]. Materials Transactions, 2009, 50: 2277-2284.
[19] ROEBUCK B, LORD J D, BROOKS M, LOVEDAY M S, SELLARS C M, EVANS R W. Measurement of flow stress in hot axisymmetric compression tests [J]. Materials at High Temperatures, 2006, 23: 59-83.
[20] EBRAHIMI R, NAJAFIZADEH A. A new method for evaluation of friction in bulk metal forming [J]. Journal of Materials Processing Technology, 2004, 152: 136-143.
[21] LI Y P, ONODERA E, MATSUMOTO H, CHIBA A. Correcting the stress-strain curve in hot compression process to high strain level [J]. Metallurgical and Materials Transactions A, 2009, 40: 982-990.
[22] GOETZ R, SEMIATIN S. The adiabatic correction factor for deformation heating during the uniaxial compression test [J]. Journal of Materials Engineering and Performance, 2001, 10: 710-717.
[23] LI L, ZHOU J, DUSZCZYK J. Determination of a constitutive relationship for AZ31B magnesium alloy and validation through comparison between simulated and real extrusion [J]. Journal of Materials Processing Technology, 2006, 172: 372-380.
[24] LI Y P, MATSUMOTO H, CHIBA A. Correcting the stress-strain curve in the stroke-rate controlling forging process [J]. Metallurgical and Materials Transactions A, 2009, 40: 1203-1209.
[25] KAPOOR R, SINGH J B, CHAKREVATTY J K. High strain rate behavior of ultrafine-grained Al-1.5Mg [J]. Materials Science and Engineering A, 2008, 496: 308-315.
[26] PRASAD Y. Processing maps: A status report [J]. Journal of Materials Engineering and Performance, 2003, 12: 638-645.
[27] PRASAD Y V R K. Author’s reply: Dynamic materials model: Basis and principles [J]. Metallurgical and Materials Transactions A, 1996, 27: 235-236.
[28] ZHANG Tian, TAO Yao-rui, WANG Xue-yin. Constitutive behavior, microstructural evolution and processing map of extruded Al-1.1Mn-0.3Mg-0.25RE alloy during hot compression [J]. Transactions of Nonferrous Metals Society of China, 2014, 24: 1337-1345.
[29] JI Ya-qi, QU Shun-de, HAN Wei-xin. Hot deformation and processing map of GH3535 superalloy [J]. Transactions of Nonferrous Metals Society of China, 2015, 25: 88-94.
[30] MA Xiong, ZENG Wei-dong, XU Bin, SUN Yu, XUE Chen, HAN Yuan-fei. Characterization of the hot deformation behavior of a Ti-22Al-25Nb alloy using processing maps based on the Murty criterion [J]. Intermetallics, 2012, 20: 1-7.
[31] WANG Ming-liang, JIN Pei-peng, WANG Jin-hui, HAN Li. Hot deformation behavior of as-quenched 7005 aluminum alloy [J]. Transactions of Nonferrous Metals Society of China, 2014, 24: 2796-2804.
朱瑞华1,刘 晴1,李劲风1,陈永来2,张绪虎2,郑子樵1
1. 中南大学 材料科学与工程学院,长沙 410083;
2. 航天材料及工艺研究所,北京 100076
摘 要:采用热压缩实验研究2050 Al-Li合金在变形温度为340~500 °C、应变速率为0.001~10 s-1范围内的热变形行为。分析摩擦及温度变化对流变应力的影响,并对流变曲线进行修正处理;基于动态材料模型及修正后的真应力数据,获得真应变为0.5条件下合金的加工图;利用金相显微镜对压缩试样显微组织变化进行观察。结果表明,在热变形过程中材料的摩擦及温度变化对流变应力有显著影响;合金合适加工区域位于变形温度为370~430 °C、应变速率为0.01~0.001 s-1区域,以及变形温度为440~500 °C、应变速率为0.3~0.01 s-1区域内;失稳区位于高应变速率下(3~10 s-1)所有温度范围内;动态回复和动态再结晶是2050 Al-Li合金在稳定加工区域内主要变形机理,而在失稳区合金变形机理主要表现为流变集中。
关键词:2050铝锂合金;加工图;动态回复;动态再结晶;流变集中
(Edited by Wei-ping CHEN)
Foundation item: Project (2013JSJJ0001) supported by the Teachers’ Research Fund, Central South University, China; Project supported by the Nonferrous Metal Oriented Advanced Structural Materials and Manufacturing Cooperative Innovation Center, China
Corresponding author: Jin-feng LI; Tel: +86-731-88830270; Fax: +86-731-88876692; E-mail: lijinfeng@ csu.edu.cn
DOI: 10.1016/S1003-6326(18)64674-6

