
J. Cent. South Univ. (2018) 25: 251-258
DOI: https://doi.org/10.1007/s11771-018-3734-7

Identification of variety of rice and determination of content of each rice in mixtures of two rices by nonlinear chemical analysis
CHEN Chun-nan(�´��)1, XU Tian-shu(������)1, ZHONG Jun-hui(�ӿ���)2, WANG Zhi-pei(��־��)2,
LUO Xue-lei(��ѧ��)2, GUO Fang-qiu(������)1, ZHANG Tai-ming(��̩��)1, DU Juan(�ž�)1,
YANG Chun-hua(������)3, ZHU Hong-qiu(�����)3, HUANG Jian(�Ƽ�)1, DENG Fei-yue(�˷�Ծ)1
1. College of Chemistry and Chemical Engineering, Central South University, Changsha 410083, China;
2. China Resources Snow Breweries Co. Ltd., Beijing 100005, China;
3. College of Information Engineering, Central South University, Changsha 410083, China
 Central South University Press and Springer-Verlag GmbH Germany,part of Springer Nature 2018
Abstract: Fingerprints of two varieties of rice and their mixtures were investigated by a nonlinear chemical reaction system consisting of rice components, sodium bromate, manganese sulfate, sulfuric acid and acetone. The variety of rice was identified by the visual characteristic of fingerprint and system similarity pattern recognition, and the content of each variety of rice in the mixture was determined by the quantitative information of fingerprint. The results show that nonlinear chemical analysis may be used to exactly identify the variety of pure rice and to accurately determine the content of each variety of rice in the mixture, indicating the method is simple and convenient.
Key words: nonlinear chemical analysis; binary mixture; variety identification; content determination; rice
Cite this article as: CHEN Chun-nan, XU Tian-shu, ZHONG Jun-hui, WANG Zhi-pei, LUO Xue-lei, GUO Fang-qiu, ZHANG Tai-ming, DU Juan, YANG Chun-hua, ZHU Hong-qiu, HUANG Jian, DENG Fei-yue. Identification of variety of rice and determination of content of each rice in mixtures of two rices by nonlinear chemical analysis [J]. Journal of Central South University, 2018, 25(2): 251�C258. DOI: https://doi.org/10.1007/ s11771-018-3734-7.
1 Introduction
In China, rice resources are abundant, the starch content of rice is as high as 75% to 82%, the anhydrous leaching rate is as high as 90% to 93%, the content of bubble protein is higher, the fat content is lower, and the content of polyphenols is almost zero. Therefore, Chinese rice is an auxiliary material which is widely used in beer brewing. By replacing part of malt with rice, not only the leaching rate of wort can be increased, but also the beer flavor may be improved and the color intensity may be reduced. Because of people��s preference for light beer flavor and the mature production technology as well as intense market competition, the use percentage of rice as auxiliary material is increasing. The rice dosage is generally 1/5 to 1/3 of the raw material in Chinese beer production, and it is even up to about 1/2 in the external enzyme- saccharification technique. In recent years, the quality of beer, especially the flavor quality has become the hotspot issue in the current wine industry. The rice is one of the important factors causing beer to produce aging flavor. The influence of rice variety on beer brewing was studied by American AB Beer Company. The results showed that the variety of rice obviously influences the leaching rate, viscosity, filtration rate, fermentability of wort, etc, so as to affect the flavor of beer. Because of the fact that the beers brewed with different varieties of rice have different favors, the selection of rice, the improvement of favor quality and increase of shelf life of beer have been the effort directions of beer-makers and flavor chemists.
Based on the principle of nonlinear chemical reaction and the achievements in its application research [1�C6], ZHANG et al [7�C12] systematically investigated and put forward the nonlinear chemical fingerprint (NCF) technique, and promoted the development of further research and application of this fingerprint technique [13�C16], laying the foundation of theory and technology for the research and application of nonlinear chemical analysis. Research about food and the traditional Chinese medicine are widely analyzed, and most of them are about single component analysis [17�C22], but component cluster analysis is rarely mentioned [16]. For example, whether expensive soy sauce is adulterated by other cheap soy sauce or light soy sauce; whether goats�� milk is adulterated by cows�� and mares�� milks; how much are the adulteration percentages? However, the component analysis such as chromatographic fingerprint is often used to determine some specific substances as discriminating components, and the analysis of discriminating component is incapable to solve this problems. Therefore, it is urgent to build a new method to identify whether a sample is adulterated or to determine the content of impurity as mixture by a new fingerprint which not only reflects the holistic information of sample component cluster but also contains the quantitative information of relevant component sub-clusters. In this work, a nonlinear chemical analytical method for identifying the variety of rice and determining the content of each rice in the binary mixture consisting of two varieties of rice will be introduced.
2 Experimental
2.1 Materials and reagents
The reagent solutions such as sulphuric acid (1.00 mol/L), acetone (1.00 mol/L), sodium bromate (0.800 mol/L) and manganese sulfate (0.0800 mol/L) were prepared with analytical grade reagents, and the experimental water was double- distilled.
The rice samples LongJiang Rice 31 and KongYu Rice 131 were provided by China Resources Snow Breweries Co. Ltd.
2.2 Main apparatus
Apparatus NCF analyzer (Model MZ-1B) was used, which was manufactured by Hunan Shangtai Ltd. for Science & Technology of Measurement & Control, Xiangtan, China. Magnetic stirring-heat collector type thermostat heating water bath (Model DF-101S) was used, which was manufactured by Yuhua Instrument Co., Ltd, Gong Yi, China. And vacuum drying oven (Model DZ-1BC) was used, which was manufactured by Test Instrument Co., Ltd, Tianjin, China.
2.3 Experimental method
2.3.1 Sample preparation
The rice samples were crushed and filtered through <149 ��m sieve, placed DZ-1BC vacuum drying oven for drying at 60 ��C for 6 h, packed in sealed bags and placed in a desiccator.
2.3.2 Method for determining NCF
An appropriate amount of rice sample powder, 25.00 mL of H2SO4 solution was accurately added to a test tube, and put it in the magnetic stirring-heat collector type thermostat heating water bath to hydrolyze at 82 ��C for 7 h. Then, 12.0 mL manganese sulfate solution, 5.0 mL acetone,15.0 mL of twice-distilled water and the sample solution which has completely been hydrolyzed were quantitatively transferred to the reactor. The reactor cover with an injection hole and electrodes was lidded, and the instrument was turned on. The thermostat bath temperature was adjusted to 40 ��C, the stir rate was adjusted to 850 r/min, and stir time was immediately monitored. After 5.0 min, 5.0 mL of NaBrO3 solution was injected into the reactor. And potential�Ctime curve (namely E�Ct curve) was immediately recorded until the emergence of constant potential.
2.3.3 Test of methods stability
The NCFs of Longjiang Rice 31 as sample were determined on day 1, day 2, day 8, day 15, day 30 and day 60, respectively. Taking the average values of characteristic parameters of determined fingerprints as references, the fingerprint system similarities were calculated. They were 0.9983, 0.9981, 0.9984, 0.9987, 0.9990 and 0.9989, respectively. The result shows that the method is of good stability.
2.3.4 Test of method reproducibility
The NCFs of Longjiang Rice 31 were obtained by 5 parallel determinations. Taking the average values of characteristic parameters of determined fingerprints as references, the fingerprint system similarities were calculated. They were 0.9991, 0.9987, 0.9983, 0.9993 and 0.9988, respectively. The result shows that the method is of good reproducibility.
3 Results and discussion
3.1 Basic characteristic information of NCF
NCF contains many visual information and quantifiable information, and the latter can also be called characteristic parameters. The visual information mainly includes inductive curve, undulatory curve, periodic wave shape and potential drift curve, etc. The quantifiable information mainly includes canyon potential E1, canyon time t1, peak top potential E2, peak top time t2, inductive time t3, undulatory start potential E4, undulatory end potential E5, undulatory end time t5, equilibrium potential E6, equilibrium time t6, undulatory amplitude ��E7, maximum undulatory amplitude ��E6, undulatory life t7, undulatory period ��0, wave number n1 and so on. The meanings of all characteristic parameters of NCF have been detailedly explained in the relevant literatures [13, 14]. Figure 1 shows some basic information of NCF of Kongyu Rice 131. Wherein, the parameter information plays an important role in the evaluation of system similarity.
3.2 Selection of method for similarity calculation and pattern recognition
Pattern recognition can be divided into coefficient and clustering pattern recognitions. However, coefficient pattern recognition is better than the latter because its evaluation is quantifiable [19]. In the previous basic research, several common methods of coefficient pattern recognition have been compared [10]. For example, correlation coefficient and included angle cosine are very insensitive to the characteristic difference between NCFs, therefore, they are not suitable for evaluating the similarity between NCFs; Euclidean distance could basically reflect the characteristic difference between NCFs, but sometimes, it can not correctly reflect the relative degree of characteristic difference; however, system similarity can best reflect the difference between the fingerprint characteristics, and may be used to identify samples quickly, easily and accurately by combining with the visual information. Therefore, the system similarity will be used as a coefficient recognition pattern in this work, and its computational model is as follows:
 (1)
(1)
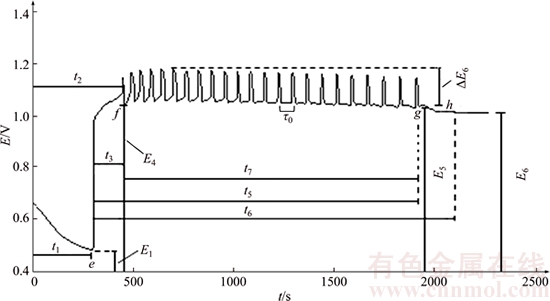
Figure 1 NCF of Kongyu Rice 131 and its part of characteristic information (e�Cf: Inductive curve; f�Cg: Undulatory curve; g�Ch: Potential drift curve; e: start point of nonlinear chemical reaction; h: end point of nonlinear chemical reaction)
The physical meanings of all symbols in Eq. (1) have been explained detailedly in Ref. [10], and here, they are repeated no longer.
3.3 Effect of determining dosage of rice on NCF
Because of its dynamical property, NCF is influenced by sample components and their concentrations whose changes will change the visual characteristic of fingerprint and its parameter information [9, 10]. With a constant volume of reaction solution, the concentrations of dissolved components of rice increase with the determining dosage of rice in the reaction solution. The NCF is not only very sensitive to the changes in rice components, but also influenced by the content changes of the same components in the rice. In other words, the content changes of the same components can cause the change of parameter information of NCF, even lead to the difference in the visual characteristic shape. Therefore, if we want to get a complete fingerprint with abundant information and good characteristic, we must select a suitable sample dosage. If the fingerprint contains abundant information and the time spent in determining it is the shortest, the relevant determining dosage is optimal. The results to determine the fingerprints of Longjiang Rice 31 and Kongyu Rice 131 show that the optimal determining dosage of rice is about 0.700 g.
3.4 Reproducibility and characteristic of NCF of rice
NCFs of Longjiang Rice 31 and Kongyu Rice 131 are shown in Fig. 2. Both the NCFs of two varieties of rice are of very good reproducibility and characteristic. Because of similar species, their NCFs have similar visual characteristics so as to be obviously different from those of other samples [10]. In addition, although the fingerprints of two varieties of rice have similar visual characteristics, their characteristic parameters, especially wave number, undulatory life and undulatory end time are obviously different. Therefore, besides identifying them accurately by the system similarity pattern recognition [10], the two varieties of rice can also be identified quickly and conveniently according to the obvious differences in the characteristic parameters. For example, the wave numbers of NCFs of Kongyu Rice 131 and Longjiang Rice 31 are about 23 and 28, respectively, the undulatory lifes of NCFs are about 1491 s and 1878 s, respectively, and the undulatory end time are about 1932 s and 2288 s, respectively. The two varieties of rice can be identified by using the difference of any one among the three characteristic parameters. In addition, the system similarities between NCFs of Kongyu Rice 131 and Longjiang Rice 31 were calculated by using the characteristic parameters of NCFs, and the values are less than 0.8537. However, the system similarities between NCFs of the same variety of rice are higher than 0.9799. That is, the system similarity between NCFs of the same variety of rice is obviously different from that of different varieties of rice. The average value of 0.8537 and 0.9797 is 0.9168, and the value can be used as a criterion to identify the varieties of Kongyu Rice 131 and Longjiang Rice 31. In other words, when the system similarity��0.9168, the matched samples are the same rice, however, when the similarity< 0.9168, they are not the same rice. The accuracy to identify Kongyu Rice 131 and Longjiang Rice 31 by system similarity pattern is very high due to the good characteristic of NCF. In summary, both the visual characteristic of fingerprint and system similarity pattern can be used to identify the variety of Kongyu Rice 131 and Longjiang Rice 31.
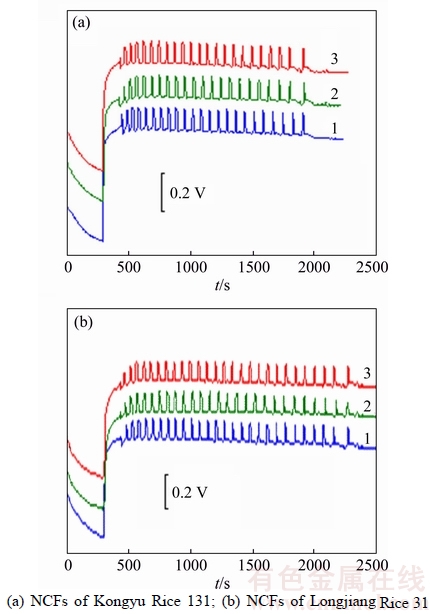
Figure 2 Reproducibility and characteristic difference:(Lines 1�C3 denote parallel determinations)
The good reproducibility of NCF also provides a necessary condition for determining the content of each variety of rice in the binary mixture.
3.5 Determination of content of each variety of rice in binary mixture
The binary rice mixtures consisted of different proportions of Longjiang Rice 31 and Kongyu Rice 131. The mixtures were used to investigate the influence of content of each variety of rice in the mixtures on the characteristic information of NCF, and the results are shown in Figure 3. As seen, the content of each variety of rice in the mixtures has a regular influence on the quantifiable information in the NCF, and both the undulatory end time and undulatory life have linear relationship with the content of each variety of rice in the mixture. For example, both the undulatory end time and undulatory life have good linear relationships with the content of Longjiang Rice 31 (Figure 4).
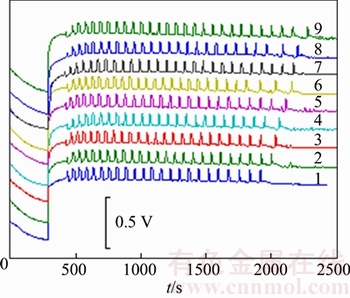
Figure 3 Influence of content of each variety of rice in binary mixture consisting of Kongyu Rice 131 and Longjiang Rice 31 on characteristic information of NCF (Content of Longjiang Rice 31, 1�C9: 0%, 20%, 30%, 40%, 50%, 60%, 70%, 80%, 100%; Content of Kongyu Rice 131, 1�C9: 100%, 80%, 70%, 60%, 50%, 40%, 30%, 20%, 0%)
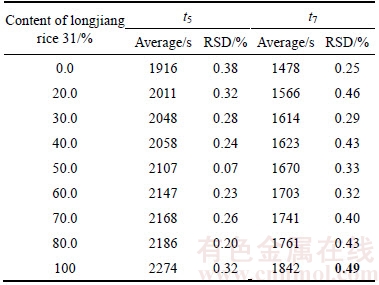
The average values of the undulatory end times and undulatory lifes obtained by 3 parallel determinations are shown in Table 1. By fitting the content of Longjiang Rice 31 in the rice mixture with the average values of undulatory end time t5 and undulatory life t7, respectively, the relevant linear regression equations are obtained. The equations are t5=338.7x+1932 and t7=351.2x+1491, respectively; the correlation coefficients are  0.9905 and
 respectively. By substituting undulatory end time or undulatory life obtained by determining the NCF of rice mixture into the relevant regression equation, the content of each variety of rice in the mixture can be calculated. The relative standard deviations to determin the quantitative information is less than 0.49% (Table 1). This also shows that the quantitative information in the NCFs of rice mixture consisting of Longjiang Rice 31 and Kongyu Rice 131 has good reproducibility, which is a necessary condition for accurately determining the content of each variety of rice in the mixture.
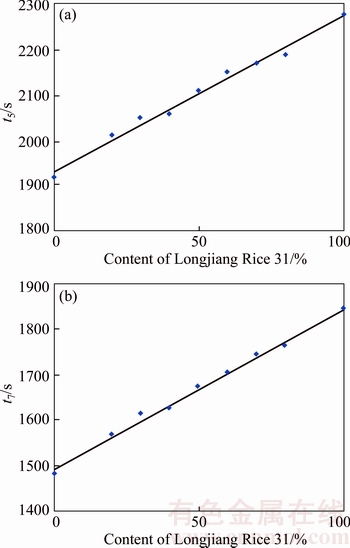
Figure 4 Linear relationship between undulatory end time (a) and undulatory life (b) in rice mixture NCF and Longjiang Rice 31
The quantitative determination accuracy was tested by using the standards of binary mixtures consisting of Kongyu Rice 131 and Longjiang Rice 31 as verification samples. Among the samples, the contents of Longjiang Rice 31 are 10.0%, 15.0%, 85.0% and 90.0%, respectively. By substituting the undulatory end time or undulatory life in the NCF of a verification sample into t5=338.7x+1932 or t7= 351.2x+1491, the content (x1) of Longjiang Rice 31 can be calculated, that of Kongyu Rice 131 is x2, and x2=100%-x1. The measured results of contents of Longjiang Rice 31 and Kongyu Rice 131 are shown in Table 2. The results show that the linear relationship between the content of a variety of rice in the binary mixture and the undulatory end time or undulatory life can be used to quantitatively determine the content of rice, and the mean absolute values of relative deviations of determination values ��5.11%. The accuracy is satisfactory for the quantitative determination by an instrument.
Table 1 Influences of Longjiang Rice 31 content in rice mixture on average values of undulatory end time and undulatory life
3.6 Sensitivity and detection limit of method
Under the selected detection conditions of NCF, the sensitivity S and detection limit D to determine the content of Longjiang Rice 31 in the binary mixture have been investigated. By taking the change (��t0) of measured undulatory end time as the useful response signal R (that is, R=��t0=t8- t5=338.7x, t8 is the undulatory end time of mixtures), and the maximum value of response signal fluctuation caused by random factors as the noise N, the sensitivity and detection limit to determine the content of Longjiang Rice 31 were calculated according to the definition that detection limit is the amount of measured component whose response signal equals 3 times of the noise. The calculation results are shown in Table 3. The data show that the sensitivity is 338 s, that is, the difference between the undulatory end time in the NCF of pure Longjiang Rice 31 and that of pure Kongyu Rice 131 is 338 s; the detection limit is 2.66%, that is, when the content of Longjiang Rice 31��2.66%, the determination results have high confidence levels. Customarily, when the content of Longjiang Rice 31 mixed with Kongyu Rice 131 is less than 5%, the mixed rice may be considered as pure Kongyu Rice 131. Therefore, the detection limit can meet the requirement of practical application.
Table 2 Accuracy to determine content of each variety of rice in binary mixture using linear relationship between dopant amount and undulatory end time or undulatory life
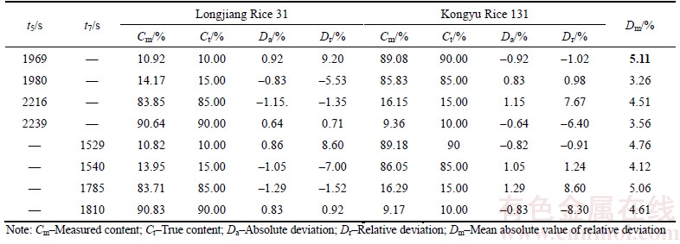
Table 3 Sensitivity and detection limit to determine content of Longjiang Rice 31 rice in binary mixture (4 parallel determinations)

4 Conclusions
NCFs of two varieties of rice and their mixtures were investigated by a nonlinear chemical reaction system consisting of rice components, sodium bromate, manganese sulfate, sulfuric acid and acetone. The variety of rice was identified by the visual characteristic of fingerprint and the system similarity pattern. Both the undulatory end time and undulatory life in the NCFs of binary mixtures consisting of Kongyu Rice 131 and Longjiang Rice 31 have a linear relationship with the content of each variety of rice, and their regression equations can be fitted by the quantitative information and the content of each variety of rice. The contents of Longjiang Rice 31 and Kongyu Rice 131 in the binary mixture can be predicted by the regression equations. The variation coefficient of quantitative information determined by the method is less than 0.49%, the mean absolute value of relative deviation to determine the content of each variety of rice is less than 5.11%, and the sensitivity and detection limit of method are 338 s and 2.66%, respectively. The requirements of actual determination can be met. The method has provided a good analytic means for identifying whether to use high quality rice in beer production and to use what variety of rice, as well as determining the content of each variety of rice in the used mixed rice. It will play an important role in ensuring beer quality, preventing the use of inapposite rice, and quantitatively evaluating the quality of mixed rice.
References
[1] FARAGE V J, JANJIC D. Calorimeteric study of the BrO3�C/Ce4+/cyclohexanone and BrO3�C/Ce4+/cyclopentapne oscillating systems [J]. Reaction Kinetics and Calalysis Letters, 1980, 15(4): 487�C491.
[2] FIELD R T, KOROS E, NOYES R M. Oscillation in chemical system II. Thorough analysis of temporal oscillation in the bromate-cerium-malonic acid system [J]. Journal of the American Chemical Society, 1972, 94(25): 8649�C8664.
[3] FIELD R J, SCHNEIDER F W. Oscillating chemical reaction and nonlinear dynamics [J]. Journal of Chemical Education, 1989, 66(3): 195�C204.
[4] TAYLOR A F. Mechanism and phenomenology of an oscillating chemical reaction [J]. Chaos, 2002, 27(4): 307�C325.
[5] SRIVASTAVA R, SRIVASTAVA P K, CHATTOPADHYAY J. Chaos in a chemical system [J]. The European Physical Journal Special Topics, 2013, 222(3, 4): 777�C783.
[6] ZHANG Tai-ming, LIANG Yi-zeng, Yuan Bin, DING Feng, ZHANG Ya-peng, WEI Man-qiong, CHEN Xu. Determining method and conditional factors of electrochemical fingerprint of Chinese traditional medicine [J]. Chinese Science Bulletin, 2007, 52(16): 2190�C2202.
[7] ZHANG Tai-ming, LIANG Yi-zeng, Yuan Bin, DING Feng, ZHANG Ya-peng, CHEN Wen-yan. Principle, traits and functions of electrochemical fingerprint of Chinese traditional medicine [J]. Chinese Science Bulletin, 2007, 52(20): 2753�C2765.
[8] FANG Xuan-qi, ZHANG Tai-ming, ZHAO Zhe, XIANG Feng-qin, LIANG Yi-zeng, WANG Mei, ZHU Rong, CHEN Su, QIAO Jun-xi. Application of nonlinear chemical fingerprint in identification, evaluation and clinical use of Glycyrrhiza [J]. Chinese Science Bulletin, 2010, 55(26): 2937�C2944.
[9] ZHANG Tai-ming, ZHAO Zhe, FANG Xuan-qi, QIAO Jun-xi, XIANG Feng-qin, ZHU Rong, LIANG Yi-zeng, DING Feng. Determining method, conditional factors, traits, and applications of nonlinear chemical fingerprint by using dissipative components in samples [J]. Science China Chemistry, 2012, 55(2): 285�C303.
[10] ZHANG Tai-ming, ZHAO Zhe, FANG Xuan-qi, QIAO Jun-xi, XIANG Feng-qin, ZHU Rong, LIANG Yi-zeng, DING Feng. Principle of nonlinear chemical fingerprint by using dissipative components in samples as well as calculation and evaluation of similarity [J]. Science China Chemistry, 2012, 55(2): 304�C322.
[11] ZHANG Tai-ming, MAO Peng-fei, YANG Xiao-yan, DING Feng. MZ-1A type nonlinear chemical fingerprint intelligent analyzer [J]. China Instrumentation, 2010(6): 60�C62. (in Chinese)
[12] ZHOU Ju-feng, FANG Xuan-qi, ZHANG Tai-ming, ZHAO Zhe, ZHU Rong, XIANG Feng-qin, QIAO Jun-xi. Quantitative similarity assessment of non-linear chemical fingerprint of traditional Chinese medicine by similarity system theory [J]. Journal of Central South University of Technology, 2011, 18(2): 343�C352.
[13] CHENG Wang-xing, CHEN Jia, FANG Cheng-wu, WU De-ling. Study on electrochemical fingerprints of different Chrysanthemums by using B-Z oscillation system [J]. Chinese Chemical Letters, 2011, 22(6): 729�C732.
[14] ZHANG Juan, ZHONG Jun-hui, WANG Zhi-pei, LUO Xue-lei, FU Ting-fa, ZHANG Tai-ming, WANG Yan-na, GUO Sha-sha, WANG Er-dan, LU Li-li. Determination of alcohol content in beer by nonlinear chemical fingerprint technique [J]. Chinese Journal of Analytical Chemistry, 2014, 42(4): 559�C564. (in Chinese)
[15] LI Yong-ling, LI Cong, CHEN Wen, ZHANG Ming-xiao. Study on electrochemical fingerprints and identification of different varieties of rice and mouldy rice by B-Z oscillation reaction system [J]. Electroanalysis, 2013, 25(5): 1271�C1277.
[16] WANG Er-dan, LU Li-li, ZHANG Tai-ming, DONG Wen-bin, LU Hong-mei, LIANG Yi-zeng, XU Tian-shu, ZHANG Juan, CHEN Chun-nan. Nonlinear chemical analysis of throng component and simultaneous determining contents of cows�� and mares�� milks mixed with goats milk [J]. Chemical Journal of Chinese Universities, 2015, 36(6): 1052�C1060. (in Chinese)
[17] SCHMITZ G, FURROW S D. Bray�CLiebhafsky and non-catalysed Briggs�CRauscher oscillating reactions [J]. Russian Journal of Physical Chemistry A, 2016, 90(2): 271�C275.
[18] ZHAN Xue-hui, XU Guang-wei, LI Fei, LI Xiao-ru, ZHOU Sui-an, CAO Fen, LI Xia. Comparative analysis of volatile constituents between herbal pair flos lonicerae-caulis lonicerae and its single herbs [J]. Journal of Central South University of Technology, 2010, 17(4): 726-731.
[19] CAJKA T, RIDDELLOVA K, TOMANIOVA M, HAJSLOVA J. Recognition of beer brand based on multivariate analysis of volatile fingerprint [J]. Journal of Chromatography A, 2010, 1217(25): 4195�C4203.
[20] REN Jie, ZHANG Xiao-yan, GAO Jin-zhang, WU Yang. The application of oscillating chemical reactions to analytical determinations [J]. Central European Journal of Chemistry, 2013, 11(7): 1023�C1031.
[21] WANG Wei-ping, LIN Juan, ZHANG Liang-xiao, ZHANG Ming-yue, LIANG Yi-zeng. Chemical fingerprinting of Su-He-Xiang-Wan and attribution of major characteristic peaks for its quality control by GC-MS [J]. Journal of Central South University, 2013, 20(8): 2115�C2123.
[22] ZENG Qing-ling, CHEN Lu-lu, SONG Xian-yi, HU Gang, HU Lin. Determination of vitamin B6(pyridoxine hydrochloride) based on a novel BZ oscillating reaction system catalyzed by a macrocyclic complex [J]. Central European Journal of Chemistry, 2014, 12(3): 325�C331.
(Edited by FANG Jing-hua)
���ĵ���
�÷����Ի�ѧ��������������Ͳⶨ���ֵ��������ÿ�ֵ��ĺ���
ժҪ�����ô��׳ɷ֣������ơ������̡�����ͱ�ͪ��ɵķ����Ի�ѧ��ϵ�о����ִ����������ָ��ͼ�ס���ָ��ͼ��ֱ��������ϵͳ���ƶ�ģʽ����������࣬����ָ��ͼ�Ķ�����Ϣ�ⶨ���������ÿ�ִ���ĺ�������������������Ի�ѧ����������ȷ����������࣬�ⶨ���������ÿ�ִ��ĺ��������ҷdz���㡣
�ؼ��ʣ������Ի�ѧ��������Ԫ����������𣻺����ⶨ������
Foundation item: Project(61533021) supported by the National Natural Science Foundation of China
Received date: 2016-06-02; Accepted date: 2016-08-30
Corresponding author: GUO Fang-qiu, PhD, Professor; Tel: +86�C18932420259; E-mail: 1041023836@qq.com; ZHANG Tai-ming, PhD, Professor; Tel: +86�C13873172148; E-mail: taimingzhang@163.com

