J. Cent. South Univ. (2016) 23: 2867-2875
DOI: 10.1007/s11771-016-3350-3

Improved Sobel algorithm for defect detection of rail surfaces with enhanced efficiency and accuracy
SHI Tian(石甜), KONG Jian-yi(孔建益), WANG Xing-dong(王兴东), LIU Zhao(刘钊), ZHENG Guo(郑国)
School of Machinery and Automation, Wuhan University of Science and Technology, Wuhan 430081, China
 Central South University Press and Springer-Verlag Berlin Heidelberg 2016
Abstract: A more effective and accurate improved Sobel algorithm has been developed to detect surface defects on heavy rails. The proposed method can make up for the mere sensitivity to X and Y directions of the Sobel algorithm by adding six templates at different directions. Meanwhile, an experimental platform for detecting surface defects consisting of the bed-jig, image-forming system with CCD cameras and light sources, parallel computer system and cable system has been constructed. The detection results of the backfin defects show that the improved Sobel algorithm can achieve an accurate and efficient positioning with decreasing interference noises to the defect edge. It can also extract more precise features and characteristic parameters of the backfin defect. Furthermore, the BP neural network adopted for defects classification with the inputting characteristic parameters of improved Sobel algorithm can obtain the optimal training precision of 0.0095827 with 106 iterative steps and time of 3 s less than Sobel algorithm with 146 steps and 5 s. Finally, an enhanced identification rate of 10% for the defects is also confirmed after the Sobel algorithm is improved.
Key words: Sobel algorithm; surface defect; heavy rail; experimental platform; identification
1 Introduction
As an important research subject of nondestructive detections, real-time and accurate surface defects detection on heavy rails during the production process can possess an important engineering significance to improve the track quality and guarantee the safety of railway transportation. Until now, many methods have been developed to conduct the defects detection on rail surfaces. For example, ZHENG et al [1] have employed the eddy current technology in multi-frequency electromagnetic rail inspection. MUNOZ et al [2] have adopted the alternating current field measurement to detect the surface-breaking defects on rails at high inspection speeds. MI and XIE [3] have employed the infrared light technique to collect the surface images for detecting defects on rolled heavy rails. Meanwhile, visual observation and magnetic leakage techniques have also been used for defects detection [4-5]. However, visual observation with low production efficiency can cause the missing and false detections. The eddy current and infrared technologies can bring about low precision when detecting defects on complex rail surfaces with poor on-site production environment. Besides, some of the detection methods may be costly, complex and also the efficiency and accuracy cannot meet the requirements of real-time and online detection. Hence, it is still a big challenge to explore a facile, rapid and accurate approach for defects detection on heavy rail surfaces.
Surface defect detection with non-contact, real time, high precision and rapid speed based on machine vision technology has received great attentions in the past decade. The commonly used edge detection algorithms of relevancy mutual-proofread algorithm [6],Sobel [7-9], ghosal sub-pixel [10], roberts [11-12], Prewitt [13-14], Canny [15-16] and some other edge-adaptive algorithms [17-18] have gained growing popularity among researchers. Among these algorithms, Sobel algorithm can take a weighting of the impact of pixel position and reduce the fuzzy degree of edge. Meanwhile, Sobel algorithm can achieve better real-time computation of the edge image for its lower computational intensity than other algorithms [19].
However, Sobel operator is only sensitive to the horizontal and vertical edge detection, leading to an incomprehensive detection effect. Meanwhile, the shapes and shades of surface defects on heavy rails are diverse, making the detection more difficult owing to the unobvious changes of the local grays on defects. Besides,the increased interference factors including the image pixel response nonuniformity and the noises can also be found during the defects detection on heavy rails for their complicated production environment. In recent years, some improved Sobel algorithms have been seen. ZHAO and WAN [20] have proposed the edge detection with an improved speed by combining mathematical morphology and order morphology. But, the detection effect of the method is only obvious for large-size images. ZHAO et al [21] have connected the proper pixels by calculating the local maximum values of first derivative and the zero crossing point of second derivative of pixel to get the defect edge. The method is time-consuming despite of its effective noise suppression.
Hereon, on the basis of classical Sobel algorithm with double templates, an improved Sobel algorithm with eight directional templates has been developed for defects detection on heavy rail surfaces. The adding templates can help obtain more comprehensive edge information. It can also enhance the anti-noise performance and make edge detection more accurate and have high-speed. Meanwhile, a detecting experimental platform consisting of the bed-jig, image-forming system with CCD cameras and light sources, parallel computer system and cable system has been constructed to confirm the real-time and accurate detection effect with the improved Sobel algorithm.
2 Detection method
2.1 Sobel algorithm
As one of the edge detection algorithms based on the first-order differential, Sobel algorithm can calculate the gradient values of image brightness function. The gradient is a metric of the function change.And also, a defect image can be regarded as sampling point arrays of the continuous function of gray scale images. When judging the edge points of a defect image, the convolution computation of the operator templates in horizontal and vertical directions is firstly conducted to obtain the transverse and longitudinal gradient values of pixels. Figure 1(a) shows the operator templates with X and Y direction containing a set of 3×3 convolution masks. Then, the gradient value of each pixel (GN) can be obtained by the gradient combination with the inputting image in Eq. (1):
 (1)
(1)
where GX and GY respectively refer to the pixel gradient values with horizontal and vertical direction. Finally, the edge point can be distinguished by comparing GN with the setting gray threshold η. If GN≥η,the point can be judged as the edge point.Otherwise, it is not the edge point.
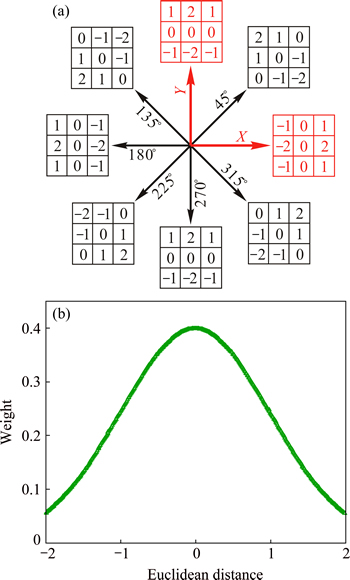
Fig. 1 Operator templates in 45°, 135°, 180°, 225°, 270°, 315°, horizontal and vertical directions (a) and effect of Euclidean distances on weights at detecting template points (b)
2.2 Improved Sobel algorithm
Sobel operator can be found with an inhibitory effect of the random noise in detecting images for its introduction of the weighted local average factor, which is also easy to implement with small amounts of calculations and high speed. But, the algorithm only uses the templates of horizontal and vertical directions to evaluate the edge points, leading to low positioning accuracy and edge detection rate. Based on the above two templates, an improved Sobel operator is developed by adding the templates with directions of 45°, 135°, 180°, 225°, 270° and 315°, as shown in Fig. 1(a). The adding templates will make the detecting edge information more comprehensive and the detecting precision more accurate. Besides, the adding templates can account for different distances between the operator templates and the center pixel, as shown in the following equations:
 (2)
(2)
ln g(x, y) =-ln2[d(x, y)2-u] (3)
k(x, y)=[g(x, y)] (4)
where the Euclidean distance between the detection template point (x, y) and the template center point (i, j) is set as d(x, y). g(x, y) is the weight at the detection template point (x, y) and the adjustment coefficient u is associated with the templates. [g(x, y)] as well as k(x, y) means the integer of g(x, y). Figure 1(b) shows the relationship between the Euclidean distance and the corresponding weights. Clearly, an inversely changing relationship can be found after adding the six templates, which can also be found in the research reported by ZHENG et al [22]. The algorithm makes the approximate convolution calculation by using each of the eight templates and the corresponding image data. And also, the biggest gray value can be taken as the pixel output among all the templates.
During the algorithm implementation process of the pixel output, the setting matrix {f(m, n)} represents the image to be detected, among which f(m, n) remarks the gray value of the pixel point (m, n). ν{f(m, n)} is setting as the 3 × 3 mask window with the center point of (m, n). ω(m, n) exhibits the gray output of the image at the point of (m, n) after the edge detection. Then, it can be described as follows:
Step 1: Conducting the convolution calculation between the templates u{t} (t=1, 2,…, 8) and ν{f(m, n)}. Then, storing the absolute value of calculation results in the corresponding array v{t} (t=1, 2,…, 8).
Step 2: Finding the maximum value of all the data in the corresponding array v{t}.
1) Initializing Max=v{0}, t =1.
2) If v{t}>Max, setting Max=v{t}.
3) If t<8, then t=t+1 and going to 2). If not, going to Step 3.
Step 3: Assigning Max to ω(m, n) as the output value of the pixel.
3 Experimental platform
3.1 Detection system
Figure 2 shows the experimental platform for detecting the surface defects on heavy rails, which mainly consists of the bed-jig, image-forming system with CCD cameras, lens, filters and light sources, parallel computer system and cable system. Imaging system is installed on the door-like scaffold of the platform. The rail surface images can be attained by sliding the door-like scaffold along the sliding rail. Then, the image signal can be processed and analyzed by being transmitted to the parallel computer system. Finally, the results of defect detection and recognition are obtained.
The selection model of linear CCD camera is Dalsa SG-01k40 and the lens is Computar M5018-MP with the focal length of 50 mm. Infrared-cut filter with the cut-off wavelength of 800 nm is selected to filter the incident lights of lens. Combined LED light source with special-shaped section is used to ensure the light of imaging region to be bright and uniform.
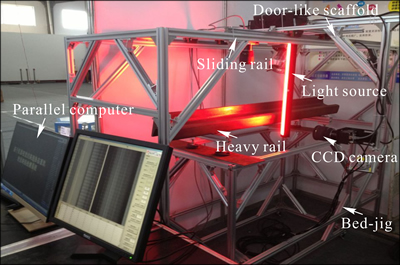
Fig. 2 Experimental platform for detecting surface defects on heavy rails
3.2 Calibration of pixel response nonuniformity of CCD camera
During the working process of the CCD camera, the energy exchange between photons and silicon atoms under a certain intensity of light irradiation can promote the electric charge packets output. Then, it can further convert to the currents or voltages to achieve the transformation of photoelectric information. Generally, a proportional relationship can be found between the pixel charge (C) and irradiance (I), as described in the following equation:
C=βI+δ (5)
where β denotes the relational parameter determined by the photoelectric conversion efficiency, electronic charge, Planck constant, incident light irradiation frequency, pixel area and exposure time; δ refers to the charge change caused by the interference noises. However, the pixel response nonuniformity of CCD cameras can take place when collecting the defects images due to the existence of the dark currents, quantum effect and external interference noises, which can bring about differences to the outputting gray value of each pixel in the case of the same irradiance. The outputting charge of a certain pixel M (Cm), which is also regarded as the observed target gray value of pixel M, can be expressed as
Cm=βmIm+δm (6)
In order to ensure the outputting gray value of each pixel to be in the range of allowable error, each pixel of CCD photoelectric response characteristics must be calibrated. By colligating Eq. (5) and Eq. (6), the calibrated gray scale of pixel M (*Cm) can be obtained in Eq. (7):
*Cm=β(Cm-δm)/βm+δ (7)
Before the experiment, the defects collector and light source must run for 20 min to make all the equipment into a thermal equilibrium state. Different irradiation intensities can be obtained by adjusting the supply currents of light source. The effect of the irradiances on the gray values of different pixels is recorded in Fig. 3(a). Obviously, different photoelectric responses of each pixel can be found, among which the gray values of different pixels are different under the same radiation intensity. And also, the gray value deviation confronts an increasing trend with the enhancement of irradiances. Taking the pixel 150 for example, the target gray value C150 can be expressed in Eq. (8) after the linear fitting treatment. Figure 3(b) shows the collected average gray values of each pixel with different irradiances. After the linear fitting of the collected data, a proportional relationship can be found between the gray values and irradiances in Fig. 3(c) and Eq. (9). When the irradiance is 60 nW・cm-2 (C150=140), the calibrated gray of pixel 150 (*C150) with the value of 150.734 can be calculated according to Eq. (7). Figure 3(d) exhibits the calibrated gray values of each pixel with different irradiances, among which a lower gray value deviation can be seen compared with uncalibrated situation in Fig. 3(b).
C150=2.012 I150+10.125 (8)
C=2.187I+9.563 (9)
Figure 4 shows the extractive backfin defect images before (Fig. 4(a)) and after (Fig. 4(b)) the calibration of pixel response nonuniformity of the CCD camera. Clearly, a more undistorted defect image with greatly reduced number of interference noises can be extracted after the calibration.
4 Results and discussion
4.1 Evaluation of extracted images
Extracting the qualified defect images is an important premise to conduct the defect detection. Image signal noise ratio (ISNR) can reflect the power spectrum ratio of the target signal making up in the background noise. It is also an important parameter to evaluate the extracted images. When R≥Q (Q=1.8, an empirical value in the analysis of defects image of heavy rails proposed by LIU [23]), a qualified defect image can be obtained. When evaluating the image quality, ISNR can be described as [24]
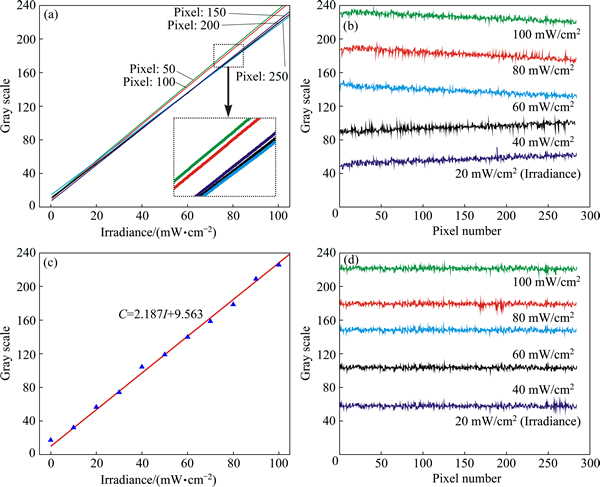
Fig. 3 Effect of irradiances on gray values with different pixels (a), collected average gray values of pixels with different irradiances (b), linear fitting relationship between gray values and irradiances (c) and calibrated gray values of each pixel with different irradiances (d)
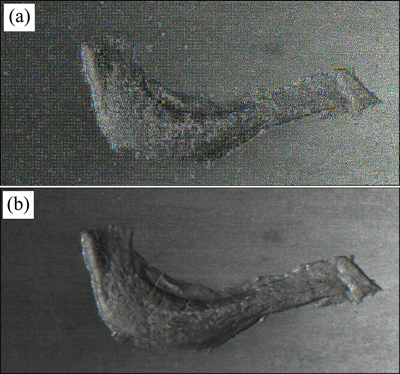
Fig. 4 Backfin defect images before (a) and after (b) calibration of pixel response nonuniformity
 (10)
(10)
where Mmax and Mmin are respectively the maximum and minimum gray values of the target defect image. Nmax and Nmin are respectively the maximum and minimum gray values of the background region. Figure 5 shows the gray histogram of the overall defect image, which is a statistical frequency of each grey value. Clearly, Mmax and Mmin respectively with 241 and 21 can be found in the gray histogram. Figure 6 shows gray images outside defect area collected for six times at different positions and Fig. 7 exhibits the gray scattergram in the background region outside the backfin area corresponding to different positions in Fig. 6. Finally, Nmax and Nmin respectively with 156 and 45 can be calculated after the average processing of all the six variation diagrams of the background gray. Then, the image signal noise ratio can be attained by R=(241-21)/(156-45)=1.982>1.8, demonstrating a qualified extracting defect image.
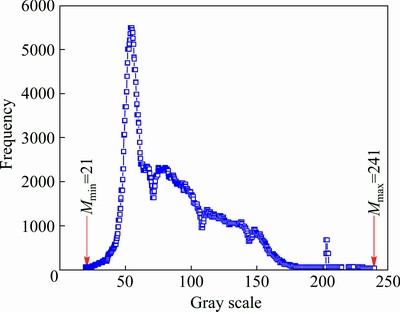
Fig. 5 Gray histogram with statistical frequency of every grey value of backfin defect images
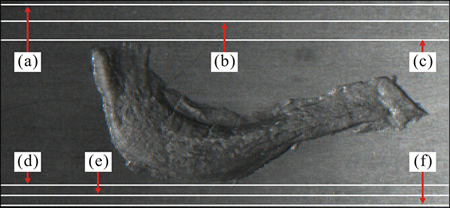
Fig. 6 Gray images outside defect area collected for six times at different positions
4.2 Edge detection result
Figures 8(a) and (b) respectively show the extraction of the defect edge images with Sobel algorithm and improved Sobel algorithm. Compared with Sobel algorithm, the defect edges extracted by the improved Sobel algorithm are more continuous and comprehensive, which can fully reflect the shape features of the backfin defect. The improved Sobel algorithm can easily obtain the accurate positioning to the defects and then extract more precise characteristic parameters of the backfin defect in the following step. Besides, the decreased noise points of the defect image are also found with the improved Sobel algorithm, suggesting that it can reduce the interference of defect edge judgement for its good ability of noise suppression.
The extraction of the features and characteristic parameters is an important basis for defect identification and classification. Through the binarization of the rectangular area and the segment of the backfin defect image, the extracted features and characteristic with 24 parameters can be obtained. The extracted parameters of the backfin defect with the Sobel algorithm and improved Sobel algorithm are respectively shown in Table 1 and 2.
4.3 Neural network classification
The classifier selection is very important to achieve an accurate and rapid classification of surface defects on heavy rails. BP neural network with an ability of self-organization and self-learning has been adopted in this work for defects classification. As shown in Fig. 9, the neural network has an input layer with 24 characteristic parameters, an output layer with 4 neurons and two hidden layers respectively with 15 and 4 neurons.
Forty groups of the backfin images are collected by the image acquisition system. After the image calibration, edge detection and features extraction of the defect images, 20 sets of eigenvalues are selected as the training samples and the others as the test samples. The maximum training frequency is set as 500, the learning step as 0.15 and the minimum mean square error as 0.01. Herein, Matlab is used to simulate BP neural network.
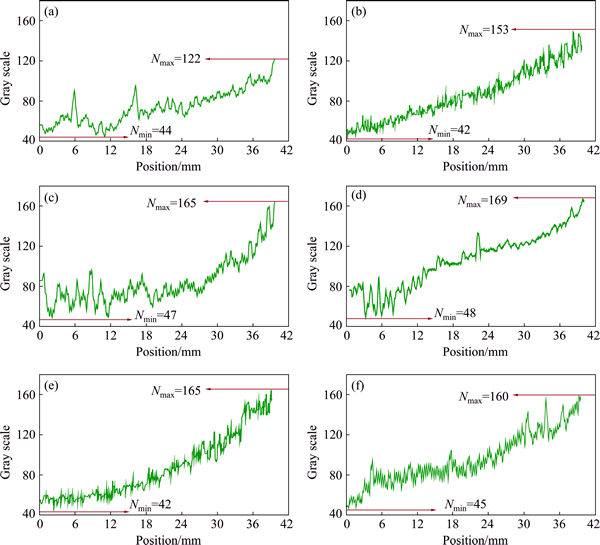
Fig. 7 Gray scattergrams corresponding to different positions in Fig. 6
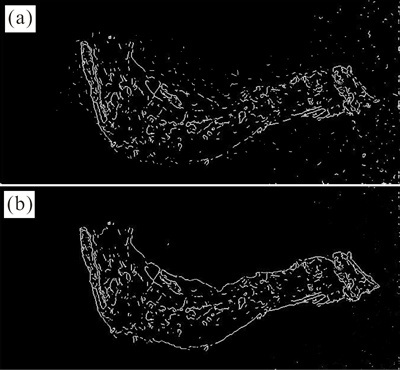
Fig. 8 Defect edge images with Sobel algorithm (a) and improved Sobel algorithm (b)
The system will be convergent and the iterative will end immediately when the iterations reach 500 or the minimum mean square error falls below 0.01.Figure 10(a) shows the neural network training curve for edge detection with the inputting characteristic parameters of Sobel algorithm. Clearly, its mean square error can achieve the optimal training precision of 0.0095478 (<0.01) with 146 iterations. While, the mean square error of the neural network training curve with the improved Sobel algorithm (Fig. 10(b)) can achieve the target precision of 0.01 only with 106 iterations. Meanwhile, the training results with the input of Sobel algorithm and the improved Sobel algorithm can respectively achieve the target precision with 5 s and 3 s. Obviously, the improved Sobel algorithm has better ability of noise suppression for edge extraction and its positioning accuracy for defects is much higher. Meanwhile, the improved Sobel algorithm can achieve the training accuracy with fewer iteration and less time for its extracting more accurate features, which can greatly improve the efficiency of the following classification.
Table 1 Features and characteristic parameters of backfin defect with Sobel algorithm
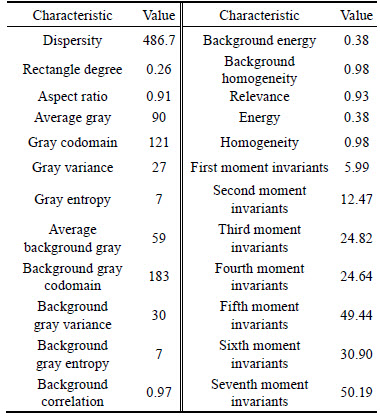
Table 2 Features and characteristic parameters of backfin defect with improved Sobel algorithm
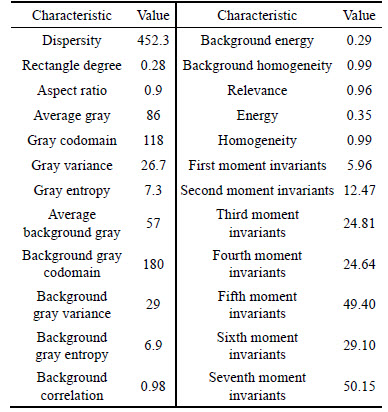
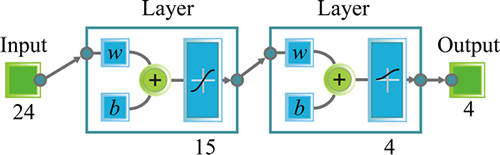
Fig. 9 BP neural network with input, output and hidden layers
4.4 Recognition accuracy analysis
The output data of 20 sets of the tested samples with the inputting characteristics of Sobel algorithm and the improved Sobel algorithm after being processed with BP neural network is shown in Table 3. The output value will be recognized as 1 if it is greater than 0.5, otherwise it will be recognized as 0. Figure 11 shows the target outputs and discrimination results of the backfin defects. Clearly, the correct distinguishing samples based on Sobel algorithm (Fig. 11(a)) and the improved algorithm (Fig.11(b)) are respectively 17 and 19 among the tested 20 samples. Accordingly, the improved Sobel algorithm has got an enhanced defect identification rate of 10% than Sobel algorithm. Based on the above analysis, the designed detecting platform combining the improved Sobel algorithm with adding templates can detect the surface defects on heavy rails with higher accuracy and efficiency as well as the higher identification rate of the defects.
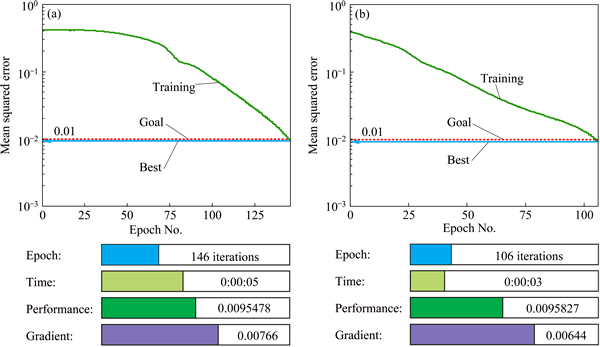
Fig. 10 Training curves for edge detection with inputting characteristic parameters of Sobel algorithm (a) and improved Sobel algorithm (b)
Table 3 Output and discrimination results with inputting characteristics of Sobel and improved Sobel algorithms
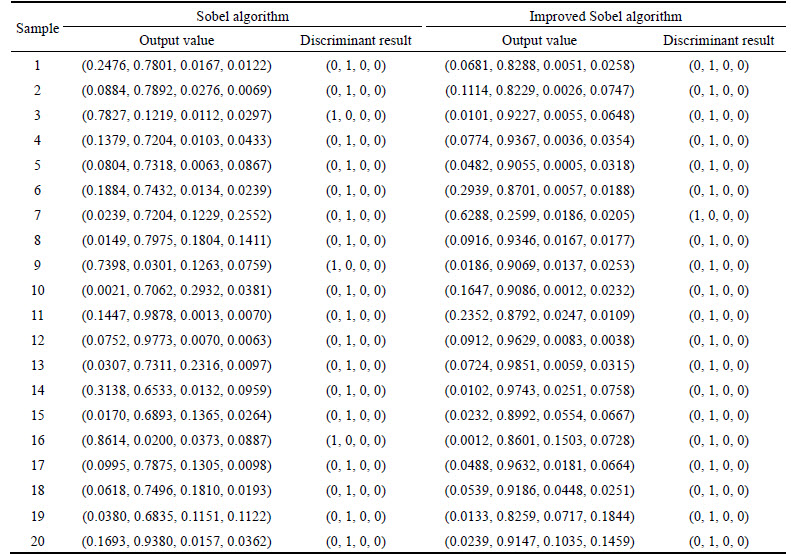
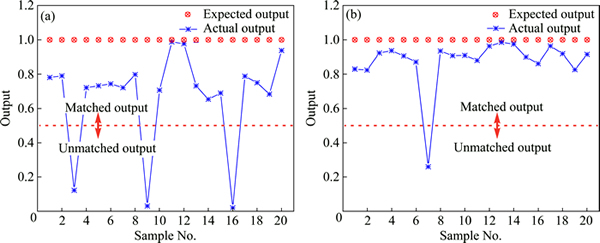
Fig. 11 Twenty sets of output data and discrimination results of BP neural network with inputting characteristics of Sobel algorithm (a) and improved Sobel algorithm (b)
5 Conclusions
1) An experimental platform for detecting surface defects on heavy rails has been designed with parallel computer system, imaging system, LED light sources, bracket structures and cable system. Meanwhile, the pixel response nonuniformity of CCD cameras has been calibrated to ensure the outputting gray values of the pixel being in the range of allowable error. After the calibration of the nonuniformity, a more undistorted defect image with greatly reduced interference noises can be extracted.
2) Based on the classical Sobel algorithm with X and Y directions, an improved Sobel algorithm with the adding templates at the directions of 45°, 135°, 180°, 225°, 270° and 315° has been developed for edge detection of the defects images. The improved algorithm can easily obtain the accurate positioning to the defect contour with complete edge information and then extract more precise 24 sets of characteristic parameters of the backfin defect.
3) After the BP neural network training of the defects samples, the defects classification with the inputting characteristic parameters of improved Sobel algorithm can obtain the target training precision with 106 iterative steps and time of 3 s less than the Sobel algorithm with 146 steps and 5 s. Besides, an improved identification rate of defects based on the improved Sobel algorithm can attain up to 10% compared with the Sobel algorithm.
References
[1] ZHENG Ran, LIU Ze, LU Ying-fei, ZHU Li-xiong, SUN Xiu-fang. Multi-frequency least squares demodulation method in electromagnetic rail inspection [C]//IEEE International Conference on Imaging Systems and Techniques. New York: IEEE Press, 2013, 363-365.
[2] MUNOZ J M C, MARQUEZ F P G, PAPAELIAS M. Railroad inspection based on ACFM employing a non-uniform B-spline approach [J]. Mechanical Systems and Signal Processing, 2013, 40(2): 605-617.
[3] MI Zeng-zhen, XIE Zhi-jiang. Theoretical and experimental research on the defects of hot rolled heavy rail [J]. Metalurgia International, 2012, 17(9): 221-225.
[4] KHODAYARI-ROSTAMABAD A, REILLY J P, NIKOLOVA N K, HARE J R, PASHA S. Machine learning techniques for the analysis of magnetic flux leakage images in pipeline inspection [J]. IEEE Transaction on Magnetic, 2009, 45(8): 3073-3084.
[5] LEI Hua-ming, TIAN Gui-yun. Broken wire detection in coated steel belts using the magnetic flux leakage method [J]. Insight, 2013, 55(3): 126-131.
[6] RAMOS H G, ROCHA T, KRAL J, PASADAS D, RIBEIRO A L. An SVM approach with electromagnetic methods to assess metal plate thickness [J]. Measurement, 2014, 54: 201-206.
[7] KHALID A R, PAILY R. FPGA implementation of high speed and low power architectures for image segmentation using Sobel operators [J]. Journal of Circuits Systems and Computers, 2012, 21(7): 1250050.1-1250050.14.
[8] CAI Jian-hua, HU Wei-wen. Feature extraction of gear fault signal based on Sobel operator and WHT [J]. Shock and Vibration, 2013, 20(3): 551-559.
[9] ABBASI T A, ABBASI M U. A novel FPGA-based architecture for Sobel edge detection operator [J]. Internatinal Journal of Electronics, 2007, 94(9): 889-896.
[10] WANG Zu-jin, HUANG Xiao-diao. Visual positioning of rectangular lead components based on Harris corners and Zernike moments [J]. Journal of Central South University, 2015, 22(7): 2586-2595.
[11] ZHANG Qi, YANG Hao, WEI Yu-guang. Selection of destination ports of inland-port-transferring RHCTS based on sea-rail combined container transportation [C]//3rd International Symposium on Innovation and Sustainability of Modern Railway. Beijing: Science Press, 2012, 675-680.
[12] CAO Su-qun, CHEN Wei-min, Zhang Hong. An integration method for edge detection [J]. Advanced Electrical and Electronics Engineering, 2011, 2: 243-249.
[13] ZHANG Hu, ZHU Qiu-ping, FAN Ci-en, DENG De-xiang. Image quality assessment based on Prewitt magnitude [J]. AEU-International Journal of Electronics and Communications, 2013, 67(9): 799-803.
[14] PANDEY M. Different operator using in edge detection for image processing [J]. International Journal of Computer Science Engineering and Information Technology Research, 2014, 4(1): 57-61.
[15] MEDINA-CARNICER R, MUNOZ-SALINAS R, YEGUAS- BOLIVAR E, DIAZ-MAS L. A novel method to look for the hysteresis thresholds for the Canny edge detector [J]. Pattern Recognition, 2011, 44(6): 1201-1211.
[16] PANETTA K A, AGAIAN S S, NERCESSIAN S C, ALMUNSTASHRI A A. Shape-dependent canny edge detector [J]. Optical Engineering, 2011, 50(8): 087008.
[17] JIA Xiao-fen,ZHAO Bai-ting,ZHOU Meng-ran,CHEN Zhao-quan. An edge-adaptive demosaicking method based on image correlation [J]. Journal of Central South University, 2015, 22(4): 1397-1404.
[18] GUO Yan-wen. Adaptivepreprocessing algorithms of corneal topography in polar coordinate system [J]. Journal of Central South University, 2014, 21(12): 4571-4576.
[19] MARTINI M G, HEWAGE C, VILLARINI B. Image quality assessment based on edge preservation [J]. SignalProcessing-Image Communication, 2012, 27(8): 875-882.
[20] ZHAO Ji-yin, XU Yan-lei, JIAO Yu-bin. The fast arithmetic study of image edge detection based on the order morphology [J]. Acta Electronica Sinica, 2008, 36(11): 2195-2199. (in Chinese)
[21] ZHAO Zhi-gang, WAN Jiao-na. New method for image edge detection based on gradient and zero crossing [J]. Chinese Journal of Scientific Instrument, 2006, 27(8): 821-824. (in Chinese)
[22] ZHENG Ying-juan, ZHANG You-hui, WANG Zhi-wei, ZHANG Jiang, FAN Sheng-juan. Edge detection algorithm based on the eight directions sobel operator [J]. Computer Science A, 2013, 40(11): 354-356. (in Chinese)
[23] LIU Yuan-jiong. Research on imaging optimization and depth information extraction of steel plate surface defects based on image processing [D]. Wuhan: Wuhan University of Science and Technology, 2011. (in Chinese)
[24] WANG Wen-yuan. Selecting the optimal gaussian filtering scale via the SNR of image [J]. Journal of Electronics & Information Technology, 2009, 31(10): 2483-2487. (in Chinese)
(Edited by YANG Bing)
Foundation item: Project(51174151) supported by the National Natural Science Foundation of China; Project(2010Z19003) supported by the Major Scientific Research Program of Hubei Provincial Department of Education, China; Project(2010CDB03403) supported by the Natural Science Foundation of Science and Technology Department of Hubei Province, China
Received date: 2015-09-14; Accepted date: 2016-11-18
Corresponding author: KONG Jian-yi, Professor, PhD; Tel: +86-27-68862478; E-mail: 15697188659@wo.com.cn

