电流密度对6063铝合金微弧氧化陶瓷涂层微观结构和性能的影响
来源期刊:中国有色金属学报(英文版)2016年第3期
论文作者:项南 宋仁国 庄俊杰 宋若希 陆筱雅 苏旭平
文章页码:806 - 813
关键词:6063铝合金;陶瓷涂层;微弧氧化;电流密度;微观结构;力学性能
Key words:6063 aluminum alloy; ceramic coating; plasma electrolytic oxidation (PEO); current density; microstructure; mechanical property
摘 要:以硅酸盐为主盐,加入氟锆酸钾溶液制备6063铝合金微弧氧化陶瓷层,并研究电流密度对该陶瓷层的微观结构及性能的影响。研究结果表明,涂层的孔洞密度随着电流密度的增大而减小。摩擦磨损和硬度测试表明在电流密度为15 A/dm2 下制备的涂层表现出最佳的力学性能,这与物相分析的结果是一致的。电化学阻抗谱和动电位极化曲线同样也表明在电流密度为15 A/dm2 下制备的涂层表现出最佳的耐腐蚀性能,这和涂层的形貌是直接相关的。
Abstract: Plasma electrolytic oxidation (PEO) ceramic coatings were fabricated in a silicate-based electrolyte with the addition of potassiumfluorozirconate (K2ZrF6) on 6063 aluminum alloy, and the effects of current density on microstructure and properties of the PEO coatings were studied. It was found that pore density of the coatings decreased with increasing the current density. The tribological and hardness tests suggested that the ceramic coating produced under the current density of 15 A/dm2 showed the best mechanical property, which matched well with the phase analysis. Electrochemical impedance spectroscopy (EIS) and potentiodynamic polarization curves proved that the coating obtained under 15 A/dm2 displayed the best anti-corrosion property, which was directly connected with morphologies of coatings.
Trans. Nonferrous Met. Soc. China 26(2016) 806-813
Nan XIANG1,2, Ren-guo SONG1,2,3, Jun-jie ZHUANG1,2, Ruo-xi SONG3, Xiao-ya LU1,2, Xu-ping SU1,2
1. School of Materials Science and Engineering, Changzhou University, Changzhou 213164, China;
2. Jiangsu Key Laboratory of Materials Surface Science and Technology, Changzhou University, Changzhou 213164, China;
3. Ningbo Ruilong Surface Technology Co., Ltd., Ningbo 315177, China
Received 13 April 2015; accepted 26 August 2015
Abstract: Plasma electrolytic oxidation (PEO) ceramic coatings were fabricated in a silicate-based electrolyte with the addition of potassium fluorozirconate (K2ZrF6) on 6063 aluminum alloy, and the effects of current density on microstructure and properties of the PEO coatings were studied. It was found that pore density of the coatings decreased with increasing the current density. The tribological and hardness tests suggested that the ceramic coating produced under the current density of 15 A/dm2 showed the best mechanical property, which matched well with the phase analysis. Electrochemical impedance spectroscopy (EIS) and potentiodynamic polarization curves proved that the coating obtained under 15 A/dm2 displayed the best anti-corrosion property, which was directly connected with morphologies of coatings.
Key words: 6063 aluminum alloy; ceramic coating; plasma electrolytic oxidation (PEO); current density; microstructure; mechanical property
1 Introduction
Aluminum and its alloys are widely used in fields of automotive and aerospace industries because of their excellent properties, their high specific strength, quite good formability and lightweight [1]. However, their disadvantages, such as low hardness, low wear resistance and difficulty to lubricate, have seriously limited their extensive applications. On the other hand, aluminum alloys are susceptible to corrosion, especially intergranular and pitting corrosions caused by intermetallic constituent particles, which also greatly restricted their extensive usage [2].
Plasma electrolytic oxidation (PEO), also referred to as micro-arc oxidation (MAO) [3], micro-arc discharge oxidation (MDO) [4], has attracted recent attention as a relatively new surface modification technique of light alloys such as aluminum, magnesium, titanium and their alloys [5-7]. The plasma electrolytic treatment can produce a ceramic coating on aluminum alloys to enhance their wear resistance [8] and anti-corrosion properties [9]. The process of PEO is carried out at voltages higher than the breakdown voltage of the gas layer enshrouding the anode. Since the substrate alloy is connected to positive pole of the rectifier as anode, the gas layer consists of oxygen. The coating formed on the substrate alloy, which is of crystalline or amorphous phases, formed at breakdown sites, usually contains constituent species derived from the substrate and the applied electrolytes. Specifically, when the dielectric gas layer completely covers the anode surface, electrical resistance of the electrochemical circuit surges and the process continues providing that the applied voltage is higher than that of the breakdown voltage of the gas layer. Applying such voltages leads to the formation of electrical discharges through which electric current could pass gas layer. Many researchers have addressed that the properties of PEO coating depend on electrolytes [10], electrochemical parameters [11,12] and type of power source [13]. To obtain desired coatings, many investigations on the influence factors of PEO process have been done in recent years.
It has been demonstrated that ZrO2 coating could provide a longer term protection to magnesium alloys compared with the traditional PEO coatings [14,15].
However, the effect of current density on ZrO2- containing PEO coatings has not been well studied. In this investigation, the objective was to study the most superior current density for PEO coatings on structure, tribological and anti-corrosion properties. A silicate- based electrolyte with the addition of K2ZrF6 was applied to producing ZrO2-containing ceramic PEO coatings on the aluminum alloy substrate. Results showed that the increase of current density increased the wear resistance and corrosion resistance of aluminum alloy substrate in a certain scope.
2 Experimental
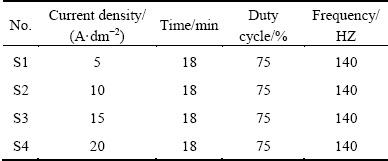
The material used in this study was 6063 aluminum alloy, its chemical composition is shown in Table 1. Oblong specimens with dimensions of 30 mm × 29 mm× 3 mm were used as substrate. The surfaces of specimens were ground by alumina waterproof abrasive paper up to 1800 grit and ultrasonically cleaned in pure ethanol for degreasing, then cleaned by distilled water and dried in ambient air in prior to PEO process. PEO process was carried out using a bipolar pulsed DC power source, a stainless steel vessel was used as the electrolytes container, a cooling system and a stirring system to keep temperature below 303 K. The cylindrical barrel with electrolytes was served as the negative electrode which was made of stainless steel. In order to ensure proper electrical contact, a threaded hole of 2 mm in diameter was made on the center of the sample and a thin aluminum rod with external threading was screwed to the sample. The electrolyte was an aqueous solution of NaSiO3 (10 g/L), KOH (1 g/L) and K2ZrF6 (2 g/L) in 1 L distilled water. The detailed parameters and corresponding labels are shown in Table 2. All coated samples were rinsed in distilled water thoroughly after the PEO treatment immediately and dried in hot air.
Table 1 Chemical composition of 6063 aluminum alloy (mass fraction, %)
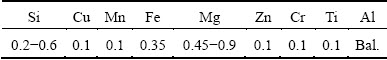
Table 2 Plasma electrolytic oxidation parameters and corresponding labels of coated specimens
Surface and cross-sectional morphologies of coatings were investigated by scanning electron microscopy (SEM, ISM-6510) with gold-sputtering. Some specimens were cross sectioned, mounted in epoxy and polished for the cross-section image. Thicknesses of coatings were studied by eddy current-based thickness gauge (Time Group Inc). Thickness measurements were made at 10 different locations and 4 scans were made for assessment of roughness on all specimens. Surface roughness measurements were carried out with a Hommel profilometer. Phase composition of coatings and bare alloy were studied by X-ray diffraction (XRD, Digaku D/max-2500) using Cu Kα radiation at 40 kV and 100 mA between 2θ values of 20° and 80° with a step length of 0.02° at a scanning rate of 1(°)/min. Data were analyzed with MDI Jade 5.0 software.
The tribological properties of the coatings were performed on a WTM-2E ball-on-disk tribometer with a rotational speed of 336 r/min. Coatings were served as the disc, and the counterpart was Si3N4 ceramic ball (4 mm in diameter, HV 1550 in hardness). The abrasion loss was measured after 35 min friction measurement with an electronic direct reading balance (LJBROR L-200, readability 0.01 mg). The hardnesses of coatings were evaluated by using an HMV-IT microhardness tester with Vikers under a load of 0.2 kg.
Electrochemical tests were carried out using a CorrTest AC potentiostat/frequency response analyzer (electrochemical workstation, CS350) system to evaluate the corrosion behavior of PEO coated specimens and bare alloy. A typical three-electrode-system, which consisted of a saturated calomel electrode (SCE) as a reference electrode, a platinum mesh counter electrode and the PEO coated specimens as working electrode (1 cm2 exposed area). The electrochemical tests were carried out in 0.59 mol/L NaCl aqueous solution with pH of 7 approximately. Potentiodynamic polarization test was carried out over a potential range from -1.2 V to -0.2 V for PEO coatings and bare alloy after 2 h of immersion in 0.59 mol/L NaCl. Electrochemical impedance spectroscopy (EIS) tests were conducted in the frequency range of 105 Hz to 10-1 Hz on PEO coatings exposed to the corrosive electrolyte for 2 h. A 10 mV peak-to-peak amplitude of AC potential signal was selected after achieving a relatively much stabilized open circuit potential. The CorShow and ZSimpWin were used to deal with the data of potentiodynamic polarization and EIS measurements, respectively. Under each testing condition, potentiodynamic polarization and EIS measurements were repeated 3 times at least in order to guarantee the reliability and reproducibility.
3 Results and discussion
3.1 Voltage-time response
Figure 1 shows the voltage transient during the PEO process in silicate-based electrolyte with the addition of potassium fluorozirconate under the current densities of 5, 10, 15, 20 A/dm2 for 18 min. It can be seen that the voltage increased faster under higher current density than that under the lower current density during the PEO treatment. Therefore, the coating produced under higher current density has a higher terminal voltage than that of the coating produced under lower current density. The terminal voltages of the coatings produced under the current densities of 5, 10, 15 and 20 A/dm2 are 434, 469, 489 and 517 V, respectively.
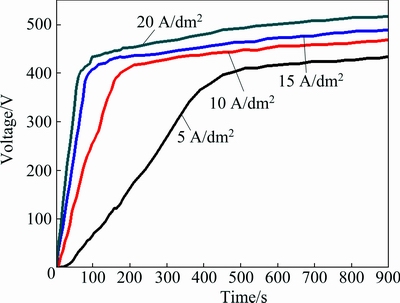
Fig. 1 Voltage transient during PEO of 6063 aluminum alloy produced under current densities of 5, 10, 15, 20 A/dm2 for 18 min
3.2 Microstructure and phase analysis
The surface micrographs of PEO coatings formed under different current densities are shown in Figs. 2(a)-(d). In the specimen S1, the pore sizes are registered as three different magnitudes ((1±0.5), (3±0.8), (9±1) μm in diameter). As reported in Refs. [16,17], the pores were formed by the molten oxide and gas bubbles which were emitted out of the micro-arc discharge channels. It can be clearly seen that the number of pores (pore density) decreased with the increasing current density; however, the sizes of pores are quite large. The breakdown voltages of PEO coatings produced under the current densities of 5, 10, 15 and 20 A/dm2 for 18 min are registered as 165, 154, 132 and 109 V. According to Ref. [18], higher voltages promote large pores within the oxide coating. Cross-sectional morphologies of all PEO coatings are presented in Figs. 2(e)-(h). All the coatings were observed to have a wavy jagged interface with the substrate, which is most likely as a result of the dissolution of the substrate in the early stage of treatment. A closer look at the cross-section morphologies of the coatings showed that the specimen S3 exhibited a relatively thick and compact coating among them.
X-ray diffraction patterns of the aluminum alloy substrate and PEO coatings fabricated in different current densities are shown in Fig. 3. The coatings are mainly composed of α-Al2O3, γ-Al2O3 and small amount of ZrO2. On the other hand, it can be revealed that the diffraction peak intensity of α-Al2O3 increased when the current density reached 15 A/cm2. Nevertheless, when the current density came to 20 A/cm2, the intensity of α-Al2O3 slightly decreased, which suggested that the transformation of α-Al2O3 to γ-Al2O3 occurred easily during the high temperature. For all the PEO coatings, the diffraction of Al corresponding to the substrate was detected.
3.3 Mechanical properties
Thickness and surface roughness values of PEO coated specimens are shown in Fig. 4(a). The effect of current density on coatings thickness was profound. The average thicknesses of specimens S1, S2, S3 and S4 were 9.1, 13.1, 15.4, 18.3 μm, respectively. The coating obtained in 20 A/dm2 was 2 times thicker than that fabricated under 5 A/dm2. Roughness values of the coatings were found to be linearly increased with the increment of current density. The formation of oxide coating as large chunks at higher current density levels; besides, big pores also are responsible for the increased surface roughness.
Micro-hardness test results and mass loss of PEO coatings are shown in Fig. 4(b), revealing that the micro-hardness increased with the current density when the voltage increased to 15 A/dm2. The specimen S1 registered an average micro-hardness value of HV 657. However, with the increasing current density, the average micro-hardness value of S3 dramatically increased to HV 1306, which can be attributed to the increment of α-Al2O3. However, when the current density increased further to 20 A/dm2, the average micro-hardness value of S4 slightly decreased, due to the transformation of α-Al2O3 to γ-Al2O3 which matched well with the X-ray diffraction analysis. The mass loss of the PEO coatings exhibited a completely different pattern. The mass loss decreased obviously first and then increased with the increasing current density. The mass loss of S1 is about 1.29 mg. Nevertheless, when the current density increased to 15 A/dm2, the mass loss of S3 is 0.68 mg approximately, which is confirmed well with the micro-hardness tests. When the current density increased to 20 A/dm2, the mass loss of S4 marginally increased to 0.73 mg.
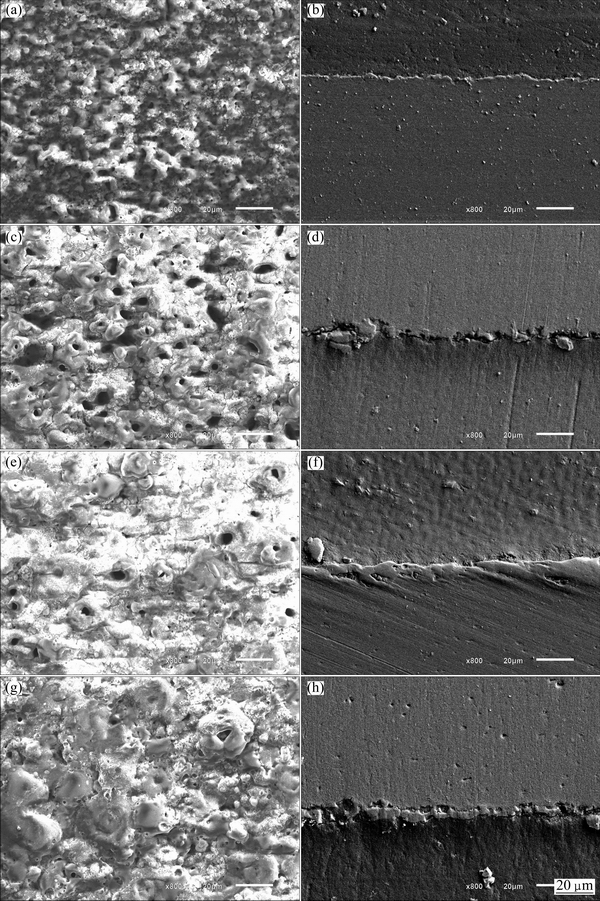
Fig. 2 Surface and cross-section morphologies of PEO coatings produced under current densities of 5 A/dm2 (a,b), 10 A/dm2 (c, d), 15 A/dm2 (e, f), 20 A/dm2 (g, h) for 18 min
3.4 Anti-corrosion properties
3.4.1 Potentiodynamic polarization and morphology of corroded specimen
Potentiodynamic polarization curves of uncoated and PEO coated aluminum alloy substrate carried out in 0.59 mol/L NaCl after an initial time of 2 h immersion are shown in Fig. 5. Typically, in polarization curves, positive corrosion potential (φcorr) and negative corrosion current density (Jcorr) represented lower corrosion rate and good anti-corrosion behavior. The corrosion potential (φcorr), current density (Jcorr) were extracted directly from the potentiodynamic polarisation curves by Tafel fit method. The determined parameters related to potentiodynamic polarisation curves were listed in Table 3. From Table 3 and Fig. 5, it can be seen that the corrosion potential of specimen S1 shifted about 50 mV (vs SCE) in a positive direction and meanwhile the corrosion current density decreased one order of magnitude than that of uncoated 6063 Al alloy. With the increment of current density, the corrosion potential persistently increased and the corrosion current density decreased continually. However, when the current density increased to 20 A/dm2, the corrosion current density increased dramatically. This can be attributed to the microstructure of PEO coatings. Therefore, the specimen S3 exhibited the most superior corrosion resistance with a current density of 6.688×10⁻⁸ A/cm2.
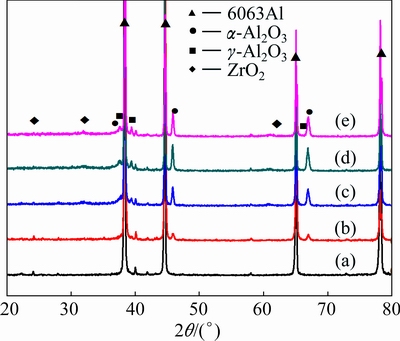
Fig. 3 X-ray diffraction patterns of bare alloy (a) and PEO coatings obtained under current densities of 5 A/dm2 (b), 10 A/dm2 (c), 15 A/dm2 (d), 20 A/dm2 (e) for 18 min
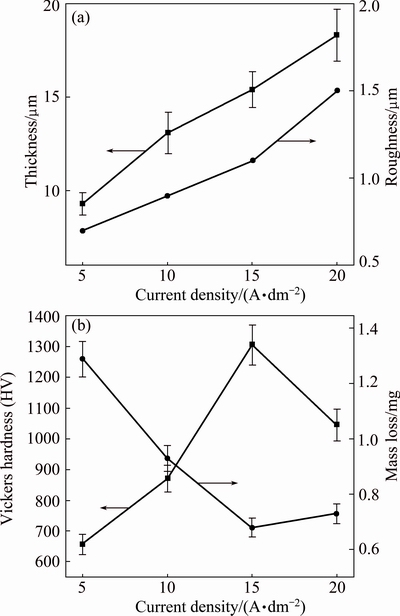
Fig. 4 Thickness and roughness (a) and micro-hardness and mass loss (b) of PEO coated specimens at different current densities for 18 min
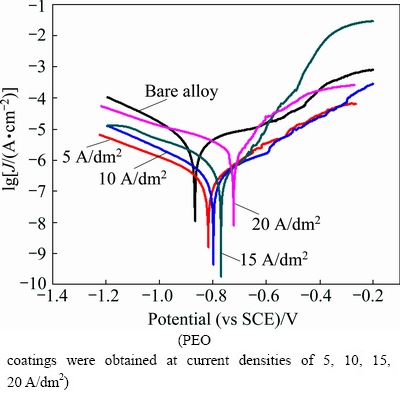
Fig. 5 Potentiodynamic polarization curves of uncoated and PEO coated 6063 Al alloys in 0.59 mol/L NaCl solution
Table 3 Fitting results of potentiodynamic polarization curves for uncoated bare alloy substrate and PEO coatings obtained under different current densities

The corrosion surface morphologies of bare alloy substrate and PEO treated specimen S3 after 20 h in 0.59 mol/L NaCl solution after potentiodynamic polarization test are depicted in Fig. 6. Severe localized corrosion damage can be seen on the bare specimen, while it is marginally in the PEO coated specimen S3. And the polarization results showed that the corrosion current density of bare alloy is nearly 140 times higher than that of the coated specimen S3. This indicates that the PEO technique performed in this study leads to a reasonable low corrosion rate and quite good corrosion resistance.
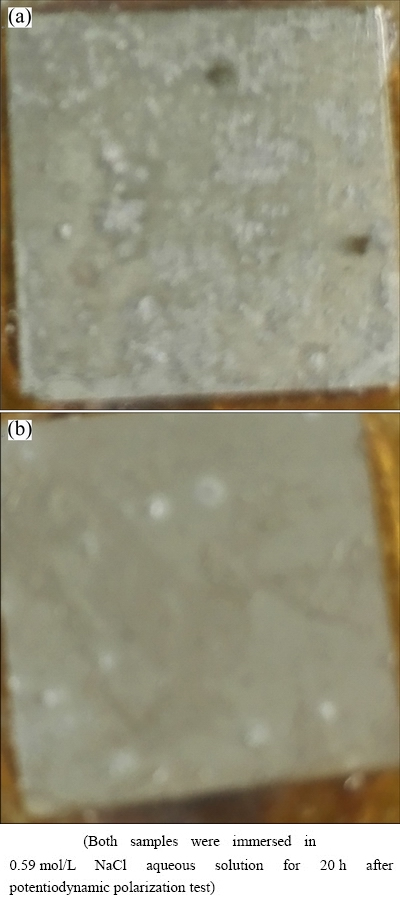
Fig. 6 Corroded surface morphologies of untreated 6063 Al alloy (a) and PEO coated specimen (b) obtained under current density of 15 A/dm2
3.4.2 Electrochemical impedance spectroscopy
The Nyquist plot and simulated data of uncoated and PEO coated 6063 Al alloys are shown in Fig. 7 and Table 4, respectively. From Table 4, it can be seen that the corrosion resistance of bare alloy was significantly improved by PEO treatment. And it is clearly shown by electrochemical tests that, when the current density is lower than 15 A/dm2, the corrosion resistance increased with the increasing current density. However, the corrosion resistance of PEO coating prepared at 20 A/dm2 dramatically descended. It has been reported that the average growth rate and defects level of PEO coatings both increased with current density for a given processing duration [19]. The equivalent circuit model was established in Fig. 8 to analyze the EIS results based on a reasonable fitting of the experimental values. The capacitance behavior of coatings and substrate can be simulated better by constant phase element (CPE) [20] which is represented by symbol Q in this work. The impedance formula for Q is described by the following formula:
 (1)
(1)
where j is an imaginary unit (j2=-1) and ω is angular frequency (ω=2πf). The coefficients Y0 and n (-1≤n≤1) are the parameters of CPE.
In the presented equivalent circuit in Fig. 8, Rs stands for the solution resistance between specimen and reference electrode, Rdl is the double layer charge transfer between alloy substrate and solution, Qdl is double-layer CPE, Rc and Qc (Fig. 8(a)) are corrosion resistance and CPE between the alloy and corrosive media, respectively. Rp is the resistance of outer porous layer (specifically means the resistance of defects, like pores/cracks of coatings) which paralleled with a constant phase element (Qp), Rb denotes the inner barrier layer resistance (including the resistance of the coating/substrate interface) which paralleled with a constant phase element (Qb).
Figure 9 represents the Nyquist plots and EIS fitted data for PEO treated specimen at current density of 15 A/dm2 immersed in 0.59 mol/L NaCl solution for different immersion time. The equivalent circuits for all immersion time are as similar as that presented in Fig. 8(b) in which the response of porous and barrier layers are demonstrated by Qp//Rp and Qb//Rb, respectively. Clearly, it can be seen that the Nyquist plots consist of two time constants for all immersion time. It is obvious from the Nyquist plots that with increasing immersion time, the plots shift to lower diameters (lower values of polarization resistance) gradually. This indicates that dielectric property of the barrier layer has been influenced by immersion time. Furthermore, decreasing of peak height in medium frequency suggests that response of barrier layer becomes less capacitive. This phenomenon can be attributed to the penetration of electrolyte into the coating.
Table 4 EIS simulated data, untreated 6063 Al alloy and PEO treated alloy produced under different current densities after immersion in 0.59 mol/L NaCl for 2 h
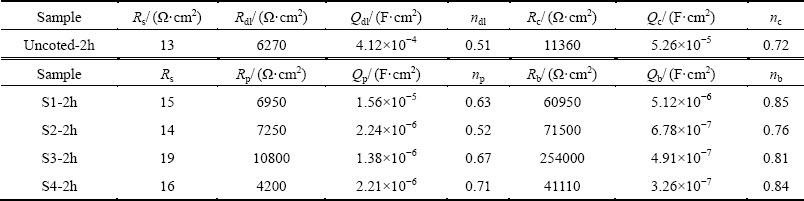
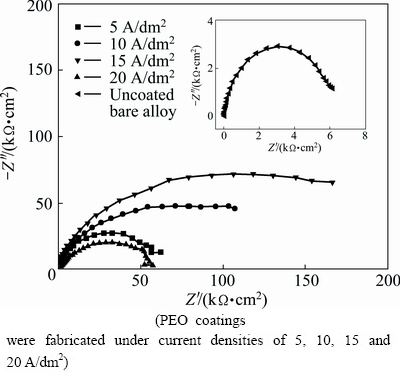
Fig. 7 Nyquist plots of uncoated and PEO coated 6063 Al alloys obtained in 0.59 mol/L NaCl solution
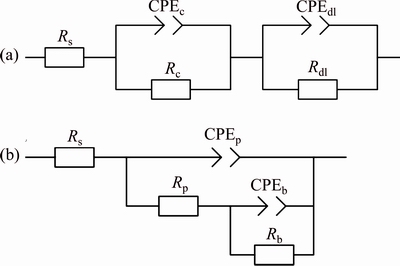
Fig. 8 Corresponding equivalent circuits for fitting impedance data of uncoated (a) and PEO coated (b) 6063 Al alloy
Using equivalent circuit of Fig. 8(b), the fitted parameters of EIS simulated spectra of PEO treated for different immersion time are represented in Fig. 9(b). According to the variation of Rp and Rb with immersion time, it can be concluded that with increasing immersion time, the corrosion resistances of both outer porous layer and inner barrier layer are decreased. Furthermore, from the presented data in Fig. 9(b), it can be concluded that for the most immersion time, the inner barrier layer shows more corrosion resistance than the outer porous layer. This demonstrates that corrosion protection of substrate is mainly provided by inner barrier layer. Also, lower values of n (n<1) for both layers could be attributed to the non-uniform and porous nature of the oxide film.
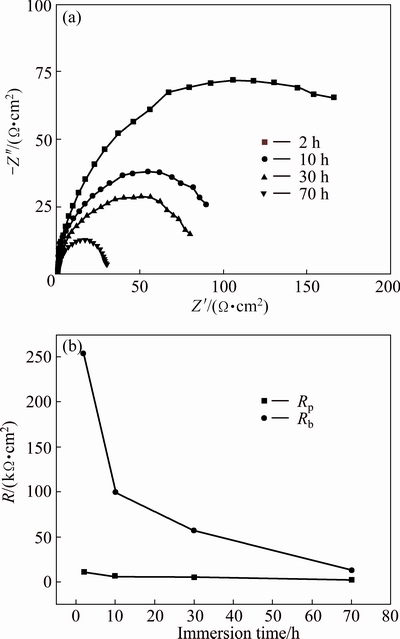
Fig. 9 Nyquist plots (a) and EIS simulated data (b) of PEO coated 6063 Al alloy produced under current density of 15 A/dm2 immersed in 0.59 mol/L NaCl solution for different immersion time
4 Conclusions
1) Plasma electrolytic oxidation coatings were fabricated under different current densities in a silicate- based electrolyte with the addition of potassium fluorozirconate. The effects of current density on structure, mechanical and anti-corrosion properties of PEO coatings were studied.
2) The PEO coating produced under 15 A/dm2 exhibited the most superior microstructure with less defects and a relatively thick layer. The tribological test results also showed that the PEO coating obtained under 15 A/dm2 showed the best anti-wearing property, which is consistent with the hardness test.
3) Electrochemical tests showed that the PEO coating produced under 15 A/dm2 exhibited the most superior corrosion resistance, which was confirmed by potentiodynamic polarization and EIS tests.
References
[1] WANG Zhi-jiang, WU Li-na, QI Yu-lin, CAI Wei, JIANG Zhao-hua. Self-lubricating Al2O3/PTFE composite coating formation on surface of aluminium alloy [J]. Surface and Coatings Technology, 2010, 204: 3315-3318.
[2] BIERWAGEN G, BROWN R, BATTOCCHI D, HAYES S. Active metal-based corrosion protective coating systems for aircraft requiring no-chromate pretreatment [J]. Progress in Organic Coatings, 2010, 68: 48-61.
[3] XUE Wen-bin, WU Xiao-ling, LI Xi-jin, TIAN Hua. Anti-corrosion film on 2024/SiC aluminum matrix composite fabricated by microarc oxidation in silicate electrolyte [J]. Journal of Alloys Compounds, 2006, 425: 302-306.
[4] LV Guo-hua, GU Wei-chao, CHEN Huan, FENG Wen-ran, KHOSA M L, LI Li, NIU E, ZHANG Gu-ling, YANG Si-ze. Characteristic of ceramic coatings on aluminum by plasma electrolytic oxidation in silicate and phosphate electrolyte [J]. Applied Surface Science, 2006, 253: 2947-2952.
[5] ERARSLAN Y. Wear performance of in-situ aluminum matrix composite after micro-arc oxidation [J]. Transactions of Nonferrous Metals Society of China, 2013, 23(2): 347-352.
[6] CHU Cheng-lin, HAN Xiao, BAI Jing, XUE Feng, CHU Paul-kao. Surface modification of biomedical magnesium alloy wires by micro-arc oxidation [J]. Transactions of Nonferrous Metals Society of China, 2014, 24(4): 1058-1064.
[7] ZHANG X L, JIANG Z H, YAO Z P, WU Z D. Electrochemical study of growth behaviour of plasma electrolytic oxidation coating on Ti6Al4V: Effects of the additive [J]. Corrosion Science, 2010, 52: 3465-3473.
[8] TIAN Jun, LUO Zhuang-zi, QI Shang-kui, SUN Xiao-jun. Structure and antiwear behavior of micro-arc oxidized coatings on aluminum alloy [J]. Surface and Coatings Technology, 2002, 154: 1-7.
[9] FADAEE H, JAVIDI M. Investigation on the corrosion behaviour and microstructure of 2024-T3 Al alloy treated via plasma electrolytic oxidation [J]. Journal of Alloys and Compounds, 2014, 604: 36-42.
[10] SRINIVASAN P B, LIANG Jun, BLAWERT C, DIETZEL W. Dry sliding wear behaviour of magnesium oxide and zirconium oxide plasma electrolytic oxidation coated magnesium alloy [J]. Applied Surface Science, 2010, 256: 3265-3273.
[11] WANG Jun-Hua, DU Mao-hua, HAN Fu-zhu, YANG Jing. Effects of the ratio of anodic and cathodic currents on the characteristics of micro-arc oxidation ceramic coatings on Al alloys [J]. Applied Surface Science, 2014, 292: 658-664.
[12] HUSSEIN R O, NORTHWOOD D O, NIE X. The effect of processing parameters and substrate composition on the corrosion resistance of plasma electrolytic oxidation (PEO) coated magnesium alloys [J]. Surface and Coatings Technology, 2013, 237: 357-368.
[13] DU Ke-qin, GUO Xing-hua, GUO Quan-zhong, WANG Fu-hui, TIAN Ying. A monolayer PEO coating on 2024 Al alloy by transient self-feedback control mode [J]. Materials Letters, 2013, 91: 45-49.
[14] LIANG Jun, SRINIVASAN P B, BLAWERT C, DIETZEL W. Comparison of electrochemical corrosion behaviour of MgO and ZrO2 coatings on AM50 magnesium alloy formed by plasma electrolytic oxidation [J]. Corrosion Science, 2009, 51: 2483-2492.
[15] LIANG Jun, SRINIVASAN P B, BLAWERT C, DIETZEL W. Influence of pH on the deterioration of plasma electrolytic oxidation coated AM50 magnesium alloy in NaCl solutions [J]. Corrosion Science, 2010, 52: 540-547.
[16] ZHOU X, THOMPSON G E, SKELDON P, WOOD G C, SHIMIZU K, HABAZAKI H. Film formation and detachment during anodizing of Al-Mg alloys [J]. Corrosion Science, 1999, 41: 1599-1613.
[17] LIU Fu, XU Ji-lin, WANG Fu-ping, ZHAO Lian-cheng, SHIMIZU T D. Biomimetic deposition of apatite coatings on micro-arc oxidation treated biomedical NiTi alloy [J]. Surface and Coatings Technology, 2010, 204: 3294-3299.
[18] ARUMUGAM M K, SUN H K, HWA C J, YOUNG H P, HEA J K, KWANG S S. Fabrication and electrochemical corrosion behavior of PEO coatings on strip-cast AZ31Mg alloy in 3.5% NaCl solution [J]. Industrial and Engineering Chemistry Research, 2014, 53: 9703-9713.
[19] SRINIVASAN P B, LIANG Jun, BLAWERT C, STORMER M, DIETZEL W. Effect of current density on the microstructure and corrosion behaviour of plasma electrolytic oxidation treated AM50 magnesium alloy [J]. Applied Surface Science, 2009, 255: 4212-4218.
[20] SU Pei-bo, WU Xiao-hong, GUO Yun, JIANG Zhao-hua. Effects of cathode current density on structure and corrosion resistance of plasma electrolytic oxidation coatings formed on ZK60 Mg alloy [J]. Journal of Alloys and Compounds, 2009, 475: 773-777.
项 南1,2,宋仁国1,2,3,庄俊杰1,2,宋若希3,陆筱雅1,2,苏旭平1,2
1. 常州大学 材料科学与工程学院,常州 213164;
2. 常州大学 江苏省材料表面科学与技术重点实验室,常州 213164;
3. 宁波瑞隆表面技术有限公司,宁波 315177
摘 要:以硅酸盐为主盐,加入氟锆酸钾溶液制备6063铝合金微弧氧化陶瓷层,并研究电流密度对该陶瓷层的微观结构及性能的影响。研究结果表明,涂层的孔洞密度随着电流密度的增大而减小。摩擦磨损和硬度测试表明在电流密度为15 A/dm2 下制备的涂层表现出最佳的力学性能,这与物相分析的结果是一致的。电化学阻抗谱和动电位极化曲线同样也表明在电流密度为15 A/dm2 下制备的涂层表现出最佳的耐腐蚀性能,这和涂层的形貌是直接相关的。
关键词:6063铝合金;陶瓷涂层;微弧氧化;电流密度;微观结构;力学性能
(Edited by Yun-bin HE)
Foundation item: Project (51371039) supported by the National Natural Science Foundation of China
Corresponding author: Ren-guo GONG; Tel: +86-519-86330069; E-mail: songrg@hotmail.com
DOI: 10.1016/S1003-6326(16)64171-7

