水域底泥中重金属Cd与Pb释放规律的数值模拟
来源期刊:中国有色金属学报(英文版)2021年第1期
论文作者:闫红杰 张河杨 史雅君 周萍 李欢 伍东玲 刘柳
文章页码:277 - 287
关键词:底泥;重金属污染;再释放率;数值模拟
Key words:sediment; heavy metal pollution; re-release rate; numerical simulation
摘 要:采用实验研究与数值模拟相结合的方法,研究某水域底泥中典型重金属污染物Cd与Pb再释放过程和释放速率。结果表明,底泥中Cd和Pb的释放规律分为快速释放和动态平衡两个阶段,与准二级动力学方程具有较好的匹配度,相关系数R2大于0.99。随着河流流速的加快,底泥中重金属的释放速率增大。分析表明,该区域水质可以在3 h内超过地表水环境质量V类标准。数值模拟结果与实测值之间的相对偏差除一项外均在±10%以内。
Abstract: The re-release process and the release rate of heavy metals, cadmium and plumbum, which are rich in sediments of a certain water area, were investigated using a combined experimental and numerical method. Results show that the release law of Cd and Pb in sediments is divided into two stages: rapid release and dynamic equilibrium, which is in great agreement with the pseudo second-order kinetic equation with a correlation coefficient R2 above 0.99. As the flow velocity accelerates, the release rate of heavy metals increases. The analysis results indicate that the water quality in the area can exceed the surface water Class V standard less than 3 h, and all but one of the relative deviations between the simulation value and the field survey result are within ±10%.
Trans. Nonferrous Met. Soc. China 31(2021) 277-287
Hong-jie YAN1, He-yang ZHANG1, Ya-jun SHI1, Ping ZHOU1, Huan LI2,3, Dong-ling WU1, Liu LIU1
1. School of Energy Science and Engineering, Central South University, Changsha 410083, China;
2. School of Metallurgy and Environment, Central South University, Changsha 410083, China;
3. Changsha Environmental Protection College, Changsha 410004, China
Received 15 February 2020; accepted 25 November 2020
Abstract: The re-release process and the release rate of heavy metals, cadmium and plumbum, which are rich in sediments of a certain water area, were investigated using a combined experimental and numerical method. Results show that the release law of Cd and Pb in sediments is divided into two stages: rapid release and dynamic equilibrium, which is in great agreement with the pseudo second-order kinetic equation with a correlation coefficient R2 above 0.99. As the flow velocity accelerates, the release rate of heavy metals increases. The analysis results indicate that the water quality in the area can exceed the surface water Class V standard less than 3 h, and all but one of the relative deviations between the simulation value and the field survey result are within ±10%.
Key words: sediment; heavy metal pollution; re-release rate; numerical simulation
1 Introduction
The river pollution left over from history will affect the surrounding biota for a lasting period of time [1-3]. Heavy metals are considered as the major component of pollutants in the aquatic environment because of the toxicity, bio- accumulation and stability against the degradation, which seriously threatens the well-being of human [4-6]. Toxic metals are transported into water through both natural sources and anthropogenic sources, such as sewage discharge, atmospheric deposition and surface runoff. After adsorption, desorption and precipitation processes, heavy metals are accumulated in the sediments continuously [7,8] and may be released into the water due to the sediment resuspension, desorption reactions, oxidation or reduction reactions [9,10]. As a potential sink of various pollutants, the sediments will cause secondary pollution to the overlying water in the form of a new source [11]. Therefore, researches focusing on the release of heavy metal pollutants in sediments are of great significance for the control and prevention of heavy metal pollution in rivers.
With the field measurement method, NICKEL et al [12] and CHAI et al [13] selected multiple test points in the research basin for heavy metal pollution assessment and pollution status analysis. However, this method is restricted to the development of measuring techniques. In order to better control the experimental condition and conduct targeted research, many scholars [14,15] completed the study of heavy metal contamination in sediments through indoor experiments. TSAI and LICK [14] designed a portable device for measuring sediment resuspension, which enables a rapid and accurate resuspension measurement. Since the 1980s, numerical simulation method has been gradually introduced into the study of heavy metal pollution in sediments [16]. In numerical simulations, the mathematical description of the interacting mechanism between heavy metals and water, suspended sediments and sediments is of crucial importance. MAHDAVI et al [17] and SERRANO-PACHECO et al [18] took the water body as a whole to describe the kinetic process of heavy metal transport and transformation by numerical models. With the MeRiMod modelling tool, ZAGAR et al [19] established a 1-D aquatic model to investigate mercury cycling processes in the river system. Nevertheless, most of the existing studies are limited to the historical sedimentation and pollution processes of heavy metals [20-22], which are lack of prediction for heavy metal release and re-pollution phenomena. Few studies have considered the relationship between the release rate of heavy metals and hydrodynamic conditions. Therefore, the numerical transformation of release phenomenon still needs further investigation.
In this study, in order to characterize the diffusion behavior of heavy metal pollutants in the sediment-overlying water system, indoor experiments are conducted to investigate the effect of flow velocity on the release rates of heavy metals Cd and Pb in the sediments of a certain water area. The re-release process of heavy metals in the actual river section is numerically simulated to study the distribution of heavy metals in the water body for pollution control.
2 Experimental
The re-release process of heavy metal in sediments includes the entering of particulate pollutants into water and the transformation of heavy metals from the sedimentary to the dissolved state. In this work, the riverbed sediment in the downstream section of a certain water area was selected as the study object. Based on the indoor experiment, the contents of Cd and Pb in the overlying water was measured under the condition that the sediment was considered as a pollution source. The release and diffusion discipline of Cd and Pb at different flow velocities were described by the release kinetic formulas of Cd and Pb, which improved the concentration equation of heavy metal pollutants diffusion in aquatic environment.
2.1 Materials preparation
The sediments are sampled by grab in a downstream section of an actual river. The collected samples were dried in an electric oven at 60 °C for 14 d and 110 °C for 2 d until they attained constant mass, and ground into powder by agate mortar and pestle until fine particles (<150 μm). Next, 40 g sample was placed into clean Teflon vial, digested with 1 mL HNO3 and 3 mL HF and heated on a hot plate at 130 °C for about 72 h. After the sample was cooled, 0.5 mL HClO4 was added, and heated on a hot plate at 120 °C for 12 h with the lid opened until the white smoke disappeared. Afterwards, 1 mL HNO3 and 1 mL deionized water were added and heated on a hot plate at 120 °C for 12 h for re-dissolution. Finally, the cooled solutions were transferred to a Teflon beaker and diluted with deionized water to a final volume of 40 mL. The concentrations of dissolved metals (Cd and Pb) in the water samples were measured by the inductively coupled plasma mass spectrometry (Agilent 7500 ICP-MS) under the standard operating conditions.
2.2 Experimental device and principle
Due to the data sensitivity, the data concerning metal content in the paper were all divided by a uniform base value. In order to obtain a stable experimental environment, an indoor circulating water tank was used, which was 50 cm in length and 40 cm in height, as shown in Fig. 1. The experimental circulating water was pure water, and the sediment was taken from the downstream section of a certain water area. By means of artificial pollution, the initial values of Cd and Pb in the sediment were set as 123.505 and 2944 mg/kg respectively based on the measured value in the actual river section. The mud layer was evenly spread 10 cm thick and the water layer was 20 cm. The experiment lasted for three weeks. In the first week, the experimental reagents and the sediment samples were prepared. The contents of Cd and Pb in samples were measured by ICP-MS. In the second week, the pump was started to stabilize the water tank with a flow velocity of 0.1 km/h, which was the average annual flow velocity of the river. During the process, heavy metals in the sediment would be freely released and reached a dynamic equilibrium. In the third week, the flow velocity was adjusted to 0.3, 0.5, 0.7, 0.9 and 1.1 km/h successively for the experimental conditions, so that the release dynamics of heavy metals Cd and Pb in the sediment under the disturbance of different flow rates can be investigated.
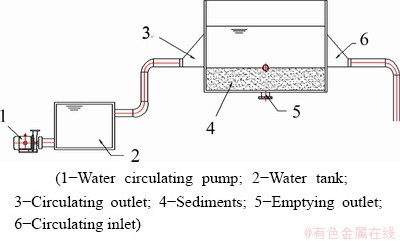
Fig. 1 Schematic diagram of experimental device used in this study
2.3 Samples collection and analysis
2.3.1 Samples collection
The experimental analysis index is the content of heavy metals in the overlying water. Five sampling locations were set in the water tank, located in the center of water 10 cm-deep from the water surface, which are shown in Fig. 2. In each site, 20 mL sample was collected and centrifuged for 10 min to obtain the supernatant. After mixing with HNO3, the solution was adjusted to pH value less than 2, and then placed in the refrigerator for later testing. The contents of Cd and Pb in water were measured by ICP-MS.
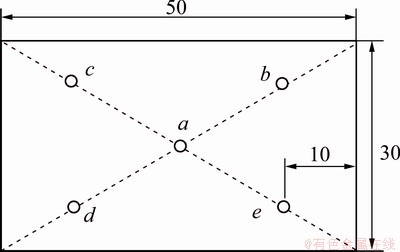
Fig. 2 Distribution of sampling locations (Unit: cm)
2.3.2 Analysis of experimental results
As shown in Figs. 3 and 4, the release disciplines of heavy metals Cd and Pb in sediments at different flow velocities are basically the same, which are divided into two stages, consisting of a rapid release stage and a dynamic equilibrium stage. The concentrations of Cd and Pb in the overlying water were boosted with time, then reached a state of dynamic equilibrium. With the acceleration of flow velocity, the release rates of Cd and Pb in the sediment gradually increased, and the concentrations of heavy metals in the overlying water increased as well in the dynamic equilibrium stage.
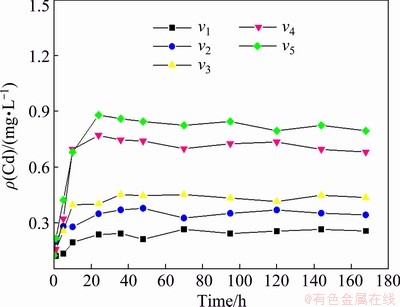
Fig. 3 Concentration of Cd in overlying water (v1= 0.3 km/h, v2=0.5 km/h, v3=0.7 km/h, v4=0.9 km/h and v5=1.1 km/h)
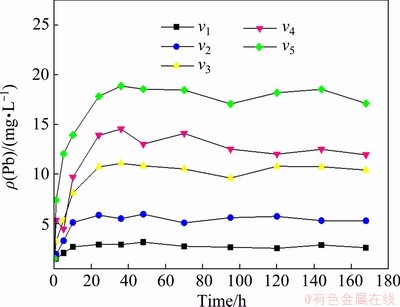
Fig. 4 Concentration of Pb in overlying water (v1= 0.3 km/h, v2=0.5 km/h, v3=0.7 km/h, v4= 0.9 km/h and v5=1.1 km/h)
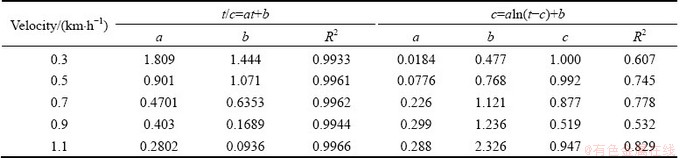
According to previous studies [23,24], the pseudo second-order kinetic equation and the Elovich equation were adopted to fit the concentrations of Cd and Pb in the above experiment, which are shown in Tables 1 and 2. The release processes of Cd and Pb in the certain river sediment had a good matching degree with the pseudo second-order kinetic equation with a correlation coefficient R2 above 0.99; whereas the equation fitted according to the Elovich equation is not ideal. By comparing the reaction mechanisms represented by the two fitting forms [25,26], a conclusion can be drawn that the release process of heavy metals Cd and Pb in sediments tends to obey the single reaction mechanism, and does not require a high activation energy.
Considering the influence of the flow velocity and the time, the contents of Cd and Pb in the overlying water can be described as follows:
t/c=41.95te-2v+4.23e-2v (for Cd) (1)
t/c=4.343te-3v+3.17e-3v (for Pb) (2)
Equation (1) denotes the content of Cd in water and Eq. (2) denotes the content of Pb in water with the correlation coefficient R2 of 0.9832 and 0.9841, respectively. The formulas can be adopted to predict the release amount of Cd and Pb in sediments when the flow velocity reaches any point between 0.3 and 1.1 km/h. With a single adsorption/ release constant, the release rate χ of Cd and Pb in sediments during the dynamic process can be deduced by
Cs(t, v)=-C(t, v)・Vw/M (3)
 (4)
(4)
where C(t, v) denotes the function of the content of Cd or Pb in the water, and Cs(t, v) denotes the function of the content of the corresponding elements in the sediment, Vw is the volume of water in the tank; M is the amount of dry sediment under the corresponding area.
Table 1 Kinetic formula for Cd release process
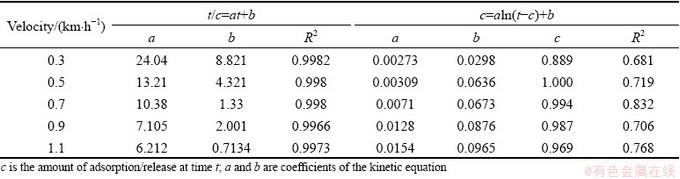
Table 2 Kinetic formula for Pb release process
3 Numerical simulation
3.1 Physical model
In order to fully reflect the release characteristics of Cd and Pb in sediments, a representative river section of about 25 km in a certain water area was selected with an annual average depth of 31.3 m measured by the local hydrological station. As shown in Fig. 5, the physical model of the river section was built by ArcGIS10.2 and ICEM software, which is 1:1 ratio to the real size and is divided into 5 regions (A, B, C, D and E) bounded by the middle section of two adjacent sampling sections.

Fig. 5 Physical model of selected water area
3.2 Mathematical model
The river flow exists in the form of turbulence in nature. The mathematical model can be derived under the assumption that the fluid is incompressible.
(1) Continuity equation
 (5)
(5)
where ux, uy and uz denote the average velocity components in the x, y and z directions, respectively.
(2) Momentum equation
On the riverbed and river bank of real rivers, flowing water is subject to a strong viscous shearing stress due to the presence of sediments. Therefore, considering the effect of sediments at the bottom, the momentum equation is established with the water-level depth (h) as the characteristic quantity under the condition of three- dimension [27]:

 (6)
(6)

 (7)
(7)

 (8)
(8)
where the first term on the right side of the equation denotes the volume force, the second term denotes the turbulent shear stress, the third term denotes the viscous shearing stress at the riverbed, H is the average depth of water-level, g denotes the gravitational acceleration; h denotes the depth of the water; νε denotes the kinematic viscosity of turbulence; ρ denotes the density of river, and τsx, τsy and τsz denote the viscous shearing stress at the riverbed.
 (9)
(9)
 (10)
(10)
 (11)
(11)
where Cf is the friction coefficient.
(3) Turbulence model
Considering that the influence of the sediment viscosity to the near-wall water area is significant, the standard k-ε turbulence model is modified according to the previous study [28]:

 (12)
(12)

 (13)
(13)

 (14)
(14)
where C1, C2, δk and δε are coefficients of the k-ε model, respectively; Gk is the generation item; k denotes the turbulence kinetic energy; ε denotes the turbulence kinetic energy dissipation ratio; μe denotes the effective viscosity, μt denotes the eddy viscosity; Pk and Pe are the modified terms of friction resistance for the turbulence kinetic energy, related to the viscous shearing stress and the depth of water [29].
 (15)
(15)
 (16)
(16)
 (17)
(17)
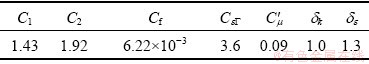
where C′μ,  are coefficients of the k-ε model, respectively, u* denotes the friction velocity. The relevant coefficients are listed in Table 3.
Table 3 Coefficients of standard k-ε turbulent model
(4) Vertical velocity profile of river
Flow velocity is one of the vital hydraulic elements that reflect turbulent characteristics, denoted as [30]
 (18)
(18)
where z is the height from the riverbed; a is the index; um denotes the maximum flow velocity; β=um2ν/(gJh2), in which ν denotes the kinematic viscosity of water and J denotes the hydraulic gradient.
(5) Concentration equation
Without the participation of external pollution sources, the concentration equation is established by


 (19)
(19)
 (20)
(20)
where Dm is the molecular diffusion coefficient of heavy metals; Dt is the turbulent diffusion coefficient of heavy metals; Dd is the longitudinal dispersion diffusion coefficient of heavy metals; R is the source item; χ is the release rate of heavy metals; A denotes the effective area of the sediment surface in the control body.
In the numerical simulation, the relevant parameters are shown in Table 4.
3.3 Analysis of simulation results
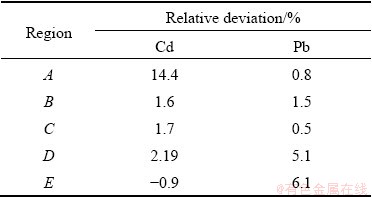
Results of the numerical simulation are shown in Figs. 6 and 7. Under the flow disturbance, the heavy metals in sediments re-released. Over time, the contents of Cd and Pb on the sediment surface of a certain water area gradually decreased. After an interval of 24 h, the simulation values of the heavy metal contents in sediments in regions A, B, C, D and E were compared with the field survey result, as illustrated in Table 5. The relative deviations were all within ±10% except for one individual value, which demonstrates that the mathematical model and simulation method used in this work have certain theoretical significance, and can manage to simulate the dynamic process of re-release of heavy metals in sediments due to the change of flow velocity in a certain period of time.
As shown in Fig. 8, the heavy metals released from the sediment has a great influence on the water body. The average concentrations of Cd and Pb in the river section were taken as the analysis index, which increased nearly linearly within 24 h under flow disturbance. The ratio of the average content of Cd at 24 h to the initial average content is: 0.185÷0.002=92.5, while the ratio of the average content of Pb to the initial average content is: 5.9÷0.012=491.7. Under the flow disturbance for 2 h, the concentration of Cd in the water is ten times of the initial content. Compared with the surface water environmental quality standard [33] shown in Table 6, it can be observed that the concentration of Cd exceeds surface water Class I standard; meanwhile, the content of Pb exceeds surface water Class V standard. Under the flow disturbance for 3 h, the concentration of Cd in water exceeds surface water Class V standard. In conclusion, when the release of heavy metals in sediments occurs, it can quickly affect the overlying water in a short time, and result in a significant deterioration of the water quality. Furthermore, the influence will gradually deepen as the disturbance continues.
Table 4 Relevant parameters in numerical simulation
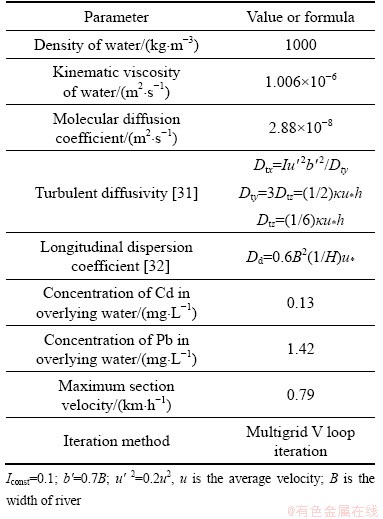

Fig. 6 Content of Cd in sediments at different time

Fig. 7 Content of Pd in sediments at different time
Table 5 Relative deviation between simulation value and field survey result
In order to explore the spatial and temporal distribution of heavy metals Cd and Pb released into water from the sediment, the average concentration of heavy metals in vertical direction was investigated at 3, 6, 12, 18 and 24 h after the disturbance of water flow, as shown in Fig. 9. The distribution discipline of the heavy metals in the vertical direction is basically the same at different time. The diffusion range of Cd is mainly concentrated in the water body within 8 m above the sediment, and before 6 h, the water body more than 15 m above the sediments can meet surface water Class V standard. Since then, Cd has continued to diffuse upward. At 24 h, the water body more than 18 m high from the bottom of the riverbed can reach surface water Class V standard.
The distribution of Pb in the vertical direction can be divided into three regions according to the magnitude of the average concentration: 103, 102 and 101. Before 3 h, the average concentration of Pb was in the magnitude of 103 within 3 m above the sediment, the magnitude of 102 from 3 to 8 m and the concentration at other heights is in the third range. From 3 to 24 h, the diffusion area with a magnitude of 103 further increased in the calculation area, and the concentration increase is obvious in the heights of 3 to 7 m from the sediment, where the Pb concentration at 24 h is more than 1.5 times that at 3 h. Within 24 h of monitoring, the average concentration of Pb in water will reach surface water Class V standard more than 18 m above the sediment.
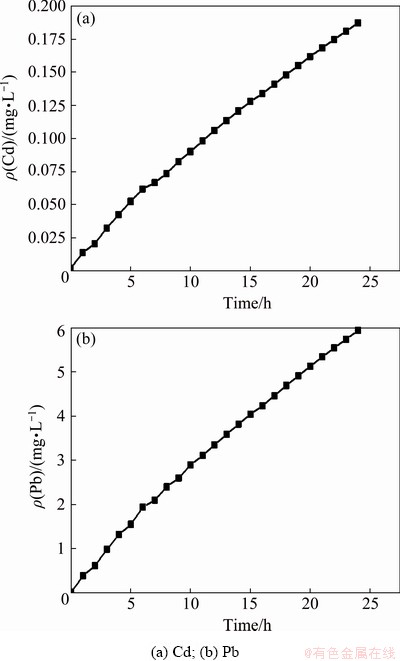
Fig 8 Average concentration of heavy metals in water body
Table 6 Environmental quality standards for surface water at pH 6-9 (mg/L)
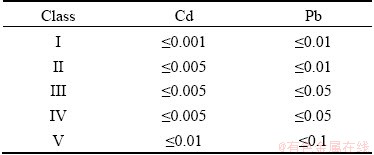
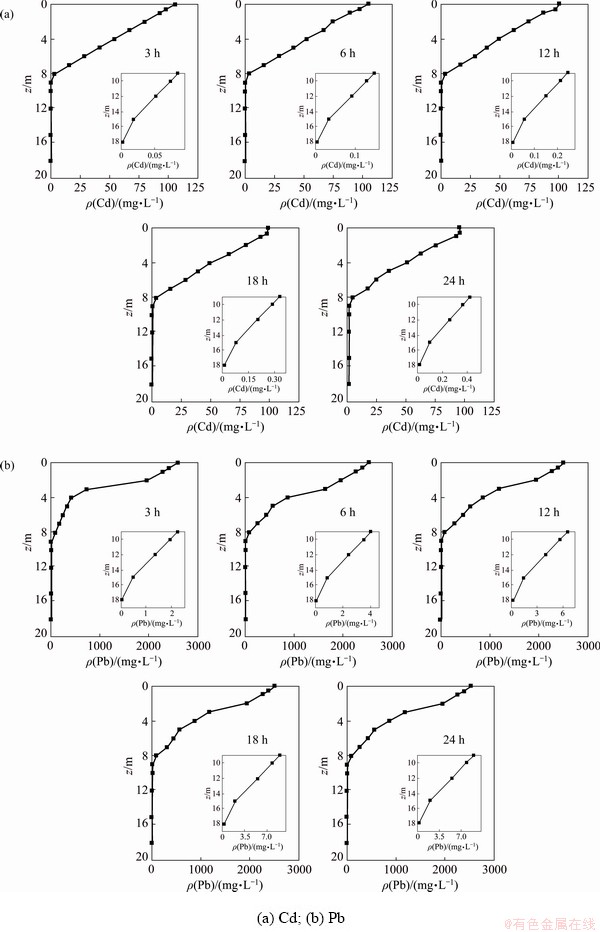
Fig. 9 Vertical distribution of heavy metals in river at different time
The average concentration of heavy metals in water body 8 m high from the bottom of the riverbed is analyzed by zoning. As shown in Fig. 10, regions A, B, C, D and E are the overlying waters corresponding to the riverbed sediment subsection area, in which E is the upstream and A is the downstream. Because of the difference in heavy metal contaminants in sediments, there is a significant difference in pollutant content in each water area during the release process. At the early stage of release, the heavy metal concentration in the corresponding upper water is directly related to that in the sediment, where the concentrations of Cd and Pb in sediments are large, the concentration in the water above is also large. Over time, the concentration in the water will change significantly due to the migration and diffusion of heavy metals. In the waters above the sediment with large heavy metal concentration, the concentration tends to decrease. However, in the adjacent downstream waters, the concentration will slowly increase with time. It can be concluded that concentration of the heavy metals in the sediment is the main reason affecting the degree of heavy metals pollution in water within 24 h after the release of heavy metals from the sediment. After a dynamic equilibrium is reached from the release process, the migration and diffusion of heavy metals in water gradually play a leading role carried by suspended particles in the river environment [34].
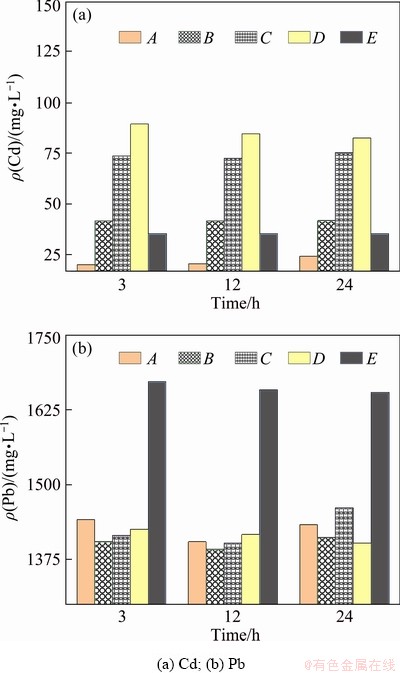
Fig. 10 Average concentration of heavy metals in water body 8 m high from bottom of riverbed within 24 h
4 Conclusions
(1) Based on the indoor experiment, the release law of heavy metals Cd and Pb in sediments at different flow rates was observed to be basically the same, which is divided into two stages, the rapid release section and the dynamic equilibrium section.
(2) With the increase of the flow rate, the release rates of Cd and Pb in the rapid release section gradually increase, and the heavy metal content in the overlying water body increases at dynamic equilibrium. The release processes of Cd and Pb in sediments are well matched with the pseudo second-order kinetic equation.
(3) The numerical simulation demonstrates that the heavy metals Cd and Pb in the sediments can rapidly diffuse into the overlying water body. The water quality in the area can exceed the surface water Class V standard less than 3 h and does not meet the surface water Class V standard until the height of 18 m above the sediment at 24 h.
(4) The content of heavy metals Cd and Pb in sediments after 24 h in the numerical simulation results are in good agreement with the field survey results. All but one of the relative deviations are within ±10%, which verifies the reasonability and feasibility of the mathematical model established.
Acknowledgments
The authors are grateful for the financial supports from the National Key R&D Program of China (2018YFC1903301).
References
[1] HU Jin, MENG De-long, LIU Xue-duan, LIANG Yi-li, YIN Hua-qun, LIU Hong-wei. Response of soil fungal community to long-term chromium contamination [J]. Transactions of Nonferrous Metals Society of China, 2018, 28(9): 1838-1846.
[2] WU Chuan, HUANG Liu, XUE Sheng-guo, PAN Wei-song, ZOU Qi, HARTLEY W, MO Jing-yu. Effect of arsenic on spatial pattern of radial oxygen loss and iron plaque formation in rice [J]. Transactions of Nonferrous Metals Society of China, 2017, 27(2): 413-419.
[3] ZHANG Hai-qing, YANG Yu-you, YI Yu-cheng. Effect of sulfate erosion on strength and leaching characteristic of stabilized heavy metal contaminated red clay [J]. Transactions of Nonferrous Metals Society of China, 2017, 27(3): 666-675.
[4] DUODU G O, GOONETILLEKE A, AYOKO G A. Comparison of pollution indices for the assessment of heavy metal in Brisbane River sediment [J]. Environmental Pollution, 2016, 219: 1077-1091.
[5] XU Zhong-shuo, LI Jin-jun, PAN Yu-ying, CHAI Xiao-li. Human health risk assessment of heavy metals in a replaced urban industrial area of Qingdao, China [J]. Environmental Monitoring and Assessment, 2016, 188(4): 1-12.
[6] TANG Jia-yi, ZHANG Li-hua, ZHANG Jia-chao, REN Li-heng, ZHOU Yao-yu, ZHENG Yuan-yuan, LUO Lin, YANG Yuan, HUANG Hong-li, CHEN An-wei. Physicochemical features, metal availability and enzyme activity in heavy metal-polluted soil remediated by biochar and compost [J]. Science of the Total Environment, 2020, 701: 134751-134751.
[7] PENG Jian-feng, SONG Yong-hui, YUAN Peng, CUI Xiao-yu, QIU Guang-lei. The remediation of heavy metals contaminated sediment [J]. Journal of Hazardous Materials, 2009, 161(2-3): 633-640.
[8] TANG Jia-yi, ZHANG Jia-chao, REN Li-heng, ZHOU Yao-yu, GAO Jun, LUO Lin, YANG Yuan, PENG Qing-hui, HUANG Hong-li, CHEN An-wei. Diagnosis of soil contamination using microbiological indices: A review on heavy metal pollution [J]. Journal of Environmental Management, 2019, 242: 121-130.
[9] FENG Xiong-han, ZHAI Li-mei, TAN Wen-feng, LIU Fan, HE Ji-zheng. Adsorption and redox reactions of heavy metals on synthesized Mn oxide minerals [J]. Environmental Pollution, 2007, 147(2): 366-373.
[10] ZHAO Shou, FENG Cheng-hong, WANG Dong-xin, LIU Yan-zhen, SHEN Zhen-yao. Salinity increases the mobility of Cd, Cu, Mn, and Pb in the sediments of Yangtze Estuary: Relative role of sediments’ properties and metal speciation [J]. Chemosphere, 2013, 91(7): 977-984.
[11] SHEA D. Developing national sediment quality criteria [J]. Environmental Science and Technology, 1988, 22(11): 1256-1261.
[12] NICKEL M, VANDIEKEN V, BRüCHERT V, JORGENSEN B B. Microbial Mn (IV) and Fe (III) reduction in northern Barents Sea sediments under different conditions of ice cover and organic carbon deposition [J]. Deep Sea Research, Part II: Topical Studies in Oceanography, 2008, 55(20-21): 2390-2398.
[13] CHAI Li-yuan, LI Huan, YANG Zhi-hui, MIN Xiao-bo, LIAO Qi, LIU Yi, MEN Shu-hui, YAN Ya-nan, XU Ji-xin. Heavy metals and metalloids in the surface sediments of the Xiangjiang River, Hunan, China: Distribution, contamination, and ecological risk assessment [J]. Environmental Science and Pollution Research International, 2017, 24(1): 874-885.
[14] TSAI C H, LICK W. A portable device for measuring sediment resuspension [J]. Journal of Great Lakes Research, 1986, 12(4): 314-321.
[15] SUN Zhen-hong, XU Guo-hui, HAO Ting, HUANG Zhe, FANG Hong-ru, WANG Gang. Release of heavy metals from sediment bed under wave-induced liquefaction [J]. Marine Pollution Bulletin, 2015, 97(1-2): 209-216.
[16] BAKER R A. Contaminants and Sediments, Volume 1: Fate and transport, case studies, modeling, toxicity [M]. Ann Arbor, Michigan: Ann Arbor Science, 1980.
[17] MAHDAVI A, KASHEFIPOUR S M, OMID M H. Effect of sorption process on cadmium transport [C]//Proceedings of the Institution of Civil Engineers Water Management. London: Thomas Telford Ltd, 2013, 166(3): 152-162.
[18] SERRANO-PACHECO A, MURILLO J, GARCIA- NAVARRO P. Finite volumes for 2D shallow-water flow with bed-load transport on unstructured grids [J]. Journal of Hydraulic Research, 2012, 50(2): 154-163.
[19] ZAGAR D, KNAP A, WARWICK J J, RAJAR R, HORVAT M, CETINA M. Modelling of mercury transport and transformation processes in the Idrijca and Soca river system [J]. Science of the Total Environment, 2006, 368(1): 149-163.
[20] ZHANG Wei-guo, FENG Huan, CHANG Jin-na, QU Jian-guo, XIE Hong-xia, YU Li-zhong. Heavy metal contamination in surface sediments of Yangtze River intertidal zone: An assessment from different indexes [J]. Environmental Pollution, 2009, 157(5): 1533-1543.
[21] HAN De-ming, CHENG Jin-ping, HU Xian-feng, JIANG Zhen-yi, MO Lei, XU Hao, MA Yu-ning, CHEN Xiao-jia, WANG He-ling. Spatial distribution, risk assessment and source identification of heavy metals in sediments of the Yangtze River Estuary, China [J]. Marine Pollution Bulletin, 2017, 115(1-2): 141-148.
[22] HUANG Shun-hong. Fractional distribution and risk assessment of heavy metal contaminated soil in vicinity of a lead/zinc mine [J]. Transactions of Nonferrous Metals Society of China, 2014, 24(10): 3324-3331.
[23] ZHOU Rui-yuan. Migration and transformation of phosphorus and heavy metal in sediment in drinking water reservoir [D]. Xi’an: Xi’an University of Architecture and Technology, 2014. (in Chinese)
[24] LIU Jin-jun. The characteristics research of heavy metals pollution in sediments of the Xiangjiang River [D]. Xiangtan: Xiangtan University, 2016. (in Chinese)
[25] HO Y S, MCKAY G. Pseudo-second order model for sorption processes [J]. Process Biochemistry, 1999, 34(5): 451-465.
[26] CHIEN S H, CLAYTON W R. Application of Elovich equation to the kinetics of phosphate release and sorption in soils [J]. Soil Science Society of America Journal, 1980, 44(2): 265-268.
[27] FANG Hong-wei, LIU Bin, HUANG Bing-bin. Diagonal Cartesian method for the numerical simulation of flow and suspended sediment transport over complex boundaries [J]. Journal of Hydraulic Engineering, 2006, 132(11): 1195-1205.
[28] RASTOGI A K, RODI W. Predictions of heat and mass transfer in open channels [J]. Journal of the Hydraulics Division, 1978, 104(3): 397-420.
[29] CAO Zhi-xian, HU Peng-hui, HU Kai-heng, PENDER G, LIU Qing-quan. Modelling roll waves with shallow water equations and turbulent closure [J]. Journal of Hydraulic Research, 2015, 53(2): 161-177.
[30] ZHAO Mind-deng, HUAI Wen-xin, LI Tai-ru. Study of velocity profile of uniform flow in open channels [J]. Engineering Journal of Wuhan University, 2010, 43(5): 554-557. (in Chinese)
[31] YAO Shi-ming, LU Jin-you, XU Hai-tao. Study on turbulent diffusion coefficient in natural river [J]. Journal of Yangtze River Scientific Research Institute, 2008, 25(1): 12-15. (in Chinese)
[32] KOUSSIS A D. RODRIGUEZ-MIRASOL J. Hydraulic estimation of dispersion coeffeient for streams [J]. Journal of Hydraulic Engineering, 1998, 124(3): 317-320.
[33] Ministry of Environmental Protection of the People’s Republic of China, State Administration for Quality Supervision and Inspection and Quarantine of China. Environmental Quality Standards for Surface Water (GB/T 3838―2002) [S]. Beijing: China Environmental Science Press, 2002. (in Chinese)
[34] CHEN Ming, LI Feng-guo, TAO Mei-xia, HU Lan-wen, SHI Yan-li, LIU You-cun. Distribution and ecological risks of heavy metals in river sediments and overlying water in typical mining areas of China [J]. Marine Pollution Bulletin, 2019, 146: 893-899.
闫红杰1,张河杨1,史雅君1,周 萍1,李 欢2,3,伍东玲1,刘 柳1
1. 中南大学 能源科学与工程学院,长沙 410083;
2. 中南大学 冶金与环境学院,长沙 410083;
3. 长沙环境保护职业技术学院,长沙 410004
摘 要:采用实验研究与数值模拟相结合的方法,研究某水域底泥中典型重金属污染物Cd与Pb再释放过程和释放速率。结果表明,底泥中Cd和Pb的释放规律分为快速释放和动态平衡两个阶段,与准二级动力学方程具有较好的匹配度,相关系数R2大于0.99。随着河流流速的加快,底泥中重金属的释放速率增大。分析表明,该区域水质可以在3 h内超过地表水环境质量V类标准。数值模拟结果与实测值之间的相对偏差除一项外均在±10%以内。
关键词:底泥;重金属污染;再释放率;数值模拟
(Edited by Xiang-qun LI)
Corresponding author: Liu LIU; Tel: +86-731-88830239; E-mail: l.liu@csu.edu.cn
DOI: 10.1016/S1003-6326(21)65494-8
1003-6326/ 2021 The Nonferrous Metals Society of China. Published by Elsevier B.V. & Science Press

