Trans. Nonferrous Met. Soc. China 24(2014) 2911-2919
Phase field model for strong interfacial energy anisotropy of HCP materials
Xun-feng YUAN1,2, Bao-ying LIU1, Chun LI2, Chun-sheng ZHOU2, Yu-tian DING3
1. College of Electronic Information and Electrical Engineering, Shangluo University, Shangluo 726000, China;
2. Shaanxi Key Laboratory of Comprehensive Utilization of Tailing Resources, Shangluo University, Shangluo 726000, China;
3. State Key Laboratory of Gansu Advanced Nonferrous Metal Materials, Lanzhou University of Technology, Lanzhou 730050, China
Received 12 August 2013; accepted 12 November 2013
Abstract: Based on the Karma model and the Eggleston regularization technique of the strong interfacial energy anisotropy, a phase-field model was established for HCP materials. An explicit finite difference numerical method was used to solve phase field model and simulate the dendrite growth behaviors of HCP materials. Results indicate that the dendrite morphology presents obvious six-fold symmetry, and discontinuity in the variation of interface orientation occurs, resulting in a fact that the corners were formed at the tips of the main stem and side branches. When the interfacial energy anisotropy strength is lower than the critical value(1/35), the steady-state tip velocity of dendrite increases with anisotropy as expected. As the anisotropy strength crosses the critical value, the steady-state tip velocity drops down by about 0.89%. With further increase in anisotropy strength, the steady-state tip velocity increases and reaches the maximum value at anisotropy strength of 0.04, then decreases.
Key words: phase field; dendrite growth; interfacial energy; anisotropy strength; HCP materials
1 Introduction
Dendrites are common patterns observed after the solidification of a melt. They influence the microstructure and mechanical properties of materials obtained by casting [1]. Interfacial energy anisotropy is a very important parameter to influence the growth morphology of dendrite. When the interfacial energy anisotropy is weak, the morphology of dendrite is smooth and includes all possible orientations. As the reinforcement of anisotropy, the morphology of dendrite presents distortion [2]. Therefore, a better understanding of dendrite growth for strong interfacial energy anisotropy is an important theoretical and practical problem.
In the past decade, the phase field method has been intensively studied as a model taken into account the strong interfacial energy anisotropy for solidification processes. In 2001, EGGLESTON et al [3] proposed a modification phase field method for the strong interfacial energy and originally studied a faceted dendrite growth. Subsequently, KASAJIMA et al [4] and KIM et al [5] made lots of researches on a facet dendrite of pure materials. SUZUKI et al [6] modeled the faceted dendrite growth of the Si-Ni alloy, and their simulation results were similar to the experimental observations. XIAO et al [7] and YUAN and DING [8,9] simulated the dendrite growth of Ni-Cu alloy with strong interfacial energy anisotropy in a forced flow. CHEN et al [10,11] further researched the influence of anisotropy strength and flow velocity on facet dendrite growth of the pure material and binary alloys. TORABI et al [12] presented a new regularized anisotropic Cahn-Hilliard phase field equation. These researches were mainly focused on the FCC structure materials and the function of interfacial energy anisotropy has four-fold symmetry. The research of HCP structure almost wholly confined to weaker interfacial energy anisotropy. BOTTGER et al [13] used the phase field method coupled to thermodynamic databases to simulate equiaxed solidification processes for ternary magnesium alloys. MIAO et al [14] analyzed the influence of phase filed parameters on dendritic morphology of magnesium alloys. YUAN et al [15] further researched the single- and multi-grain dendrite growth of magnesium alloys in a forced flow. QIN et al [16] discovered that the apparent rate of crystal growth as a function of orientation in the phase field simulation of HCP metals agrees with predictions made by surface energy theory. In these simulation calculations, the interfacial energy anisotropy largely influences the dendrite growth morphology and the stability of the results. However, the study on dendrite growth morphology of HCP materials for strong interfacial energy anisotropy has been less much more reported.
In this work, the dendrite growth process of HCP materials was simulated by phase field model considering the strong interfacial energy anisotropy. The effects of interfacial energy anisotropy strength on dendrite growth were investigated in detail.
2 Effect of interfacial energy anisotropy on equilibrium shape
As to a complete description of dendrite growth simulation, the anisotropy of solid-liquid interface must be considered. In the research, the interfacial energy anisotropy effect will take into account by assuming an angular dependence of gradient energy coefficient [2] as follows:
 (1)
(1)
where θ is the angle between the interface normal and principal axis direction of dendrite; w0 is a constant; k is the modulus of anisotropy, and the value is 6 for HCP materials; εk is the strength of interfacial energy anisotropy; f(θ) is the gradient energy function.
2.1 Function of interfacial energy anisotropy
Figure 1 shows that the relationship between  and θ with different interfacial energy anisotropy strengths in rectangular coordinates. When graphed, this f(θ) function produces an ever-repeating wave of peaks and valleys, in which ε6 values equal 0.02 and 0.1, and the extremums of function are different. Figure 2 shows that ε6has influence on the shapes of f(θ) in polar coordinates. At ε6 of 0.02, the curves are smooth and overall presentation is elliptical in shape. When the ε6is equal to 0.1, the protuberances bringing on the locals of θ are 0°, 60°, 120°, 180°, 240°, 300°, and the shape of f(θ) changes from elliptical to star-like shape.

Fig. 1 Relationship between f(θ) and θ in rectangular coordinates
Figure 3 illustrates missing orientations using 1/f(θ) plot and tangent lines for ε6=0.1. According to inversion method [17], if the 1/f(θ) plot is convex, then all of its tangent lines will lie outside, and all orientations will appear in the equilibrium shape. Otherwise, there will be missing orientations and “ears” occur. If the 1/f(θ) plot is non-convex, we can convexity it by adding tangent lines. The portions of the 1/f(θ) between these tangent lines(see line AB in Fig. 3) and the origin will correspond to missing orientations, and all other orientations will appear.
In two dimensions, the curvature of 1/f(θ) is
 (2)
(2)
where a subscript θ denotes differentiation with respect to θ. Defining interface stiffness S(θ)=f+fθθ=1-35ε6cos(6θ), convexity is lost, whenever
 (3)
(3)
The shape of S(θ) with different ε6 in polar coordinates is shown in Fig. 4. At ε6 of 0.02, all the values of S(θ) were positive, and the curve displays obviously six-fold symmetry. When ε6>1/(k2-1), the value of S(θ) was negative at some positions in anisotropy strengthened, and the curve is sunken corresponding to missing orientations(see Fig. 4(b)).

Fig. 2 Shapes of f(θ) with different ε6in polar coordinates

Fig. 3 Determination of missing orientations using 1/f(θ) plot and tangent lines for ε6=0.1

Fig. 4 Shapes of S(θ)with different ε6in polar coordinates
The curve of 1/f(θ) displays six-fold symmetry and its cycle is π/3 as shown in Fig. 3. Restricting attention to the sextant |θ|≤π/6, all orientations will appear on the equilibrium shape over the range of θm≤|θ|≤π/6, but the missing of orientations occurs over the range of |θ|<θm. In order to obtain the equilibrium morphology without so-called “ears” corresponding to the missing orientation, we adopted the method reported by EGGLESTON et al [3] to regularize the function of interfacial energy anisotropy:
 (4)
(4)
The regularized interface stiffness is as follows:
 (5)
(5)
2.2 Determination of the first missing orientation
Considering the vertical tangent line on the right side of the figure, the angles at the tangent points (A and B) are extrema in the abscissa coordinate (see Fig. 3):
 (6)
(6)
The first missing orientation, θm, follows from Eq. (6) and therefore satisfies
 (7)
(7)
We can solve the equation and get the value of θm.
2.3 Equilibrium shapes of crystals
In two dimensions, the equilibrium shape of crystals can be determined by the following formulas [18]:
 (8)
(8)
where X and Y are dimensionless distances and A is a constant.
For the function of interfacial energy anisotropy, the equilibrium shape of crystals follows from Eq. (8) and therefore satisfies
 (9)
(9)
The equilibrium shape of crystals changes with the variety of ε6 as shown in Fig. 5. It can be found that, when ε6≤1/35, all orientations appear on the equilibrium shape and the crystal shape is smooth and continuous. When ε6>1/35, some orientations with strong interfacial energy disappear from the equilibrium shape, the interface of the preferential growth direction tip becomes discontinuous, where “ears” occur. These “ear” parts enlarge with increase in the interfacial energy anisotropy. After the f(θ) is regularized, the “ear” parts degenerate into a point.

Fig. 5 Equilibrium shapes of crystals with different ε6
3 Phase field model
Based on the Karma model [19] and the Eggleston regularization technique [3] of the strong interfacial energy anisotropy, a new phase-field model is presented to simulate dendrite shape for HCP materials. Phase-field and thermal field equations are given by for θm≤|θ|≤π/6,


 (10)
(10)
for |θ|<θm,


 (11)
(11)
 (12)
(12)
where u=(T-Tm)/(L/cp) is a dimensionless thermal variable; λ is a coupling parameter between the phase field and the thermal field;  is the phase field variable; Tm, L and cp are the melting point, latent and specific heat, respectively; D=ατ0/w02 is the dimensionless thermal diffusivity; t is dimensionless time; τ0 is the mean of relaxation time; α is the thermal conductivity.
Using an asymptotic expansion, the capillary length d0 and the kinetic coefficient expression β are related to the phase field parameters [19] as follows:
 (13)
(13)
 (14)
(14)
where a1 and a2 are constant and depend on the double- well potential and other functions of the phase field equation. In this work, we used the values from Ref. [19], a1=0.8839 and a2=0.6267. Therefore, the interface kinetics can be eliminated by choosing λ=D/a2.
4 Numerical simulation
4.1 Initial conditions and boundary conditions
A square computational domain of sizes 600×600 grids is used in the simulations. An initial crystal is in a undercooled melt and its radius is assumed to be R0. For the phase field and thermal field u are taken as Zero-Neumann boundary conditions. The initial conditions are given by
 (15)
(15)
where X is the (100) direction and Y is the (010) direction [20], Δ is a dimensionless undercooling.
4.2 Simulation method
For the numerical calculation, Eqs. (10)-(12) are made discrete on the uniform grids using explicit finite difference methods. The space steps ΔX and time steps Δt should comply with ΔX≤w0 and Δt≤τ0(ΔX)2/(4w02), respectively.  is made discrete by a nine-point formula with the nearest and next nearest neighbors, which reduces the grid anisotropy.
On the basis of the phase field model mentioned above, a program for two-dimensional dendrite growth was written in Visual C++ to simulate the evolution of crystal growth for HCP materials. For convenience, the following parameters were chosen: time steps Δt=0.01, space steps ΔX=ΔY=0.6, Δ=-0.55, d0=0.139, w0=τ0=1, ε6=0.1, λ=6.359, D=4.0, R0=5ΔX. Unless otherwise state, these phase field parameters are not varied.
5 Results and discussion
5.1 Dendrite growth for strong interfacial energy anisotropy
Figure 6 shows the phase field and thermal field profile of dendrite growth for HCP materials with strong interfacial energy anisotropy. From Fig. 6(a), it can be seen that dendrite growth along <110> crystallographic directions and six preferential growth orientations exist in the two-dimensional XY-plane. The root region of main branch is smooth and includes all possible orientations. At the tips of the main stem and side branches, discontinuity in the variation of interface orientation occurs due to the presence of missing orientations, solid-liquid interface becomes unstable, resulting in the corners formed at the corresponding places. Figure 6(b) shows the thermal field profile of dendrite growth corresponding to phase field morphology in Fig. 6(a). Under strong interfacial energy anisotropy conditions, the thermal diffusion layer around the dendrite tip is thin, and the thermal diffusion is timely, leading to the dendrite growing rapidly. Furthermore, in the root of main branch between the dendrite arms, the thermal diffusion is difficult, leading to the dendrite growing slowly.
5.2 Effect of interfacial energy anisotropy strength
Figure 7 shows the phase field morphology of dendrite growth at various interfacial energy anisotropy strengths. When the interfacial energy anisotropy is lower than the critical value (1/35), the variation of interface orientation is continuity, the protuberances appear on the tips of the principal branch but they grow slowly, and the equilibrium morphology of the crystal is smooth (see Figs. 7(a) and (b)). As the interfacial energy anisotropy becomes larger than the critical value, the variation of interface orientation is discontinuous, and the corners are formed at the tips of the main branches and side branches of the dendrites (see Fig. 7(c)). With further increase in interfacial energy anisotropy, the principal branches grow slowly and side branches disappear due to geometrical restrictions arising from the presence of missing orientations.

Fig. 6 Dendrite growth of HCP materials with strong interfacial energy anisotropy

Fig. 7 Phase field morphologies of dendrite growth for various interfacial energy anisotropy strengths
Figure 8 shows the relationship between the dendrite arm tip temperature and velocity vs time at various interfacial energy anisotropy strengths. With increasing solidification time, the tip temperature of dendrite increases gradually, namely, undercooling decreases, leading to the arm tip velocity of dendrite decreasing gradually. Finally, the dendrite arm tip temperature and velocity at various interfacial energy anisotropy strengths tend to be stable.
Figure 9 shows the effect of interfacial energy anisotropy strength ε6 on dendrite growth. When the interfacial energy anisotropy is lower than the critical value, the steady-state tip velocity of dendrite increases with anisotropy as expected, and the tip temperature and radius of dendrite decrease. As the anisotropy strength crosses the critical value(1/35), the steady-state tip velocity drops down by about 0.89% (see Fig. 9(b)), and the tip temperature and radius rise by about 0.20% and 1.14%, respectively. With further increase in anisotropy strength, the steady-state tip velocity increases and reaches the maximum value at anisotropy strength of 0.04, then tends to decrease, and the dendrite arm tip temperature and velocity tend to be stable.
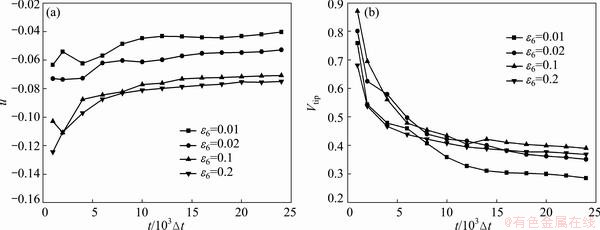
Fig. 8 Dendrite arm tip temperature (a) and velocity (b) vs time at various interfacial energy anisotropy strengths
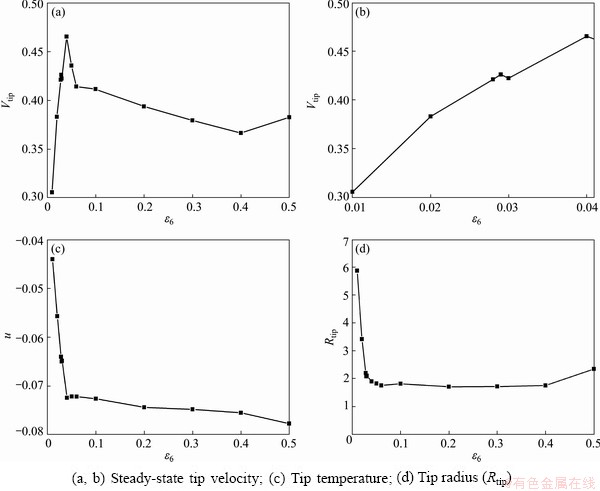
Fig. 9 Effect of interfacial energy anisotropy strength ε6 on dendrite growth
Figure 10 shows the dendrite tip missing orientation angle for various interfacial energy anisotropy strengths. With increase in anisotropy above the critical value, the range of missing orientations increases linearly and then increases parabolically, and the tip velocity of dendrite decreases first quickly, then slowly. Thus, the decrease in tip velocity in strong interfacial energy anisotropy region may result from the increase in the range of missing orientations.

Fig. 10 Dendrite tip missing orientation angle for various interfacial energy anisotropy strengths
6 Conclusions
1) Under strong interfacial energy anisotropy conditions, the dendrite morphology presents obvious six-fold symmetry, at the tips of the main stem and side branches, discontinuity in the variation of interface orientation occurs, resulting in the corners formed at the corresponding places.
2) When the interfacial energy anisotropy strength is lower than the critical value, the equilibrium morphology of the crystal is smooth, the steady-state tip velocity of dendrite increases with anisotropy as expected, but the tip temperature and radius of dendrite decrease. As the anisotropy strength crosses the critical value (1/35), the variation of interface orientation is discontinuous, the steady-state tip velocity drops down by about 0.89%, the tip temperature and radius rise by about 0.20% and 1.14%, respectively. With further increase in anisotropy strength, the steady-state tip velocity increases and reaches the maximum value at anisotropy strength of 0.04, then decreases, and the dendrite arm tip temperature and velocity tend to be stable.
3) With increase in interfacial energy anisotropy above the critical value, the range of missing orientations increases linearly and then increases parabolically, the tip velocity of dendrite decreases first quickly, then slowly. Thus, the decrease in tip velocity may result from the increase in the range of missing orientations.
References
[1] MEDVEDEV D, KASSNER K. Lattice-Boltzmann scheme for dendrite growth in presence of convection [J]. J Cryst Growth, 2005, 275(1-2): 1495-1500.
[2] ZHANG G W, HOU H, CHENG J. Phase field model for strong anisotropy of kinetic and highly anisotropic interfacial energy [J]. Transactions of Nonferrous Metals Society of China, 2006, 16(S2): s307-s313.
[3] EGGLESTON J J, MCFADDEN G B, VOORHEES P W. A phase-field model for highly anisotropic interfacial energy [J]. Physica D, 2001, 150(1-2): 91-103.
[4] KASAJIMA H, NAGANO E, SUZUKI T, KIM S G, KIM W T. Phase-field modeling for facet dendrite growth of silicon [J]. Sci Technol Adv Mater, 2003, 4(6): 553-557.
[5] KIM S G, KIM W T. Phase field modeling of dendrite growth with high anisotropy [J]. J Cryst Growth, 2005, 275(1-2): 355-360.
[6] SUZUKI T, KIM S G, KIM W T. Two-dimensional facet crystal growth of silicon from undercooled melt of Si-Ni alloy [J]. Mater Sci Eng A, 2007, 449: 99-104.
[7] XIAO R Z, WANG Z P, ZHU C S, LI W S, FENG L. Influence of anisotropy on dendritic growth in binary alloy with phase-field simulation [J]. ISIJ International, 2009, 49(8): 1156-1160.
[8] YUAN Xun-feng, DING Yu-tian. Phase-field simulation of dendrite growth process for binary Ni-Cu alloy with anisotropy of strong interface energy [J]. The Chinese Journal of Nonferrous Metals, 2011, 21(7): 1656-1663. (in Chinese)
[9] YUAN Xun-feng, DING Yu-tian. Phase field simulation of dendrite growth for binary alloy with strong anisotropy [J]. The Chinese Journal of Nonferrous Metal, 2011, 21(9): 2216-2222. (in Chinese)
[10] CHEN Z, CHEN C L, HAO L M. Numerical simulation of facet dendritic growth in a forced flow [J]. Can J Phys, 2009, 87(2): 117-123.
[11] CHEN Z, HAO L M, CHEN C L. Simulation of faceted dendrite growth of non-isothermal alloy in forced flow by phase field method [J]. J Cent South Univ Technol, 2011, 18(6): 1780-1788.
[12] TORABI S, LOWENGRUB J, VOIGT A, WISE S. A new phase-field model for strongly anisotropic systems [J]. Proceedings of the Royal Society A, 2009, 465(2105): 1337-1359.
[13] BOTTGER B, EIKEN J, STEINBACH I. Phase field simulation of equiaxed solidification in technical alloys [J]. Acta Mater, 2006, 54(10): 2679-2704.
[14] MIAO Jia-ming, JING Tao, LIU Bai-cheng. Numerical simulation of dendritic morphology of magnesium alloys using phase field method [J]. Acta Metall Sin, 2008, 44(4): 483-488. (in Chinese)
[15] YUAN Xun-feng, DING Yu-tian, GUO Ting-biao, HU Yong. Numerical simulation of dendritic growth of magnesium alloys using phase-field method under forced flow [J]. The Chinese Journal of Nonferrous Metals, 2010, 20(8): 1474-1480. (in Chinese)
[16] QIN R S, BHADESHIA H K D H. Phase-field model study of the crystal morphological evolution of hcp metals [J]. Acta Mater, 2009, 57(11): 3382-3390.
[17] SEKERKA R F. Analytical criteria for missing orientations on three-dimensional equilibrium shapes [J]. J Cryst Growth, 2005, 275(1-2): 77-82.
[18] BURTON W K, CABRERA N, FRANK F C. The growth of crystals and the equilibrium structure of their surfaces [J]. Phil Trans R Soc, 1951, 243(866): 299-358.
[19] KARMA A, RAPPLE W J. Phase field method for computationally efficient modeling of solidification with arbitrary interface kinetics [J]. Phys Rev E, 1996, 53(4): 3017-3020.
[20] TONHARDT R, AMBERG G. Phase-field simulation of dendritic growth in a shear flow [J]. J Cryst Growth, 1998, 194(3-4): 406-425.
HCP材料强界面能各向异性的相场模型
袁训锋1,2,刘宝盈1,李 春2,周春生2,丁雨田3
1. 商洛学院 电子信息与电气工程学院,商洛 726000;
2. 商洛学院 陕西省尾矿资源综合利用重点实验室,商洛 726000;
3. 兰州理工大学 甘肃省有色金属新材料省部共建国家重点实验室,兰州 730050
摘 要:基于Karma模型和Eggleston修正强界面能各向异性的方法,建立HCP材料的强界面能各向异性相场模型。采用有限差分法对控制方程进行数值求解,模拟研究HCP材料的枝晶生长行为。结果表明:枝晶形貌呈现出明显的六重对称性,界面方向不连续,导致在主枝和侧枝的尖端出现棱角。当界面能的各向异性强度低于临界值(1/35)时,枝晶尖端稳态生长速度随着各向异性强度的增加而增加;当界面能各向异性强度值超过临界值时,尖端稳态生长速度降低0.89%;当进一步增加各向异性强度值时,尖端稳态速度增加且在各向异性强度值为0.04时达到极大值,随后减小。
关键词:相场;枝晶生长;界面能;各向异性强度;HCP材料
(Edited by Xiang-qun LI)
Foundation item: Project (10834015)supported by the National Natural Science Foundation of China; Project (12SKY01-1)supported by the Doctoral Fund of Shangluo University, China
Corresponding author: Xun-feng YUAN; Tel: +86-914-2329420; E-mail: yuanyang2011@163.com
DOI: 10.1016/S1003-6326(14)63426-9

