�����軯����Һ�еĻ�Ͷۻ���Ϊ
��Դ�ڿ����й���ɫ����ѧ��(Ӣ�İ�)2015���10��
�������ߣ�Ahmet Deniz BAS Fariba SAFIZADEH Wei ZHANG Edward GHALI Yeonuk CHOI
����ҳ�룺3442 - 3453
Key words��pure gold; roasted gold ore; cyanide; passivation; electrochemical noise
ժ Ҫ���о�����ͱ��ս��缫��25 ��C���������軯������еĻ�Ͷۻ���Ϊ���ڽ����ٶ�Ϊ100 r/min��0.04 mol/L NaCN��Һ�еõ���ѭ���������ߺͶ���λ����������ʾ��ͬ�ķ�λ�ú͵����ܶȡ�����λ���Ա�����������ܶ����軯��Ũ�ȵ����Ӷ���������ӡ�pHֵ��10���ߵ�11���µ����ܶȴ���Ƚ��ͣ����������ٶȴ�100 r/min���͵�60 r/min���µ����ܶ��������������������£�����ͱ��ս��缫��ʾ��ͬ�ķ�λ�ú�ʴ���ʡ����λ���о���������pHֵΪ11ʱ������λ��1 V��ߵ�1.4 V�������ܶȽ���80%������1 Vʱ����pHֵ��11���͵�10�������ܶ�����1.7����������������γ��˸���Ч�Ķۻ��㡣������˥���ڼ�ĵ绯ѧ��������(ENM)���������ڸߵ�λʱ���ڶۻ��̶ȸ��ߣ��ʵ�״��ʴ������ENM�������������������ڸ��õ�Ӧ���ڽ�����о���XPS�о�֤���˶ۻ�������Ĵ��ڡ�
Abstract: Active and passive behaviors of pure gold (Au) and roasted gold ore (RGO) electrodes were investigated at 25 ��C in de-aerated agitated cyanide media. Cyclic voltammetry and potentiodynamic polarization with agitation at 100 r/min in 0.04 mol/L NaCN solution showed different peak positions and current densities. Potentiodynamic tests illustrate that the peak current densities increase greatly with increasing the cyanide concentration. Increasing the pH value from 10 to 11 resultes in a great decrease of current density, while it increases noticeably by decreasing the agitation from 100 to 60 r/min. In the presence of oxygen, Au and RGO electrodes show different characteristics of peak positions and corrosion rates. The potentiostatic studies show that increasing the potential from 1 to 1.4 V at pH value of 11 results in an 80% decrease of current density while decreasing the pH value from 11 to 10 at 1 V gives a 1.7 fold increase of current density, possibly due to more effective passive layer. Following polarization, electrochemical noise measurements (ENM) during decay periods show that Au results in more passive states at high potentials, showing pitting corrosion. The ENM results show that this technique can be a promising tool for a better understanding of gold leaching. The XPS studies prove the presence of passive oxides.
Trans. Nonferrous Met. Soc. China 25(2015) 3442-3453
Ahmet Deniz BAS1, Fariba SAFIZADEH1, Wei ZHANG1, Edward GHALI1, Yeonuk CHOI2
1. Department of Mining, Metallurgical and Materials Engineering, Laval University, Quebec G1V 0A6, Canada;
2. Barrick Gold Corporation, Suite 3700, 161 Bay Street P.O. Box 212 Toronto, Ontario M5J 2S1, Canada
Received 21 November 2014; accepted 11 February 2015
Abstract: Active and passive behaviors of pure gold (Au) and roasted gold ore (RGO) electrodes were investigated at 25 ��C in de-aerated agitated cyanide media. Cyclic voltammetry and potentiodynamic polarization with agitation at 100 r/min in 0.04 mol/L NaCN solution showed different peak positions and current densities. Potentiodynamic tests illustrate that the peak current densities increase greatly with increasing the cyanide concentration. Increasing the pH value from 10 to 11 resultes in a great decrease of current density, while it increases noticeably by decreasing the agitation from 100 to 60 r/min. In the presence of oxygen, Au and RGO electrodes show different characteristics of peak positions and corrosion rates. The potentiostatic studies show that increasing the potential from 1 to 1.4 V at pH value of 11 results in an 80% decrease of current density while decreasing the pH value from 11 to 10 at 1 V gives a 1.7 fold increase of current density, possibly due to more effective passive layer. Following polarization, electrochemical noise measurements (ENM) during decay periods show that Au results in more passive states at high potentials, showing pitting corrosion. The ENM results show that this technique can be a promising tool for a better understanding of gold leaching. The XPS studies prove the presence of passive oxides.
Key words: pure gold; roasted gold ore; cyanide; passivation; electrochemical noise
1 Introduction
Due to rapid depletion of free-milling gold ores, refractory gold ore processing has become ever important [1]. In practice, the refractoriness of ore leads to low gold extractions and high cyanide consumption [2,3]. In gold ore processing, the passivation of gold surface and/or the diffusion control are the practically faced problems. During cyanidation process and under certain conditions, gold surface is protected by a surface film, which causes poor gold extractions. There are several electrochemical measurement techniques to evaluate the anodic behavior of gold.
Passivation phenomenon of gold surface can be considered as one of the challenges in practical cyanidation and then a better understanding of this phenomenon is quite important. Two recently published papers [4,5] have considered the passive phenomenon of metals including gold during dissolution. HOLMES and CRUNDWELL [4] used pyrite sample and mentioned that polysulfides did not cause passivation. CRUNDWELL [5] claimed that each point on the surface was considered as both anodic site and cathodic site and concluded that there was no separation of anodic and cathodic sites on mineral surface. HABASHI [6] and HABASHI and BAS [7] pointed out that certain experimental results demonstrated the existence of anodic and cathodic zones during the dissolution of minerals. Moreover, AZIZI et al [8] examined the passive behavior of gold ore and concluded that all minerals directly affected the leaching of gold and pre-oxidation may be an effective option for gold dissolution. These studies show that active and passive behaviors of gold still receive high attention and need to be examined.
In the case of gold, to date, some electrochemical techniques have been used to monitor anodic behavior of gold. Cyclic voltammetry (CV) [9,10] and potentiodynamic techniques [11-13] were used by some research groups for the observation of interfacial reactions. LIN and CHEN [9] used relatively high cyanide concentration (0.2 mol/L) as compared with leaching practice when using cyclic voltammetry testing with rotating disk electrode at 500 r/min in oxygen-free electrolyte. Three oxidation and one reduction peaks were observed. MUGHOGHO and CRUNDWELL [10] employed cyclic voltammetry of rotating disk gold electrode at 1000 r/min and scan rate of 100 mV/s using dilute cyanide solution (0.003 mol/L). Three oxidation peaks, one reduction and one small oxidation peaks in the return sweep were obtained with relatively low current density in this rarely used dilute solution in practice. In the previous potentiodynamic studies, the effects of cyanide concentration and pH value were tested and found that in most cases, gold had three oxidation peaks and certain intermediate reactions were advanced [14,15]. MACARTHUR [16] mentioned the complexity of the reaction and emphasized the difficulty to obtain a precise result. It was suggested that gold oxides and cyanide films were responsible for the passivation of gold surface [14,17]. Electrochemical noise measurement (ENM) [18] was referred as a random fluctuation of current and/or potential that has received wide attention to study the electrochemical systems. The instantaneous response to the change of surface conditions enables this method to be an online-monitoring tool. Although ENM technique has been considered for stainless steel [19], copper [20], zinc [21], aluminium [22] and other metals, there is a paucity of in-situ ENM studies for gold.
In this study, the cyclic voltammetry and the effects of cyanide concentration and pH value on the anodic behavior of pure gold (Au) and roasted gold ore (RGO) electrodes were tested in cyanide solutions using potentiodynamic and potentiostatic techniques in the presence of moderate agitation to simulate the practical conditions. In the potentiostatic tests, as complementary to the previous studies, the influence of imposed two anodic potentials, representing the passive region, in different electrolytes on the anodic behavior of gold and gold ore was examined. It is worth noting that, the majority of gold ore studies were conducted using sulphidic gold ores [23-26]. In this study, oxidized gold ore which predominantly consisted of iron oxides was used. Electrochemical noise measurements (ENM) technique was also applied to monitoring the anodic behavior of gold during decay periods after anodic polarization. This can give an insight for better understanding of the anodic behavior of gold in cyanide solutions. The identification of surface film of gold was carried out in parallel by XPS.
2 Experimental
2.1 Ore sample and roasted gold ore electrode preparation
The gold ore sample was obtained from Barrick Gold Corp. It was the calcinate after the roasting of refractory gold ore. The sample, which was already reduced in size with 80% passing 75 ��m (d80), was riffled as portions prior to use in the experiments. The mineralogical analysis of the sample indicates that the ore sample predominantly consists of hematite, magnetite and maghemite. The presence of maghemite renders the ore refractoriness in character due to the difficulties in cyanidation [27].
Roasted gold ore (RGO) with an exposed surface area of 4.9 cm2 was used as compared with the pure gold electrode (Au) with an exposed surface area of 1 cm2. The difference in surface areas of electrodes somewhat reflects the practice. The gold ore was mixed with graphite powder (to increase conductivity) with the mass ratio of 3:1 and around 0.5 g silicone oil for binding, till a paste was obtained. Then, it was mechanically pressed at 20 t to have uniform sample surface. After that, the roasted gold ore electrode was kept under nitrogen over a night, then connected with an insulated copper wire and cast in acrylic resin. The conductivity of the electrode was also checked.
2.2 Cyclic voltammetry, potentiodynamic and potentiostatic test procedure
The gold foil with the surface area of 1 cm2 (99.9% purity from Sigma Aldrich) was used as a working electrode. Platinum as a counter electrode and Ag/AgCl (KCl saturated) as a reference electrode were used. The gold electrodes were first washed and polished with fine polishing paper (MicroCut 100 grit soft) and then rinsed with distilled water. The electrodes were then introduced to aqua-regia for 10 s to clean the surface, washed with distilled water and ethanol and finally rinsed with distilled water again for reproducibility. NaCN (��98% purity) was obtained from Thermo Fisher Scientific Company. The cyclic voltammetry of pure gold electrode without agitation was carried out in 0.04 mol/L NaCN solution at pH value of 10.5. 1 L electrolyte solution was first bubbled with argon and magnetically agitated at 250 r/min for 50 min to eliminate the oxygen. Then, typical three-electrode system was placed into the solution with slight argon bubbling on the surface of the electrolyte. The CV studies were conducted in duplicates from -1 to 1.2 V and the first two cycles were reported. The scan rate was controlled at 10 mV/s. In potentiodynamic and potentio- static tests, argon was profoundly bubbled over the test period. 1 L electrolyte medium was prepared using distilled water and the pH value was adjusted by adding 1 mol/L NaOH. The electrolyte was magnetically agitated (100 r/min) during the test. In this study, EC-Lab software obtained from a biologic company (France) was used to monitor and interpret the obtained results. The preparation procedure for EN studies included 3 steps. The first step was the application of potentiostatic cathodic potential at -0.8 V for reducing any oxidized material for 30 min. The second step was the potentio- dynamic test applied with a scan rate of 0.166 mV/s from -0.8 V to the desired two anodic potentials of 1 or 1.4 V, respectively. This was followed immediately by the potentiostatic studies at three different potentials to monitor the changes in current for 2 h, as the last step. All tests were performed in duplicates and all potentials were reported with respect to standard hydrogen electrode (SHE).
2.3 Electrochemical noise (EN) measurement test procedure
Prior to electrochemical noise measurement (ENM) tests, two working gold electrodes were prepared separately following the three steps mentioned in Section 2.2. The electrochemical noise measurements were conducted by employing a set-up using zero resistance amperometer (ZRA) mode. In this mode, the electrochemical noise can be measured between two nominally identical working electrodes as the galvanic coupling kept at the same potential. The samples were immersed in the solution where the system was allowed to stand at open circuit for 5 min. Then, the potential and current fluctuations were simultaneously recorded during 16 h at a scan rate of fs=10 Hz giving 1024 data points per block. All potentials were measured via Ag/AgCl (KCl saturated) reference electrode (0.202 V), and reported with respect to standard hydrogen electrode (SHE).
The ENM tests were carried out without agitation in the absence of oxygen (argon bubbling). A Gamry PC4/300 potentiostat was used to log current and potential variations in time. The analyses were performed using a GAMRY PC4 750/ESA400 software and analyser v. 2.35. The DC drift was removed before all analyses to eliminate the trend. At least two series of test were performed for each tested sample.
2.4 Procedure of surface characterization test
The surface characterization studies were carried out by X-ray photoelectron spectroscopy (XPS). The XPS results were collected using an AXIS-ULTRA instrument by Kratos (UK). The X-ray source is a monochromatic Al source operated at 300 W. Analyser ran in the constant pass energy mode. Survey scan was recorded with pass energy of 160 eV and a step size of 1 eV. In order to have a precise knowledge of the binding energy scale just before the analysis of the sample, pure gold foil was cleaned in situ by sputtering with argon ion beam (current of 10 ��A and energy of 2 keV) for about 20 min. The Au f7/2 line was then recorded at high resolution. As expected, the Au peak was fitted to have a binding energy (BE) of exactly 83.95 eV. Thus, the instrument is in good shape and ready for analysis of gold surface [28].
3 Results and discussion
3.1 CV without agitation and potentiodynamic tests
The peak determination of pure gold surface was carried out by CV. Figure 1 demonstrates the cyclic voltammetry results of pure gold electrode in 0.04 mol/L NaCN electrolyte with pH value of 10.5 in the first two cycles. The pH value and cyanide concentration were chosen based on industrial practice of gold leaching. Three oxidation and one reduction peaks are observed. In Fig. 1, Peaks A and B correspond mainly to AuOHads, while Peak C is related to Au(OH)3, and more detailed explanations are given in the following potentiodynamic results. Hydrogen evolution reaction (Reaction (1)) takes place, as shown in Region F, and this also corresponds to the reduction reaction assisted with the dissolved atmospheric oxygen in the electrolyte. The increased current above potential of 1.5 V indicates the oxygen evolution reaction (Reaction (2)) and the presence of the reaction of cyanide oxidation to cyanate (Reaction (3)) which is shown as Peak D. It can be deduced that while oxidation peaks are cyanide related, the reduction peak (Peak E) is related to OH-, as has been previously suggested [9].
2H2O+2e  2OH-+H2 (1)
2OH- H2O+1/2O2+2e (2)
CN-+2OH- CNO-+H2O+2e (3)
Figure 2 shows the effect of cyanide concentration (0.005-0.2 mol/L) on the anodic behavior of gold electrodes during the potentiodynamic test. The potentiodynamic findings with moderate agitation and scan rate in cyanide solutions show that an increase of cyanide concentration up to 0.1 mol/L leads to an increase of current density. Then, the current density shows a slight decrease when the cyanide concentration reaches 0.2 mol/L although the relative magnitudes of the peak current density are somewhat different.
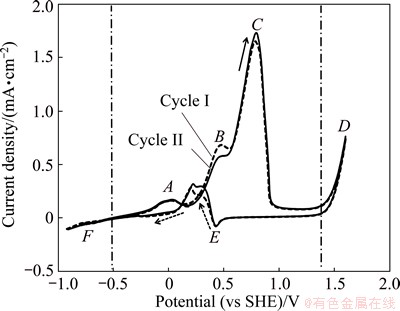
Fig. 1 Cyclic voltammetry of pure gold electrode in the first two cycles (I and II) without agitation in 0.04 mol/L NaCN solution under oxygen-free conditions at pH value of 10.5
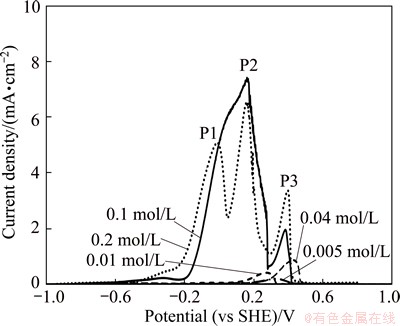
Fig. 2 Effect of NaCN concentration on anodic potentio-dynamic behavior of gold electrode with pH value of 10.5 and scan rate of 0.166 mV/s at 25 ��C
The peak current density (P2) is around 7.37 mA/cm2 in 0.1 mol/L NaCN while it is only 0.22 mA/cm2 in 0.005 mol/L NaCN. For instance, the peak current densities are observed around 4.94, 6.52 and 3.24 mA/cm2 in 0.2 mol/L NaCN for the consecutive three peaks in this work, while KIRK et al [15] observed almost 0.3, 10, 40 mA/cm2, respectively, with the same concentration of cyanide (0.2 mol/L). The first peak generally gives very low current density and sometimes is not observed. These results confirm the presence of three peaks and the differences in peak current densities can be linked to some experimental parameters, such as the magnitude of agitation and scan rate.
In the tested range, three Peaks P1, P2 and P3 (Fig. 2) of passivation were identified, corresponding very possibly to Peaks A, B and C in non-agitated solutions for CV studies (Fig. 1). The first peak is at around -0.2 V, the second peak is at 0.15 V and the third peak is at 0.45 V (vs SHE). The reaction in each of these peaks is observed to be a electron transfer process [17] following the reaction sequence (Reactions (4)-(6)):
Au+CN-�� AuCNads- (4)
AuCNads- AuCNads + e (5)
AuCNads + CN- ��Au(CN)2- (6)
For the first peak region, the second step (Reaction (3)) is suggested to be the rate-determining step. When the gold surface is covered by AuCNads- film, the rate of dissolution of gold is controlled by the rate of chemical dissolution of this intermediate. However, PAN and WAN [13] mentioned that the adsorption of hydroxyl ions on the surface of gold was the contributing cause of passivation according to Reaction (7):
Au+OH-��AuOHads+e (7)
In the tested range (0.005-0.2 mol/L NaCN), in general, lower current density was observed for the first peak (P1) when compared with other two peaks (P2 and P3) for all concentrations. Generally, the first peak current density is smaller than the other two successive peaks [29,30]. Higher cyanide concentration leads to higher peak densities of Au+ as it corresponds to the formation of the first peak. Therefore, Au+ promotes passivation in this passive region. This approach can be ascribed to the second and third peaks due to the accumulation of Au+ and Au3+ ions, respectively.
The current density of the first peak shows large variation depending on the CN concentration, the pH value and measurement techniques. Different concentrations of cyanide such as 0.2-1 mol/L KCN [13], 0.001-0.02 mol/L KCN [14], 0.05-0.2 mol/L KCN [15], 0.2 mol/L KCN [16], 0.008-0.077 mol/L KCN [29], were investigated by several research groups. MUGHOGHO and CRUNDWELL [10] suggested that gold dissolution reaction has different mechanisms at high and low cyanide concentrations. At low cyanide concentrations (<0.04 mol/L), the first peak current density was found to be very small when compared with that of other two peaks. NICOL [29] concluded that the first peak was not observed when the potential scan was applied immediately after gold was put into the solution, while it was observed when the electrode allowed standing at open circuit for 30 min at high rotation speeds.
At about 0.35 V (vs SHE) which corresponds to the second peak region, CATHRO and KOCH [31] proposed the conversion of Au(I) to Au(III) basic cyanide film (Reaction (8)). However, KIRK et al [15] make many studies and suggested the reaction sequence of Reactions (4)-(6) for the second peak region and the second peak could be attributed to the formation of gold (I) hydroxide (Reaction (7)).
2CN-+[Au(I)OHCN-]ads��[Au(III)OH(CN3)-]ads+2e (8)
For the third peak region, KIRK et al [15] suggested that it was the same reaction sequence as for the first and second peaks, but the last step was determined to be the rate-determining step. However, MACARTHUR [16] stated that it was quite difficult to explain the formation of peaks due to the complexity of reactions. It was generally agreed that either direct oxidation of an adsorbed intermediate or oxidation of gold (III) (Reaction (9)), could cause passivation [32]:
Au+3OH-��Au(OH)3+3e (9)
Figure 3 shows the comparison of potentiodynamic and cyclic voltammetry (CV) of pure gold electrode in 0.04 mol/L NaCN electrolyte. The gold oxidation starts at around -0.65 V (vs SHE) and three oxidation peaks are observed at around -0.1, 0.5 and 0.7 V in CV. A reduction peak at around 0.4 V and a small anodic peak at around 0.25 V are seen. The oxidation peak current densities are found to be 0.2, 0.5 and 1.8 mA/cm2 in 0.04 mol/L NaCN solution, respectively. MUGHOGHO and CRUNDWELL [10] tested electrochemical behavior of gold rotating disc electrode (1000 r/min) in dilute cyanide solution (~0.003 mol/L) and also reported three anodic oxidation peaks with small current densities (0.05, 0.15, 0.2 mA/cm2), one reduction peak and one small anodic peak in the turn sweep. Potential and current density shifts between potentiodynamic and cyclic voltammetry are probably due to the influence of agitation. It is worth mentioning that the peak current densities with high cyanide concentration (0.04 mol/L) without agitation significantly increase (3 to 9 times) when compared with the work of MUGHOGHO and CRUNDWELL [10] with low cyanide concentration (~0.003 mol/L). The anodic current densities in 0.04 mol/L NaCN electrolyte by potentiodynamic test are found to be around 0.1 and 0.8 mA/cm2, respectively. Then, it is important to note that agitation (100 r/min) plays an important role in the anodic dissolution of gold in potentiodynamic as compared with the static solution in CV.

Fig. 3 Potentiodynamic and cyclic voltammetry curves of pure gold electrode at 100 r/min agitation in 0.04 mol/L NaCN solution under oxygen-free conditions at pH value of 10.5
Since oxygen is essential for industrial cyanidation practice, it is quite important to examine the effect of oxygen on the pure gold electrode polarization. Figure 4 represents the influence of oxygen in anodic polarization test of pure gold electrode (Au) in 0.04 mol/L NaCN electrolyte. In the absence of oxygen, with argon bubbling, two passive peaks are obtained at -0.5 (very slight) and 0.4 V (vs SHE), respectively. On the other hand, in the presence of oxygen, one passive peak is observed at around 0.65 V (vs SHE). Higher current densities are obtained with argon bubbling in the absence of oxygen, while a 1.5 times lower current density with respect to the second peak is obtained in the presence of oxygen. These results indicate the significant role of oxygen in gold dissolution processes. Additionally, the polarization of roasted gold ore (RGO) electrode was also tested for comparison (Fig. 4). It is clearly seen that the dissolution of RGO starts later in the presence of oxygen when compared with that of Au. This can be linked to the less soluble characteristics of iron oxides [1]. Au electrode shows higher current density at 0.7 V (vs SHE) when compared with RGO. At the same potential, the current density of Au reduces due to the formation of surface products, probably Au(OH)3. The current density of RGO linearly increases to 0.6 mA/cm2 till the potential reaches about 0.75 V and the slight passive peak is observed. Then, the current density continues to increase up to 1.2 mA/cm2. The results are reproducible to within 5%, 7% and 10% for Au electrode without oxygen, with oxygen and for RGO with oxygen, respectively.
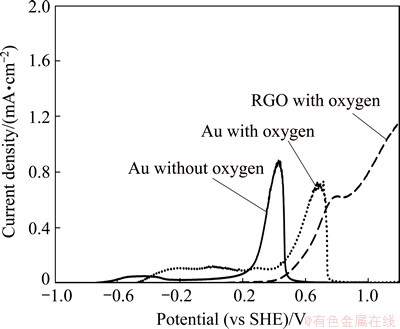
Fig. 4 Influence of oxygen on anodic potentiodynamic behavior of pure gold compared with roasted gold ore electrode in solution with atmospheric oxygen, 100 r/min agitation in 0.04 mol/L NaCN solution with scan rate of 0.166 mV/s and pH value of 10.5 at 25 ��C
3.2 Effect of pH value on anodic behavior of gold
Figure 5 demonstrates the effect of pH value (10-12) on the anodic behavior of gold foil electrode in 0.04 mol/L NaCN solution at 100 r/min agitation. It is found that the peak current densities decrease with increasing the pH value. The second peak current density greatly increases (~40 times) at pH value of 10 when compared with other two pH values. BARSKY et al [33] experimentally proved that gold dissolution decreases above pH value of 11 using gold discs. At higher pH values (>10), the first peak current density is found to be very small (~0.05 mA/cm2). It is worth noting that passivation increases at high pH values due to the accumulation of hydroxyl ions on the surface [34,35]. These findings reveal that the first and second peaks (P1 and P2) form due to the formation of gold (I) hydroxide while the third peak (P3) forms due to the formation of gold (III) hydroxide. Additionally, low level of agitation (60 r/min) was tested at pH value of 11, since agitation is a quite important parameter for the electrochemical dissolution of gold. It is found that decreasing the agitation from 100 to 60 r/min results in a great increase of the second peak current density which is very close to that at pH value of 10. The third peak at 60 r/min agitation gives almost the same current density when compared with that at 100 r/min agitation. These results clearly show that agitation is of prime importance for the leaching of gold [29,31,34]. All these tests were performed at least in triplicates and relative standard deviation (RSD) was found to be 8%.

Fig. 5 Effect of pH on anodic potentiodynamic behavior of gold electrode in 0.04 mol/L NaCN solution with 100 r/min agitation and scan rate of 0.166 mV/s at 25 ��C (**: 60 r/min agitation)
Figure 6 illustrates the effect of pH value on the corrosion rates of RGO in duplicates (calculated based on Jcorr [36]). The RGO electrode at pH value of 10 has the highest corrosion rate of (0.24��0.02) mg/(cm2��h) while those at pH values of 10.5 and 11.5 show corrosion rates of (0.19��0.01) mg/(cm2��h) and (0.109��0.04) mg/(cm2��h), respectively. It is clearly seen that the corrosion rate at pH value of 10 is found to be about 2 times higher than that at pH value of 11.5. The decreasing trend in corrosion rate of RGO at higher pH values can be linked to the hydroxylation reactions. These findings suggest that the pH values of 10-10.5 have more significant effect on the dissolution process. In gold cyanidation practice, the pH value is often maintained at around 10.5 depending on the type of gold ore and the presence of minerals.
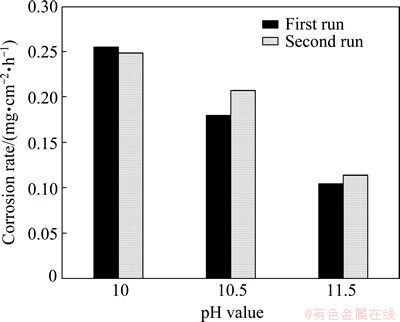
Fig. 6 Corrosion (dissolution) rates of RGO at scan rate of 0.166 mV/s and different pH values (10.5-11.5) in 0.04 mol/L NaCN electrolyte at 100 r/min agitation in duplicates (first run and second run)
3.3 Potentiostatic tests at different anodic potentials
After potentiodynamic tests, two different potentials (1 and 1.4 V (vs SHE)) were chosen in the passive region to evaluate the behavior of gold electrodes. It is important to monitor current changes when the gold is under passive conditions and also it provides additional data on the duration of passivity. These results are reproducible to within 6%. Figure 7 illustrates the effect of potential (1 and 1.4 V) on current changes in passive region as function of cyanide concentration (0.04 and 0.1 mol/L) and pH value (10 and 11). It is found that in 0.04 mol/L NaCN solution at pH value of 11, the current density decreases (~80%) with increasing the potential in the two tested cyanide concentrations, e.g., 35 ��A at 1 V while 6 ��A at 1.4 V. It should be mentioned that decreasing the pH value from 11 to 10 results in 1.7 fold increase of current density at 1 V in 0.04 mol/L solution medium (Fig. 5). This can be linked with stabilising of passivity at pH value of 11 that promotes the generation of AuCN basic films on the surface [29,37]. However, the effects of cyanide concentration, pH value and potential on the evaluation of current density as function of time indicate that it is not stable and efficient type of passivation.

Fig. 7 Effect of potential (1 and 1.4 V) on current changes with different cyanide concentrations (0.04 and 0.1 mol/L) using potentiostatic test (pH values of 10 and 11)
It is found that at passive potential of 1.4 V, increasing the NaCN concentration from 0.04 to 0.1 mol/L leads to a decrease of current density, and a similar trend is observed for other potentials. This decrease can be attributed to the hypothesis that high NaCN concentration favors passive state according to the formation of basic cyanide films that lead to sharp decrease of current [15,30]. In this situation, the diffusion control is not an important contributing factor since moderate agitation is applied. The current density has a decreasing trend with increasing the potential from 1 to 1.4 V. Thus, in the passive region, increasing the potential from 1 to 1.4 V in 0.1 mol/L NaCN solution results in 10% decrease of current density. Furthermore, increasing the NaCN concentration from 0.04 to 0.1 mol/L at 1 V leads to about 62% decrease of current density in the passive region. QIAN et al [38] mentioned that the peak current density drops with increasing the cyanide concentration. This can be also due to the passivation, since the surface reaches a passive region at first, and then passivation can become more stable as function of time and increasing the anodic potential.
3.4 Electrochemical noise measurements (ENM)
3.4.1 Open circuit potentials
The corrosion potential and current noise recorded for three concentrations of NaCN (0.01, 0.04 and 0.1 mol/L) during anodic polarisation are presented in Figs. 8(a) and (b), respectively. The potential evolution changes significantly from NaCN concentration of 0.01 mol/L to two other concentrations of 0.04 and 0.1 mol/L (Fig. 8(a)). The anodic potential value changes around -0.4 V for 0.1 mol/L while it decreases -0.55 to -0.6 V for two higher concentrations. The current density variations with function of time show higher current densities for the two higher concentrations, indicating easier dissolution (Fig. 8(b)). The current density values are varied from about 2��10-4 mA/cm2 for two higher concentrations to about 1.7��10-4 mA/cm2 for lower concentration (0.01 mol/L). It can be deduced that the gold dissolution is realized more efficiently in these higher CN- concentration solutions (0.04 and 0.1 mol/L) than in 0.01 mol/L NaCN solution.

Fig. 8 Potential (a) and current (b) noise recorded during 24 h immersion of gold electrode in three concentrations of NaCN (0.01, 0.04 and 0.1 mol/L) at pH value of 10.5
One of the most popular statistical parameters of ENM analyses in the time domain is the noise resistance (Rn). The noise resistance is defined as the ratio of the standard deviation of the potential noise to that of the current noise that can be associated to the polarization resistance (Rp). The ratio 1/Rn (admittance) is referred to the corrosion rate [39]. The ENM data of 1/Rn for each specimen were measured during immersion period. The mean of measurements for two series of experiments is presented in Fig. 9. It can be observed that in general, the corrosion rate increases in function of time for all examined concentrations of NaCN. However, the corrosion rate increases more quickly with increasing the time for higher concentrations (0.1 mol/L and 0.04 mol/L) than that for lower concentration of NaCN (0.01 mol/L). Furthermore, the corrosion rates for two concentrations of 0.1 and 0.04 mol/L are very similar. The results of ENM analyses are consistent with the results obtained by other researchers employing direct cyanide leaching tests [35], indicating that the rate of gold dissolution increases with increasing the cyanide concentration until a maximum. Passing the maximum, in contrary, it can be observed that a slight retarding effect on the gold dissolution procedure leads to slight corrosion rate. According to Fig. 9, the corrosion rate decreases slightly in the NaCN solution of 0.1 mol/L as compared with that in 0.04 mol/L NaCN solution. This also indicates the presence of different phenomena such as limited current diffusion control of cyanide ions even at free corrosion potentials, and there should be certain increase of the formation of adsorbed or precipitated passive compounds as function of the cyanide concentration on the electrode surface.

Fig. 9 Instantaneous measured 1/Rn for gold immersed in three concentrations of NaCN (0.01, 0.04 and 0.1 mol/L) and roasted gold ore in 0.04 mol/L NaCN for comparison at pH value of 10.5
Since gold is always found as alloys in the nature, roasted gold ore (RGO) was used as an electrode to compare the corrosion rate with pure gold (Au) electrode. In this case, the middle concentration of 0.04 mol/L was chosen since this is often selected in practical cyanidation. The results demonstrate that the corrosion rate of RGO increases rapidly till about 11.5 h. However, after this period, the dissolution rate becomes almost flat around an average value of about 0.02 ��-1��cm-2 till 24 h. This slowdown trend in the corrosion rate of RGO as function of time can be linked to the release of detrimental ions from roasted gold ore and the diffusion control due to the consumption of cyanide ions by these species. At the end of the test, RGO and Au electrodes had very close corrosion rates in 0.04-0.1 mol/L NaCN solution.
3.4.2 Potential decay after polarization
The potential and current evolutions of gold specimens, polarized at anodic potentials during 2 h, are recorded during 16 h decay. Figures 10(a) and (b) illustrate the variations of potential and current density, respectively. According to Fig. 10, more anodic potential and higher current density can be found for the passivated specimen at 1 V, indicating easier dissolution. Furthermore, it can be observed that the potential of gold specimens polarized potentiostatically at 1 V (Fig. 10(a)) is about -0.55 V such as the specimen without previous polarization in Fig. 8(a). It can be deduced that the passive film formed during potentiostatic polarization at 1 V is not enough stable and resistant, hence it dissolves quickly after immersion in 0.04 mol/L NaCN. Although, the layer of gold oxides (Au (I) and Au (III)) that formed under potentiostatic conditions at 1.4 V, seems to be more efficient and resistant to corrosion as compared with that at 1 V, the reduction of potential towards more active potentials (-0.55 V) (Fig. 10(a)) is observed, confirming the dissolution of this passive film.

Fig. 10 Potential noise (a) and current noise (b) decay with time for two polarized gold electrodes under potentiostaic conditions at 1 and 1.4 V during 16 h immersion in 0.04 mol/L NaCN solution
The potential and current noise for a sampling data point of 20 s after 1 and 16 h during decay was monitored and only that of 16 h was illustrated in Fig. 11. It presents the potential and current comparison for three potentiostatically polarized gold specimens at active potential of 0.3 V and passive potentials of 1 and 1.4 V (vs SHE). Figure 11(a) shows the potential and current noise for pure gold (Au) electrode that was previously polarized at active potential of 0.3 V (vs SHE) for 2 h. The amplitude of potential noise changes ��60 ��V in the two selected zones (1 and 16 h). On the other hand, the electrodes polarized at two passive potentials are considered for comparison with the active potential. Figure 11(b) illustrates the potential and current noise signature of the polarized gold electrode at 1 V. It is observed that the amplitude of potential noise for this electrode changes in the range of ��30 ��V in the two selected zones (1 and 16 h). While for the polarized specimen at 1.4 V, the fluctuation change is in the range of ��15 ��V (Fig. 11(c)). It can be deduced that 2-4 times larger fluctuations in potential are obtained with a specimen that was previously polarized at active potential (0.3 V) when compared with the passive potentials. Larger fluctuations can be attributed to easier dissolution of the specimen and its oxides. Moreover, similar characteristics for the potential and current transients are obtained at 1 and 16 h (Fig. 11(b)) for the polarized gold electrode at 1 V. In general, the amplitude of EN fluctuations can be correlated to the intensity of the corrosion process, while the fluctuation shape indicates the type of corrosion process [40,41]. The patterns of potential and current noise recorded for the gold specimen polarized at 0.3 V (Fig. 11(a)) show sharp fluctuations for both potential and current during the whole period of immersion. The pattern presented in Fig. 11(b) shows the oscillations towards less negative potential directions followed by no abrupt recovery that have similar form generally. This form of oscillations can be mainly attributed to the stable pitting corrosion form [42]. The fluctuations that are obtained under polarization of the gold electrode at 1.4 V can be attributed to the instability of the passive film, and the film breakdown and re-passivation processes are associated with metastable pitting [43]. It should be noted that the amplitude of the current fluctuations reduces from ��15 ��V (measured after 1 h) to ��5 ��V after 16 h of immersion for this electrode (Fig. 11(c)). These variations can be indicative of the formation of a passive film (gold hydroxide formation) due to Reactions (7) and (9) on the electrode surface.
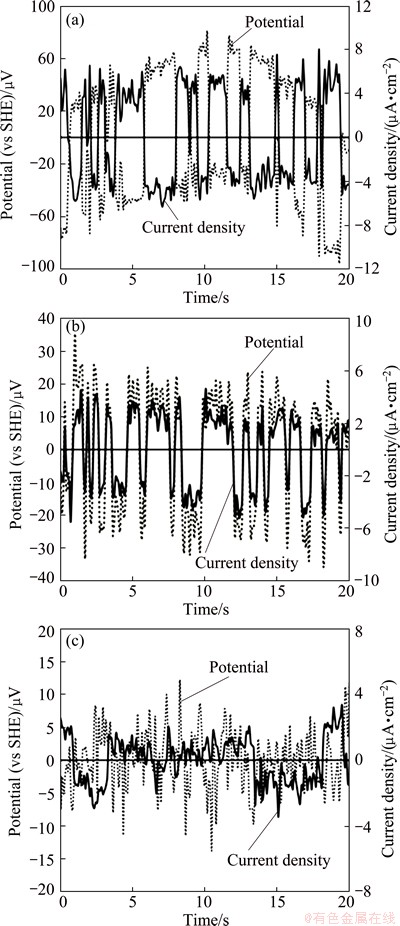
Fig. 11 Potential noise and current noise for two polarized gold electrodes under potentiostaic conditions applying one active potential of 0.3 V (a) and two passive potentials of 1 V (b) and 1.4 V (c) immersed in 0.04 mol/L NaCN solution after 16 h
3.5 Surface characterization
The chemical characterization of gold surface was performed to provide an insight into the surface reaction processes. The XPS study was carried out after 30 min cathodic cleaning at -0.8 V, followed by potentio- dynamic test at a scan rate of 0.166 mV/s between -0.8 and 1 V and finally potentiostatic test for 2 h in 0.1 mol/L NaCN solution at 1 V and 25 ��C with argon bubbling and magnetic stirring of 100 r/min. The XPS studies show the presence of Au+ and Au3+ oxides on the surface of gold electrode (Fig. 12). It is believed that oxides promote the passivation of gold surface [12,29]. Due to rapid reactions during leaching, the detecting of oxides is highly sensitive. Although the presence of oxides can be identified according to two very slight peaks, a standard conventional peak as observed in sulfuric acid medium. This can be mainly attributed to the examined cyanide concentration (0.1 mol/L). This finding highlights that passivation is more likely to be caused by corrosion products than real passivation. The XPS studies on gold surface confirm that there is a kind of partial passivation due to corrosion products.
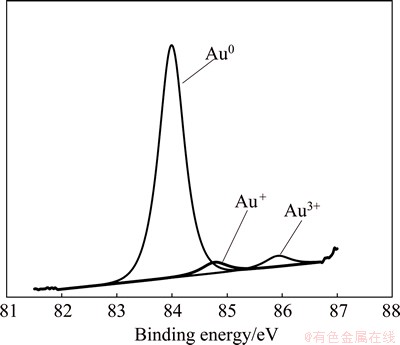
Fig. 12 XPS spectra of surface of gold electrode after potentiostatic test for 2 h in 0.1 mol/L NaCN at 25 ��C with argon bubbling and magnetic stirring of 100 r/min
4 Conclusions
1) The leaching rate of gold increases with increasing the cyanide concentration to 0.1 mol/L, and then slows down at 0.2 mol/L. In addition, a shift in pH values from 12 to 10 increases the leaching rate of gold. The differences in peak positions and current densities in cyclic voltammetry (without agitation) and potentiodynamic polarization (at 100 r/min agitation) are indicative of prime importance of agitation on the passivation of gold surface.
2) In the absence of oxygen, pure gold electrode shows two passive peaks while one passive peak is also observed in the presence of oxygen. On the other hand, roasted gold ore electrode gives only a slight passive peak in the presence of oxygen when compared with pure gold.
3) The potentiostatic studies show that increasing the cyanide concentration and potentials (1 to 1.4 V) in the passive region leads to a decrease of current density up to 80%. While decreasing the pH value from 11 to 10 results in 1.7 fold increase of current density at 1 V in 0.04 mol/L NaCN solution. These findings reveal that when gold is in the passive region, increasing the cyanide concentration, pH value and potential adversely affects the leaching of gold, leading to more passive behavior.
4) According to the electrochemical noise measurements (ENM) analysis, without previous polarization, about 3 times higher corrosion rate is obtained for more concentrated NaCN solutions (0.1 and 0.04 mol/L) than that for the lower one (0.01 mol/L) at open circuit potential. The pure gold electrode shows an increasing trend of corrosion rate. While the roasted gold ore electrode is found to have a plateau between 11.5 and 24 h. This is consistent with the obtained higher current density for the pure gold electrode when compared with the roasted gold ore electrode during decay periods.
5) The ENM gives in-situ current, potential and corrosion rate as function of time, and stable pitting type of localized corrosion form is observed during potential decay after potentiostatic polarization. The instability of passive film, the film breakdown and the re-passivation processes are associated with metastable pitting. Based on the findings, it can be suggested that electrochemical noise measurement (ENM), as a more recent electrochemical technique, can be suitably used for further gold leaching studies.
6) The formed gold oxide films (Au (I) and Au (III)) during potentiostatic conditions at 1.4 V were determined by XPS studies and are found to be more efficient and resistant to corrosion as compared with those at 1 V. These detected gold oxides are the main factors contributing to the passivation of gold surface.
Acknowledgements
The authors would like to express their sincere thanks and appreciations to Natural Sciences and Engineering Research Council of Canada, Barrick Gold Corporation, Hydro-Quebec, Glencore�CZinc electrolytic of Canada for their financial support through R&D NSERC Program and to Dr. Alain ADNOT (Laval University) for the help during XPS analysis and to Majid HEIDARI for the participation in XPS studies.
References
[1] MARSDEN J O,
[2] MUIR D M. A review of the selective leaching of gold from oxidised copper�Cgold ores with ammonia�Ccyanide and new insights for plant control and operation [J]. Minerals Engineering, 2011, 24: 576-582.
[3] LORENZEN L, van DEVENTER J S J. The mechanism of leaching of gold from refractory ores [J]. Minerals Engineering, 1992, 5: 1377-1387.
[4] HOLMES P R, CRUNDWELL F K. Polysulfides do not cause passivation: Results from the dissolution of pyrite and implications for other sulfide minerals [J]. Hydrometallurgy, 2013, 139: 101-110.
[5] CRUNDWELL F K. The dissolution and leaching of minerals: Mechanisms, myths and misunderstandings [J]. Hydrometallurgy, 2013, 139: 132-148.
[6] HABASHI F. Theory of cyanidation [J]. Transactions of Society Mining Engineers AIME, 1966, 235: 236-239.
[7] HABASHI F, BAS A D. Evidence of the existence of anodic and cathodic zones during the dissolution of minerals and metals [J]. Hydrometallurgy, 2014, 144-145: 148-150.
[8] AZIZI A, OLSEN C, GAGNON C, BOUAJILA A, OURRIBAN M, BLATTER P, LARACHI F. Gold passivation: Reconciling cyanidation circuit performances using laboratory testing [J]. CIM Journal, 2013, 4: 175-182.
[9] LIN H K, CHEN X. Electrochemical study of gold dissolution in cyanide solution [J]. Minerals and Metallurgical Processing, 2001, 18: 147-153.
[10] MUGHOGHO D T, CRUNDWELL F K. Gold dissolution in dilute cyanide solutions [C]//WOODS R, DOYLE F M, RICHARDSON P. Electrochemistry in Mineral and Metal Processing, IV. Pennington, NJ: The Electrochemical Society, Inc, 1996, 275-307.
[11] GUZMAN L, SEGARRA M, CHIMENOS J M, CABOT P L, ESPIELL F. Electrochemistry of conventional gold cyanidation [J]. Electrochimica Acta, 1999, 44: 2625-2632.
[12] KIRK D W, FOULKES F R, GRAYDON W F. Gold passivation in aqueous alkaline cyanide [J]. Journal of Electrochemical Society, 1980, 127: 1962-1969.
[13] PAN T P, WAN C C. Anodic behavior of gold in cyanide solution [J]. Journal of Applied Electrochemistry, 1979, 9: 653-655.
[14] GUAN Y, HAN K N. An electrochemical study on the dissolution of gold and copper from gold-copper alloys [J]. Metallurgical and Materials Transactions B, 1994, 25: 817-827.
[15] KIRK D W, FOULKES F R, GRAYDON W F. A study of anodic dissolution of gold in aqueous alkaline cyanide [J]. Journal of Electrochemical Society, 1978, 125: 1436-1443.
[16] MACARTHUR D M. A study of gold reduction and oxidation in aqueous media [J]. Journal of Electrochemical Society, 1972, 119: 672-676.
[17] KIRK D W, FOULKES F R. Anodic dissolution of gold in aqueous alkaline cyanide solutions at low overpotentials [J]. Journal of Electrochemical Society, 1980, 127: 1993-1997.
[18] EDEN D A. Electrochemical noise [M]//REVIE R W. Uhlig��s Corrosion Handbook, 3rd ed. New York: Wiley, 2011: 1167-1175.
[19] KLAPPER H S, GOELLNER J, BURKERT A, HEYN A. Environmental factors affecting pitting corrosion of type 304 stainless steel investigated by electrochemical noise measurements under potentiostatic control [J]. Corrosion Science, 2013, 75: 239-247.
[20] SAFIZADEH F, GHALI E. Electrochemical noise of copper anode behavior in industrial electrolyte using wavelet analysis [J]. Transactions of Nonferrous Metals Society of China, 2013, 23(6): 1854-1862.
[21] ZHANG Z, LENG W H, CAI Q Y, CAO F H, ZHANG J Q. Study of the zinc electroplating process using electrochemical noise technique [J]. Journal of Electroanalytical Chemistry, 2005, 578: 357-367.
[22] CURIONI M, COTTIS R A, THOMPSON G E. Application of electrochemical noise analysis to corroding aluminium alloys [J]. Surface and Interface Analysis, 2013, 45: 1564-1569.
[23] AGHAMIRIAN M M, YEN W T. Mechanisms of galvanic interactions between gold and sulfide minerals in cyanide solution [J]. Minerals Engineering, 2005, 18: 393-407.
[24] AZIZI A, PETRE C F, OLSEN C, LARACHI F. Electrochemical behavior of gold cyanidation in the presence of a sulfide-rich industrial ore versus its major constitutive sulfide minerals [J]. Hydrometallurgy, 2010, 101: 108-119.
[25] AZIZI A, PETRE C F, OLSEN C, LARACHI F. Untangling galvanic and passivation phenomena induced by sulfide minerals on precious metal leaching using a new packed-bed electrochemical cyanidation reactor [J]. Hydrometallurgy, 2011, 107: 101-111.
[26] AZIZI A, PETRE, C F, LARACHI F. Leveraging strategies to increase gold cyanidation in the presence of sulfide minerals��Packed bed electrochemical reactor approach [J]. Hydrometallurgy, 2012, 111-112: 73-81.
[27] PAKTUNC D, KINGSTON D, PRATT A. Distribution of gold in pyrite and in products of its transformation resulting from roasting of refractory gold ore [J]. The Canadian Mineralogist, 2006, 44: 213-227.
[28] ADNOT A. XPS analysis of an electrochemically treated Au surface [R].Quebec City: Laval University, 2013: 1-11.
[29] NICOL M J. The anodic behavior of gold [J]. Gold Bulletin, 1980, 13: 105-111.
[30] BEK R Y, ROGOZHNIKOV N A, KOSOLAPOV G V. The kinetics of anodic dissolution of gold in cyanide electrolytes and the interface layer composition [J]. Russian Journal of Electrochemistry, 1997, 33: 119-125.
[31] CATHRO K J, KOCH D F A. The anodic dissolution of gold in cyanide solutions [J]. Journal of Electrochemical Society, 1964, 111: 1416-1420.
[32] SENANAYAKE G. A review of effects of silver, lead, sulfide and carbonaceous matter on gold cyanidation and mechanistic interpretation [J]. Hydrometallurgy, 2008, 90: 46-73.
[33] BARSKY S J, SWAINSON N, HEDLEY N. Dissolution of gold and silver in cyanide solution [J]. Am Inst Min Metall Eng Trans, 1934, 112: 660-677.
[34] HABASHI F. Gold: History, metallurgy, culture [M]. Canada: M��tallurgie Extractive Qu��bec, 2009.
[35] TSHILOMBO F A. Influence of silver alloying and impurities on the dissolution of gold in alkaline cyanide solutions [D]. Pretoria: University of Pretoria, 2000.
[36] ASTM Standard G 102-89. Standard practice for calculation of corrosion rates and related information from electrochemical measurements [S].
[37] JEFFREY M I, RITCHIE I M. The leaching and electrochemistry of gold in high purity cyanide solutions [J]. Journal of Electrochemical Society, 2001, 148: D29-D36.
[38] LI Qian, JIANG Tao, YANG Yong-bin, LI Guang-hui, GUO Yu-feng, QIU Guang-zhou. Co-intensification of cyanide leaching gold by mercury ions and oxidant [J]. Transactions of Nonferrous Metals Society of China, 2010, 20(8): 1521-1526.
[39] LOTO C A. Electrochemical noise measurement technique in corrosion research [J]. International Journal of Electrochemical Science, 2012, 7: 9248-9270.
[40] ABALLE A, BETHENCOURT M, BOTANA F J, CANO M J, MARCOS M. On the reproducibility of the electrochemical response of AA5083 alloy in NaCl solutions [C]//SHAW B A, BUCHHEIT R G, MORAN J P. Corrosion and Corrosion Prevention of Low Density Metals and Alloys. Pennington, NJ: The Electrochemical Society, Inc, 2001: 364-375.
[41] JIANG X, NESIC S, HUET F, KINSELLA B, BROWN B, YOUNG D. Selection of electrode area for electrochemical noise measurements to monitor localized CO2 corrosion [J]. Journal of Electrochemical Society, 159, 7: C283-C288.
[42] LAFRONT A M, ZHANG W, GHALI E, HOULACHI G. Electrochemical noise studies of the corrosion behavior of lead anodes during zinc electrowinning maintenance [J]. Electrochimica Acta, 2010, 55: 6665-6675.
[43] AMIRA S, LAFRONT A M, DUBE D, TREMBLAY R, GHALI E. Electrochemical study of AXJ530 magnesium alloy behavior in alkaline NaCl solution [J]. Advanced Engineering Materials, 2007, 9: 973-980.
Ahmet Deniz BAS1, Fariba SAFIZADEH1, Wei ZHANG1, Edward GHALI1, Yeonuk CHOI2
1. Department of Mining, Metallurgical and Materials Engineering, Laval University, Quebec G1V 0A6, Canada;
2. Barrick Gold Corporation, Suite 3700, 161 Bay Street P.O. Box 212 Toronto, Ontario M5J 2S1, Canada
ժ Ҫ���о�����ͱ��ս��缫��25 ��C���������軯������еĻ�Ͷۻ���Ϊ���ڽ����ٶ�Ϊ100 r/min��0.04 mol/L NaCN��Һ�еõ���ѭ���������ߺͶ���λ����������ʾ��ͬ�ķ�λ�ú͵����ܶȡ�����λ���Ա�����������ܶ����軯��Ũ�ȵ����Ӷ���������ӡ�pHֵ��10���ߵ�11���µ����ܶȴ���Ƚ��ͣ����������ٶȴ�100 r/min���͵�60 r/min���µ����ܶ��������������������£�����ͱ��ս��缫��ʾ��ͬ�ķ�λ�ú�ʴ���ʡ����λ���о���������pHֵΪ11ʱ������λ��1 V��ߵ�1.4 V�������ܶȽ���80%������1 Vʱ����pHֵ��11���͵�10�������ܶ�����1.7����������������γ��˸���Ч�Ķۻ��㡣������˥���ڼ�ĵ绯ѧ��������(ENM)���������ڸߵ�λʱ���ڶۻ��̶ȸ��ߣ��ʵ�״��ʴ������ENM�������������������ڸ��õ�Ӧ���ڽ�����о���XPS�о�֤���˶ۻ�������Ĵ��ڡ�
�ؼ��ʣ����𣻱��ս���軯��������绯ѧ������XPS
(Edited by Mu-lan QIN)
Corresponding author: Ahmet Deniz BAS; Tel: +1-418-656-8657, Fax: +1-418-656-5343; E-mail: ahmet-deniz.bas.1@ulaval.ca
DOI: 10.1016/S1003-6326(15)63981-4

