J. Cent. South Univ. (2016) 23: 353-361
DOI: 10.1007/s11771-016-3080-6

Theoretical and experimental investigation on optimization of a non-contact air conveyor
ZHONG Wei(钟伟)1, 2, LI Xin(黎鑫)3, TAO Guo-liang(陶国良)3, LU Bo(路波)4, KAGAWA Toshiharu(香川利春)5
1. School of Mechanical Engineering, Jiangsu University of Science and Technology, Zhenjiang 212003, China;
2. Wuxi Pneumatic Technology Research Institute Co. Ltd., Wuxi 214072, China;
3. State Key Laboratory of Fluid Power Transmission and Control, Zhejiang University, Hangzhou 310027, China;
4. Boyan Pneumatic Technology Institute of Ningbo, Fenghua 315500, China;
5. Precision and Intelligence Laboratory, Tokyo Institute of Technology, Yokohama 226-8503, Japan
 Central South University Press and Springer-Verlag Berlin Heidelberg 2016
Abstract: Air film conveyors equipped with porous pads have been developed to bring the liquid crystal display (LCD) into a non-contact state during transportation process. In this work, a theoretical model including flow property of porous media and Reynolds equation is established within a representative region in order to optimize the design parameters of a partial porous air conveyor. With the theoretical model, an optimization method using nondominated sorting genetic algorithm – II (NSGA-II) is applied for a two-objective optimization to achieve a minimum air consumption and maximum load capacity. Three Pareto-optimal solutions are selected to analyze the influence of each parameter on the characteristics of the air conveyor, and the results indicate that the position of the porous pads has the most significant impact on the performance and of course must be determined with care. Furthermore, experimental results in terms of the supporting force versus gap clearance show that the optimized air conveyor can greatly improve the load capacity over the normal one, indicating that the optimization method is applicable for practical use.
Key words: optimization; genetic algorithm; porous media; air conveyor; pressure distribution
1 Introduction
Fragile workpieces such as silicon wafers are conventionally moved using vacuum chucks in the manufacturing process. Such contact methods are often accompanied by surface scratching and static electricity. Especially in the production of large sized liquid crystal display (LCD), the contact method easily results in trace and deformation to glass substrates during the course of conveying [1]. Transporting using air conveyors is a good choice to avoid above problems because air is magnetic free, contamination free and does not produce heat [2]. Most current air conveyors use orifice to spout pressurized air beneath the workpieces, with the same principle as orifice bearings. research on pressure distribution of the air conveyor composed of aligned orifice restrictors showed that there exists a considerable pressure peak at the centre of each orifice [3]. It is known that the pressure peak easily causes a large deformation to the flexible glass sheet. For easing the stress concentration, a viable approach is to use porous medium as a restrictor to replace the orifice [4-6]. A sketch of a partial porous air conveyor is shown in Fig. 1. Concerning research on porous air conveyors, Lee et al [7] constructed a film flow model and developed some design principles for reducing air consumption, and Amano et al [8] developed a conveyor system involving alternately placed 19 mm square porous air supply and exhaust pads, while Oiwa et al [9] studied the deformation behavior of glass sheets. However, design parameters for such conveyors are commonly selected based on experience. In actual applications, the air conveyor is expected to provide a maximum load capacity, but with a minimum air consumption. It is a critical multi-objective optimization problem, and the two objectives, the supply flow rate and the load capacity, conflict with each other. The usual treatment of multi- objective problems in tribology field is to consider a weighted sum of several objectives in the search process. Hashimoto and MATSUMOTO [10] presented a hybrid optimization technique to find the optimum solution of hydrodynamic journal bearings, in which the objective function is defined by the weighted sum of temperature rise, leakage flow, and journal rotating speed. Wang et al [11] minimized a weighted sum of normalized air flow and the reciprocal of load capacity of an aerostatic pad. Kang et al [12] minimized the cost function which is the summation of the deviation of flying height from the target value and the reciprocal values of the stiffnesses for improving operating performance of air-lubricated slider bearings. However, it is difficult for a designer who has no prior experience to select the weighting factor. Since the final solution of a weighted sum optimization problem is influenced by the predetermined weightings, for a problem with multiple conflicting objectives, no single set of design variables can be considered best for all the objective functions, and of course, it is usually inconvenient to find a set of solutions for a multi-objective problem. Inversely, another method, generating a number of random solutions in the design space and choosing the preferred solution, is usually adopted to achieve global optimizations. A critical example is the genetic algorithms [13], which works with a population of points rather than a single point. It has been applied to many tribological optimization problems due to their high probability of obtaining a global optimum [14-19]. Wang et al [20] solved the multi-objective optimization problem by incorporating the criterion of Pareto optimality in the selection of mating groups in the genetic algorithms. Hirani [21] used a genetic algorithm to develop a Pareto optimal front for multi- objective optimization of hydrodynamic-bearing in order to minimize power loss. Boedo and Eshkabilov [22] implemented a genetic algorithm to optimize the shape of fluid film journal bearing under steady load and steady speed for maximization of the load capacity. Zengeya and Gadala [23] developed a journal bearing hybrid optimization technique that uses a genetic algorithm to converge to the global minimum and sequential quadratic programming for accurate location of the minimum point. Federico and marcello [24] studied the effect of design variables on the static performance of a rectangular air bearing with a multi-objective optimization approach based on genetic algorithms. The optimization process requires a mathematical model with great accuracy and a technique that optimizes multiple goals subjected to constraints on design parameters. Although related research presented heavily theoretical analysis of optimization method, a detailed investigation on experimental validation of the accuracy of the model and effectiveness of the method is lacking. In addition, for airflow through porous media, previous research generally assumed that it follows the Darcy regime. Our earlier research [25-26] reveals that a Forchheimer-extended regime must be applied, and therefore, the mathematical model needs to be reconstructed.
This work proposes a theoretical model including the flow property of porous media and the Reynolds equation to obtain film pressure distribution. A modified non-dominant sort in genetic algorithm (NSGA-II) [27] was used to solve the multi-objective optimization problem to give a good compromise of load capacity and air consumption. Accuracy of the model and the effectiveness of the optimization method are confirmed experimentally.
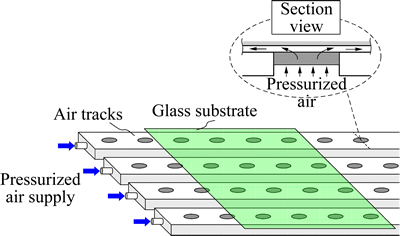
Fig. 1 Schematic of a partial porous air conveyor system
2 Theoretical analysis
2.1 Mathematical model
The air conveyor system shown in Fig. 1 has a technical problem that it is quite difficult to adjust all the tracks on a plane. In an effort to overcome the problem, a modified noncontact air conveyor is proposed as shown in Fig. 2. Pressurized air is supplied through a number of porous pads to form an air film to support the glass sheet in a contactless state. The system is 520 mm×520 mm and is divided into 25 square units. Each unit has four circular recesses where the porous pads are inserted, with the porous surface leveled with the conveyor surface. Exhaust grooves, with a width of 5 mm and a depth of 1 mm, are formed between the units to open to the atmosphere. In addition, exhaust holes (4 mm diameter) are made at the intersections of the grooves.
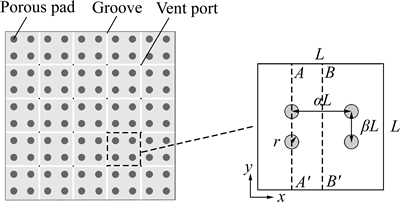
Fig. 2 Schematic diagram of representative four-porous-pad air conveyor
In order to facilitate theoretical analysis, a representative square area unit, including four circular porous regions, is selected, as shown in Fig. 2. Each side of the square area has a length of 100 mm. A Cartesian coordinate (x-y) is built with the bottom left point as the origin. Four porous pads are symmetrically positioned inside the square region. The distance of the porous pads in x and y directions are scaled to be α and β times the external dimensions, respectively. The following assumptions are made to enable a theoretical modeling.
1) airflow in the clearance is laminar, dominated by viscous effects;
2) pressure distribution in film thickness direction is negligible;
3) the porous medium is isotropic and homogeneous;
4) the flow through porous medium remains isothermal (room temperature).
Consequently, the Reynolds equation is simplified as
 (1)
(1)
where p is the film pressure, h is the film thickness, μ is the air viscosity, ω0 is the average flow velocity at the porous surface.
The average flow velocity ω0 in Eq (1) is then calculated by
 (2)
(2)
where q is the mass flow rate through the porous medium; A is the cross-sectional area; φ is the porosity.
The authors contend to use a modified Forchheimer equation to determine the flow rate characteristics of porous medium [25-26], and the mass flow rate q can be expressed by the following equation:
 (3)
(3)
where K is the permeability, C is the inertial coefficient, ps is the supply pressure, δ is the thickness of the porous pad, R is the gas constant, T is the temperature.
Solving eq. (1) for a two-dimensional compressible flow with a finite difference method obtains the film pressure distribution. A uniformly distributed mesh grid with 100×100 nodes is defined for the calculation, and the pressure p is assumed to equal the atmospheric pressure at the boundary of the square region. Firstly, each node is initialized with atmospheric pressure, and the Euler explicit method is used considering a time step 5×10⁻⁶ s. Although it is a time-independent problem, this method is preferred to implicit methods for its simplicity, especially in solving the Reynolds equation coupled with the equation of supply air flow. An iteration routine is applied, and the pressure data are updated after every iteration cycle until the calculation converges. Steady load capacity is obtained according to the pressure distribution, while the air consumption is computed considering four sides of the calculating region with the following equation:
 (4)
(4)
where qx is the flow rate component in x direction, qy is the flow rate component in y direction.
2.2 Numerical optimization
The common objectives for optimizing a porous air conveyor can be the followings: 1) maximizing load capacity; 2) minimizing air consumption, and it equals that considering such two objective functions to minimize:
 (5)
(5)
where X is the vector of the design variables, G is the air consumption, W is the load capacity.
The multi-objective optimization methodology is aimed to seek the Pareto optimal set of solutions, which is defined as follows: a design variable vector x*∈Ω is Pareto optimum for eq. (4) if and only if there exists no vector x∈Ω with the characteristics:
 for all i, i= 1, 2, …, n
 for at least one i, i=1, 2, …, n
Since the solution x* is no worse than x in all objectives and x* is strictly better than x in at least one objective, it can be said that x* is non-dominated by x. The multi-objective optimization using NSGA-II follows the following procedure.
1) A first generation of individuals X is randomly initialized within the specified ranges, and before the selection is performed, the population is sorted based on the nondomination.
2) Each individual is assigned a rank (or fitness) equal to its nondomination level. The smaller the rank is, the better the individual is. for example, 1 is the best level, 2 is the next-best level, and so on.
3) Selection, crossover, and mutation operators are used to create an offspring population. Then, the parent and offspring populations are combined in order to preserve elitism.
4) The parent population is replaced by the best members of the combined population considering the rank and crowding distance. Then, the new parent population is again used for selection, crossover, and mutation to create a new offspring population.
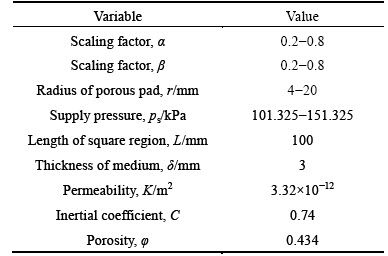
In this work, floating point coding GA is chosen. The population size is 60 and evolves to the 300th generation. The crossover probability is 0.8 and mutation probability is 0.1. Four variables, the supply pressure ps, the radius of the porous pad r, and the scaling factors α and β, are chosen as the design variables for the optimization. The ranges selected are 101.325- 151.325 kPa for ps, 4-20 mm for r, and 0.2-0.8 for α and β. The state variables, such as the square length L, permeability K, and inertial coefficient C, are set according to the actual operating conditions, as specified in Table 1. Moreover, overlaps for any two porous pads are not allowed, and of course, all of the porous pads must locate within the square region. Therefore, the design variables are also under the following constraints: 1) 100α–2r>0; 2) 100β–2r>0; 3) 100(1-α)–2r>0; 4) 100(1-β)–2r>0.
Table 1 Variables to run optimization
2.3 Deformation calculation of glass sheet
When the glass sheet is subjected to unevenly distributed pressure, it will exhibit a deformation which is significant for performance evaluation of the air conveyor system. The deformation of the glass sheet was calculated using ANSYS, a nonlinear FEM program, to solve the equation of elasticity. A quadrilateral thick-shell element was used. The grid formation for calculating the glass sheet deformation is the same as that for the calculation of pressure distribution by the Reynolds equation. 100 mm square is divided into 100 grids in both x and y directions. It is assumed that the glass sheet is supported on the four sides. The film pressure and the gravity force were imposed on the glass sheet surface as distributed loads.
The calculation procedure is as follows: 1) Assume that at a certain initial height the glass sheet is flat. 2) Calculate the pressure distribution by the modified Reynolds equation. 3) Calculate the deformation of the glass sheet with the distributed film pressure using ANSYS to obtain the deformation and the flotation height. 4) Repeat steps 2 and 3 until the pressure distribution and the deformation of the glass sheet converge.
3 Experimental setup
3.1 Pressure distribution
Accuracy of the theoretical model can be examined by a comparison between the experimental results and calculated results in pressure distribution. Figure 3 shows a sketch and a photograph of the apparatus used for pressure distribution measurement. The porous pads employed in the experiment were fabricated by sintering SUS316L powder into a plate shape under a temperature above 1000 °C. By measuring the flow rate characteristics under the same pressure condition, four porous pads with the same flow properties were selected from 200 specimens. Each porous pad has a diameter of 20 mm, a thickness of 3 mm and a porosity of 0.434. The determined permeability and inertial coefficient are 3.32×10⁻¹² m2 and 0.74, respectively. These porous pads are adhesively bonded to a metal sleeve to form a test element. A sliding bar containing a small tap hole (0.5 mm diameter) and an internal connecting perforation (3.5 mm diameter) was inserted through the middle of the stationary table. A wire displacement sensor (MLS-12, Microtech Laboratory Inc.,) is placed at one end of the bar to record the location of the bar. At the other end, a pressure sensor (KL17, Nagano Keiki Co., Japan) is connected to the pressure tap through the internal perforation. In this way, the pressure distribution can be obtained by recording the pressure while moving the sliding bar. The stationary table is arranged on the top of an elevating table to make it vertically moveable. The test element can be fixed on the support and kept in parallel with the stationary table by the following steps: 1) Place the test element on the stationary table and then set down three pins so that their tips touch the top of the sleeve. 2) Turn the pin clamps until the pins are held tightly, and then preload the spring to make the sleeve to be pulled upward so that the test element is fixed to the support. The vertical position of the stationary table is adjusted by the elevating table, whose displacement canbe read through a laser displacement sensor with a resolution of 0.1 μm (LK-G30, Keyence Co., Ltd). By this means, the clearance between the test element and the stationary table becomes adjustable and measurable.
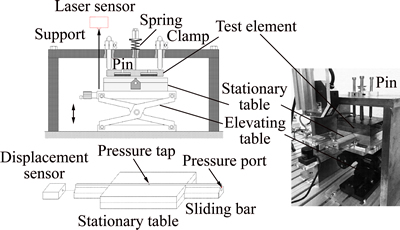
Fig. 3 Apparatus for pressure distribution measurement
3.2 Load capacity
Figure 4 shows a schematic diagram and a photograph of the apparatus used for measuring the relationship of the supporting force F to clearance h with a constant supply flow rate. A plate is fixed on one end of the shaft which is supported by an air guide (S301301, New way bearing Co., Ltd.) that has a high linear precision (less than ±3 μm deviation from the sliding direction). Therefore, the shaft and the plate can slide back and forth along the air guide with high parallel precision and no friction. The method mentioned in pressure distribution measurement is also used to fix the test element in parallel with the plate. On the other end of the shaft a force sensor (LVS-500GA, Kyowa electronic Instruments) is placed on a slider, and the mounting head of the force sensor contacts with the shaft. The back-and-forth position of the slider can be finely adjusted by turning a micrometer so that the force sensor, shaft, and plate move to change the clearance h between the test element and the plate. Furthermore, the variation of the clearance can be directly detected by the laser sensor. The gravity of the plate and shaft, denoted by F0, always acts on the force sensor. When the plate is approaching the test element, pressurized air film applies a force F to the plate. F can be calculated by subtracting F0 from the reading of the force sensor. By this means, the F-h curve can be obtained.
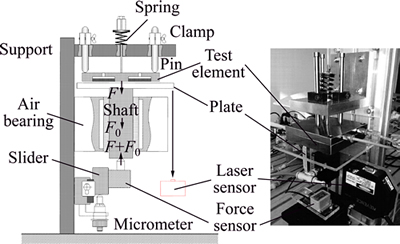
Fig. 4 Apparatus for measurement of supporting force versus clearance
3.3 Air supply circuit
Air supply circuit for the experiments is shown in Fig. 5. Compressed air is supplied and regulated to an appropriate pressure. A thermal type flow meter (SFE1, Festo Co., Ltd.) is installed to make sure that the supply flow rate is kept unchangeable during the experimental process, and a buffer tank is placed to stabilize the supply pressure.
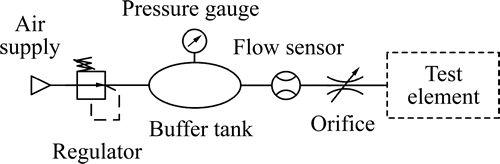
Fig. 5 Air supply circuit
4 Results and discussion
A normal design arranges the porous pads symmetrically at the corners of the square area with the scaling factors α and β both equal to 0.5. The same scaling factor is used to keep the distances of the porous pads proportional to the size of the square area. Figure 6 shows the pressure distribution on dashed lines AA' and BB' (refer to Fig. 2) in the case that supply flow rate of the loop is set to 2 L/min (ANR) and clearance h is 0.2 mm. Clearly, the pressure distribution is symmetrical with respect to the centerline and the pressure on the porous surface is higher than in other area. Careful observation shows that the pressure peak on the line AA' somewhat deviates from geometric centre of the porous region. This is because the film pressure in the converging portion of the airflow is larger than that in the diverging portion and therefore causes a nonuniform pressure distribution at the boundary of the porous region. Air flows through porous media into the gap and the pressure drops when air leaves the porous region moving into the periphery region due to the pressure loss which is caused by viscous friction and velocity variation. Since the flow velocity in the converging portion is relatively small, the film pressure, of course, exhibits a larger value than that in the diverging portion. In addition, for the converging part of the air film, a flat pressure distribution on the line BB' is observed because airflow is almost completely stagnated. In contrast with this, in the diverging portion of the air film, a steep drop of pressure towards the edge of the square region is observed. In Fig. 6, we noticed that the curves obtained by thecalculating model can reproduce all the features of the distribution shape and provide a satisfactory approximate in comparison with the experimental value. The reason for the slight differences might lie in the simplification of the model, or the error of the experimental results. However, we believed that the theoretical model is applicable and such an error will not impede the analysis on optimization.
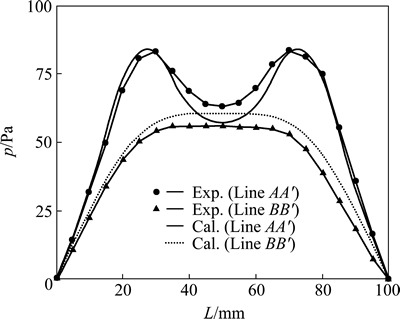
Fig. 6 Pressure distribution
Figure 7 gives a comparison between the initial population and the Pareto set (the last generation) in terms of load capacity versus supply flow rate in the case h=150 μm. The load capacity and supply flow rate are made in a normalized transformation by dividing their maximum amount. It is found that the load capacity increases with the supply flow rate. This result indicates that maximization of the load capacity conflicts with minimization of the flow rate. The Pareto points are distributed on the upper-left portion to show the optimal tradeoff between load capacity and air consumption. The Pareto set provides a few selectable solutions rather than the best design or decision. The designer can choose one or more solutions from the Pareto set according to the actual problem-related factors. For the Pareto set in this work, the supply pressure ps is with the maximum value; the radius of the porous pad r is within the range 4-13 mm; and the scaling factors α and β are both less than 0.5.
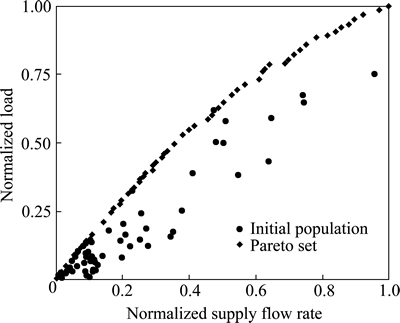
Fig. 7 Load capacity versus flow rate for initial population and Pareto set (h=150 μm)
A sensitivity analysis is performed to evaluate the influence of the design variables on the relationship between load capacity and supply flow rate. Three points on the Pareto set are selected, as listed in Table 2. Modifying one design variable at a time obtains the deviation from the Pareto set, as shown in Figs. 8 and 9. The arrows in the figures indicate the tendency when the variable is increased. When ps or r increases shifting from the optimum solution, the calculation results never deviate from the Pareto front, implying that there is noobvious loss in load capacity. But, when scaling factor α or β increases, the load capacity decreases greatly at the same flow rate. Inversely, it is not difficult to understand that the load capacity tends to be greater than that of the Pareto set points when factor α or β decreases compared to the Pareto set points. Therefore, the scaling factors α and β must be determined with care since they are sensitive variables to the performance, while the other two design variables, the supply pressure ps and the radius of the porous pad r, are defined to obtain the desired load capacity. It should also be noted that the NSGA-II method in use only provides conservative solutions, but not necessarily a best solution with the largest capacity. For porous air conveyors in actual use, the supply pressure, which is only several kPa issued by air blowers, is hardly stabilized, and expansion of the porous region results in much higher cost. In this case,changing the scaling factors α and β seems like the best solution to optimization of the porous air conveyor.
Table 2 Parameters of points of Pareto set selected for sensitivity analysis
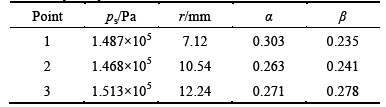
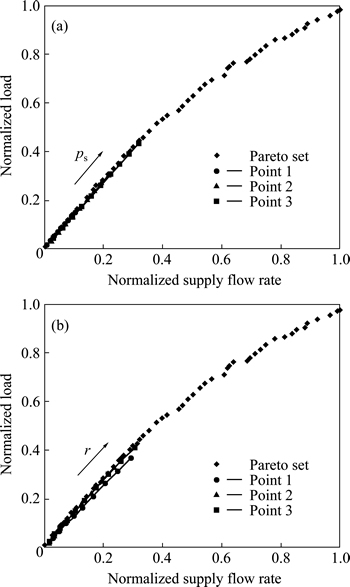
Fig. 8 Deviation from Pareto set by changing supply pressure ps (a) and radius r (b) of porous pad
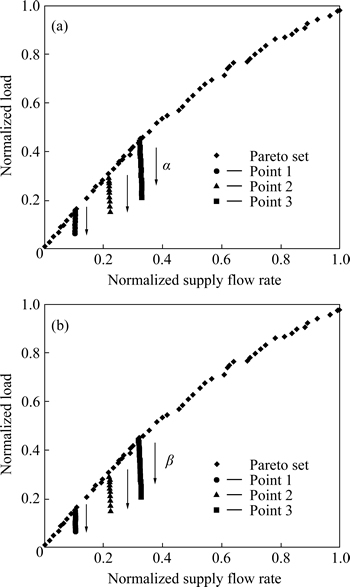
Fig. 9 Deviation from Pareto set by changing scaling factors α (a) and β (b)
Figure 10 shows the scaling factor ratio α/β versus load capacity for the Pareto set. As the load capacity enlarges, the scaling factor ratio α/β shows a trend of equalling 1, which means that the scaling factors α and β should correspond to the geometry in order to attain a comparative large capacity. As a result, a reasonable solution with α=0.409, β=0.405 and r=10 mm is selected from the optimal set to compare with the normal design (α=β=0.5, r=10 mm). Using the experimental apparatus shown in Fig.4, the curve of the supporting force versus the clearance can be obtained. Figure 11 shows the experimental results under a supply flow rate of 2 L/min (ANR). Observation shows that the optimized air conveyor can greatly improve the load capacity with the same air consumption at a certain clearance. As an example, assume that a work piece is levitated at the height of 200 μm, the normal design generates a 0.38 N supporting force, while the optimized air conveyor is 0.58 N. Figure 12 gives a contrast of the experimental pressure distributions before and after the optimization. Observation shows that the present optimization method evidently increases the film pressure at the central area to enhance the load capacity, but contributes little at the peripheral area. If a flexible glass sheet is levitated on the air conveyor, optimization conducted in such a way is likely to aggravate the uneven distribution of film pressure between the central and the peripheral areas, which thus causes a great deformation to the glass sheet. As a result, deformation of the glass sheet must be taken into account when this optimization method is in actual use. Figure 13 shows a comparison of the deformation of the glass sheet before and after the optimization. In the calculations, it was assumed that the glass sheet is initially flat and supported on the four sides with a height of 200 μm. In the figures, zero displacement corresponds to the floating height of 200 μm. It is observed that the flatness deteriorates to 3.7 μm after the optimization. Although the optimization result brings a larger deformation, we contend that it is acceptable with the flatness less than 5 μm. However, to add the deformation constraint into the optimization calculation is undesirable because it will greatly intensify the complexity of the computation.
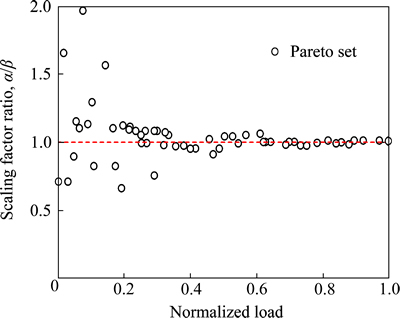
Fig. 10 Relation between scaling factor ratio α/β and load capacity
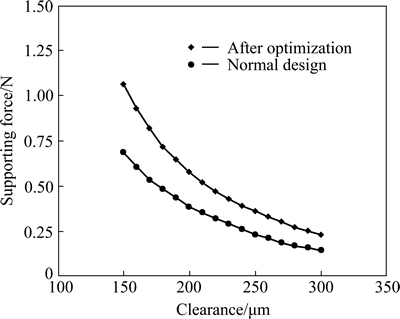
Fig. 11 Supporting force versus clearance before and after optimization (Q=2 L/min)
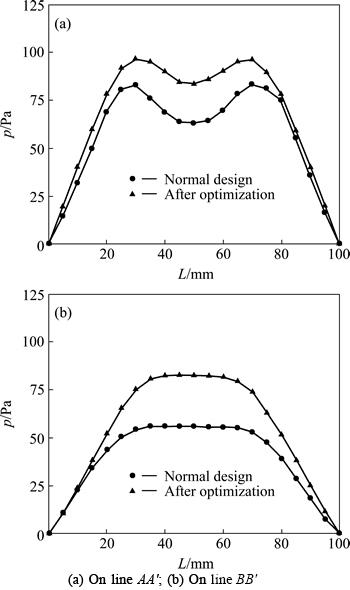
Fig. 12 Experimental pressure distribution before and after optimization (h=200 μm, Q=2 L/min):
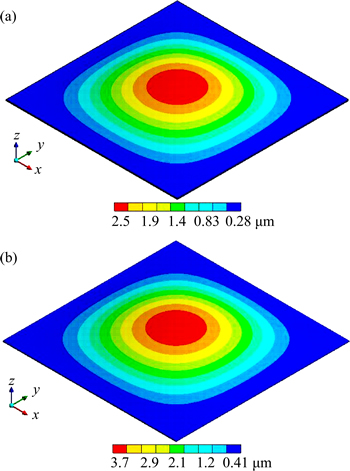
Fig. 13 Deformation of glass sheet before (a) and after (b) optimization (h=200 μm, Q=2 L/min)
5 Conclusions
This work provides an insight into the optimization design of a noncontact partial porous air conveyor. A theoretical model including the flow property of porous media and the Reynolds equation is established, and solved by a finite difference method to obtain the pressure distribution. An experimental apparatus is also built to measure the pressure distribution. Comparison of the experimental and calculated results verified the validation of the theoretical model, with which an optimization method using nondominated sorting genetic algorithm-II (NSGA-II) is applied for a two-objective optimization to achieve a good compromise of load capacity and air consumption. The method can obtain a uniform Pareto optimal set in objective space, and thus facilitates the design of porous air conveyors. The results of the optimization are compared with a sensitivity analysis shifting from the Pareto set and modifying one parameter at a time to clarify the influence of each parameter on the characteristics of the air conveyor. The analysis indicates that the scaling factors, which denote the position of the porous pads, have significant impact on the performance and of course must be determined with care. Load capacity of the optimized air conveyor is investigated in comparison with a normal design, and the experimental results confirmed that the optimization method can obviously increase the load capacity of the air film. However, deformation of the glass sheet must be taken into account for performance evaluation of the air conveyor.
References
[1] DEVITT D. The physics of glass flotation [J]. Semiconductor International Japan, 2009, 5: 20-25.
[2] CANDAELE V, LAMBERT P, DELCHAMBRE A. Non-contact handling in microassembly: acoustical levitation [J]. Precision Engineering, 2005, 29: 491-505.
[3] CHANDRA C J G, SPINIVAS Y L, SEETHARAMU K N, PARAMESWARAN M A. Investigation of air film conveyor pressurized through multiple holes [J]. Finite Elements in Analysis and Design, 1990, 6: 235-243.
[4] FOURKA M, BONIS M. Comparison between externally pressurized gas thrust bearings with different orifice and porous feeding systems [J]. Wear, 1997, 210: 311-317.
[5] LUONG T S, POTZE W, POST J B, van OSTAYEN R A J, van BEEK A. Numerical and experimental analysis of aerostatic thrust bearings with porous restrictors [J]. Tribology International, 2004, 37: 825-832.
[6] BELFORTE G, RAPARELLI T, VIKTOROV V, TRIVELLA A. Permeability and inertial coefficients of porous media for air bearing feeding systems [J]. ASME Journal of Tribology, 2007, 129: 705-711.
[7] LEE H G, LEE D G. Design of a large LCD panel handling air conveyor with minimum air consumption [J]. Mechanism and Machine Theory, 2006, 41: 790-806.
[8] AMANO K, YOSHIMOTO S, MIYATAKE M, HIRAYAMA T. Basic investigation of noncontact transportation system for large TFT-LCD glass sheet used in CCD inspection section [J]. Precision Engineering, 2011, 35(1): 58-64.
[9] OIWA N, MASUDA M, HIRAYAMA T, MATSUOKA T, YABE H. Deformation and flying height orbit of glass sheets on aerostatic porous bearing guides [J]. Tribology International, 2012, 48: 2-7.
[10] HASHIMOTO H, MATSUMOTO K. Improvement of operating characteristics of high-speed hydrodynamic journal bearings by optimum design, Part I: Formulation of methodology and its application to elliptical bearing design [J]. ASME Journal of Tribology, 2001, 123(4): 305-312.
[11] WANG N Z, CHANG L H, CHA K C. Engineering optimum design of fluid-film lubricated bearings [J]. Tribology Transactions, 2000, 43(3): 377-386.
[12] KANG T S, CHOI D H, JEONG T G. Optimal design of HDD air-lubricated slider bearings for improving dynamic characteristics and operating performance [J]. ASME Journal of Tribology, 2001, 123: 541-547.
[13] SRINIVAS N, DEB K. Multi-objective function optimization using nondominated sorting genetic algorithms [J]. Evolutionary Computations, 1995, 2(3): 221-248.
[14] HIRANI H, SUH N P. Journal bearing design using multiobjective genetic algorithm and axiomatic design approaches [J]. Tribology International, 2005, 38: 481-491.
[15] BHAT N, BARRANS S M. Design and test of a Pareto optimal flat pad aerostatic bearing [J]. Tribology International, 2008, 41: 181-188.
[16] WANG N Z, CHANG Y Z. A Hybrid search algorithm for porous air bearings optimization [J]. Tribology Transactions, 2002, 45(4): 471-477.
[17] LU C J, WANG T K. New designs of HDD air-lubricated sliders via topology optimization [J]. ASME Journal of Tribology, 2004, 126: 171-176.
[18] KOTERA H, SHIMA S. Shape optimization to perform prescribed air lubrication using genetic algorithm [J]. Tribology transactions, 2000, 43(4): 837-841.
[19] WANG N, TSAI C M, CHA K C. Optimum design of externally pressurized air bearing using cluster open MP [J]. Tribology International, 2009, 42: 1180-1186.
[20] WANG N Z, CHANG Y Z. Application of the genetic algorithm to the multi-objective optimization of air bearings [J]. Tribology Letters, 2004, 17(2): 119-128.
[21] HIRANI H. Multiobjective optimization of a journal bearing using the Pareto optimality concept [J]. Proceedings of the Institution of Mechanical Engineers, Part J: Journal of Engineering Tribology, 2004, 218(4): 323-336.
[22] BOEDO S, ESHKABILOV S L. Optimal shape design of steadily loaded journal bearings using genetic algorithms [J]. Tribology Transactions, 2003, 46(1): 134-143.
[23] ZENGEYA M, GADALA M. Optimization of journal bearings using a hybrid scheme [J]. Proceedings of the Institution of Mechanical Engineers, Part J: Journal of Engineering Tribology, 2007, 221(5): 591-607.
[24] FEDERICO C, MARCELLO C. Multi-objective optimization of a rectangular air bearing by means of genetic algorithms [J]. Journal of Mechanics Engineering and Automation, 2012, 2: 355-364.
[25] ZHONG W, LI X, LIU F H, TAO G L, LU B, KAGAWA T. Measurement and correlation of pressure drop characteristics for air flow through sintered metal porous media [J]. Transport in porous media, 2014, 101(1): 53-67.
[26] ZHONG W, TAO G L, LI X, KAWASHIMA K, KAGAWA T. Determination of flow rate characteristics of porous media using charge method [J]. Flow Measurement and Instrumentation, 2011, 22: 201-207.
[27] DEB K, PRATAP A, AGARWAL S. A fast and elitist multi-objective genetic algorithm: NSGA-II [J]. IEEE Transactions on Evolutionary Computation, 2002, 6(2): 182-197.
(Edited by YANG Hua)
Foundation item: Project(51205174) supported by the National Natural Science Foundation of China; Project(2014M550309) supported by the Postdoctoral Science Foundation of China; Project(GZKF-201407) supported by the Open Foundation of the State Key Laboratory of Fluid Power Transmission and Control, China
Received date: 2014-12-09; Accepted date: 2015-04-20
Corresponding author: ZHONG Wei, Associate Professor; Tel: +86-511-84445385; E-mail: zhongwei@just.edu.cn

