Paste-like cemented backfilling technology and rheological characteristics analysis based on jigging sands
ņī‘ī∆ŕŅĮ£ļ÷–ńŌīů—ß—ßĪ®(”Ęőńįś)2017ńÍĶŕ1∆ŕ
¬Řőń◊ų’Ŗ£ļÕű–¬√Ů őļ≥Ś ’Ň‘∆ļ£ ’Ň«’ņŮ
őń’¬“≥¬Ž£ļ155 - 167
Key words£ļpaste-like slurry; jigging sands; shear thinning; Casson fluid model; backfilling system
Abstract: To make backfilling body meet strength requirement, physical-chemical evaluation and proportioning tests were conducted on several backfilling materials. Jigging sands, #32.5 cement and fly ash were determined as backfilling aggregate, binding material and modified material, respectively. An optimized proportion of backfilling materials with a solid mass fraction of 78% and cement: fly ash: jigging sands mass ratio of 1:2:14, was suggested to Jiangan Pyrite Mine, China. The slurry made by optimized proportion produced obvious shear thinning phenomena, and was confirmed as paste-like slurry. To analyze its rheological characteristics, L-type pipeline test and Haake VT550 rotational viscometer test were conducted. Bingham and Casson fluid models were applied to several paste-like slurry samples to simulate flow and stress states; Casson fluid model was proved to have better simulation effect on paste-like slurry with shear thinning phenomena; rheological parameters of backfilling slurry made by suggested proportion were measured. Initial yield stress, average apparent viscosity and limiting viscosity are 55.35 Pa, 1.216 Pa°§s and 0.48 Pa°§s, respectively. Compared with Bingham fluid model, Casson fluid model has a better simulation effect on paste-like slurry with shear thinning phenomena, through calculating the residual standard deviations.
J. Cent. South Univ. (2017) 24: 155-167
DOI: 10.1007/s11771-017-3417-9

WEI Chong(őļ≥Ś), WANG Xin-min(Õű–¬√Ů), ZHANG Yun-hai(’Ň‘∆ļ£), ZHANG Qin-li(’Ň«’ņŮ)
School of Resources and Safety Engineering, Central South University, Changsha 410083, China
 Central South University Press and Springer-Verlag Berlin Heidelberg 2017
Abstract: To make backfilling body meet strength requirement, physical-chemical evaluation and proportioning tests were conducted on several backfilling materials. Jigging sands, #32.5 cement and fly ash were determined as backfilling aggregate, binding material and modified material, respectively. An optimized proportion of backfilling materials with a solid mass fraction of 78% and cement: fly ash: jigging sands mass ratio of 1:2:14, was suggested to Jiangan Pyrite Mine, China. The slurry made by optimized proportion produced obvious shear thinning phenomena, and was confirmed as paste-like slurry. To analyze its rheological characteristics, L-type pipeline test and Haake VT550 rotational viscometer test were conducted. Bingham and Casson fluid models were applied to several paste-like slurry samples to simulate flow and stress states; Casson fluid model was proved to have better simulation effect on paste-like slurry with shear thinning phenomena; rheological parameters of backfilling slurry made by suggested proportion were measured. Initial yield stress, average apparent viscosity and limiting viscosity are 55.35 Pa, 1.216 Pa°§s and 0.48 Pa°§s, respectively. Compared with Bingham fluid model, Casson fluid model has a better simulation effect on paste-like slurry with shear thinning phenomena, through calculating the residual standard deviations.
Key words: paste-like slurry; jigging sands; shear thinning; Casson fluid model; backfilling system
1 Introduction
Jigging sands is a tailing generated from mineral jigging process. In mineral jigging process, water and particles jump regularly with pulse air, particles can be stratified according to their own specific gravity. Jiangan Pyrite Mine (JPM) of the Tengfei Mine Group (TMG), Sichuan, China, generated 2.15°Ń105 t of jigging sands and 3.85°Ń104 t of flotation tailings annually. Tailings pond in JPM has been full, and jigging sands has polluted environment and occupied a large amount of land; it is a hidden danger to induce debris flows.
JPM is a coal-bearing pyrite mine which has been exploited to +265 m mining level. Many gobs have been formed, due to the poor stability of wall rocks, several gobs have been filled by collapsed wall rocks. If gobs and ground pressure are not managed, it would cause hidden trouble in safety in deep mining levels and influence mine production efficiency. TMG decides to backfill jigging sands into gobs; consequently, an optimized backfilling technology must be put forward to solve environmental and industrial production problems.
With mining depth increasing, hydraulic backfilling consumes a large amount of water and can not meet strength requirement; paste backfilling causes huge wear to backfilling pipelines and produces large cost in paste preparation and high-pressure pumps [1]. Paste-like backfilling does not have these disadvantages. Paste-like slurry can form structural flow, and it has fine flowability, high mass fraction and small dewatering amount, which contribute to pipeline transportation and backfilling body quality [2].
Due to the large particle size of jigging sands, backfilling slurry made of #32.5 cement and jigging sands cannot form a stable structural flow, this lead to segregation phenomena, blockage in pipelines and backfilling system failure. Ardealite and fly ash are generated from local chemical factory and thermal power plant respectively; they are both fine aggregates and good modified materials [3]. To improve backfilling slurry quality, proportioning tests were conducted to determine which should be the modified material and optimize mass fraction and mass ratio. Rheological tests based on L-type pipeline and VT550 viscometer were conducted to analyze the rheological characteristics of paste-like slurry. Solving above key problems would provide technology support to backfilling system design.
2 Physical-chemical evaluation
Physical-chemical properties of backfilling materials have important influences on pipeline transportation characteristics and backfilling body°Įs mechanical properties such as strength, compressibility, permeability and drainability. In order to accurately measure the physical properties and chemical compositions, oxides covering the surface of backfilling materials have been removed before sampling process.
2.1 Physical-chemical properties
Four main backfilling materials were provided by JPM: jigging sands, flotation tailing, ardealite and fly ash. The chemical compositions were measured by titrimetric method. Main physical properties, including specific gravity, dry density, permeability and particle size distributions, were measured by specific methods and instruments. The chemical compositions, main physical properties and particle size distributions are listed in Tables 1®C3 respectively.
2.2 Quality evaluation
As for jigging sands and flotation tailings, Al2O3 and SiO2 account for more than 60% (mass fraction), with CaO, Fe2O3 and oxides of Na and S accounting for less than 5% for each, and traces of As, Mg, P, Pb and Zn less than 1% for each. As for fly ash, Al2O3, Fe2O3 and SiO2 account for more than 70%, with CaO, Pb and oxides of Na and S accounting for less than 5% for each, and traces of As, K, Mg, P and Zn less than 1% for each.
As for ardealite, CaSO4 accounts for most of the composition, and a small amount of SiO2 and oxides of Na are contained, with other chemicals accounting less than 1%; only ardealite contains F with a trace of 0.017% of its composition.
Table 1 Main chemical compositions of backfilling materials
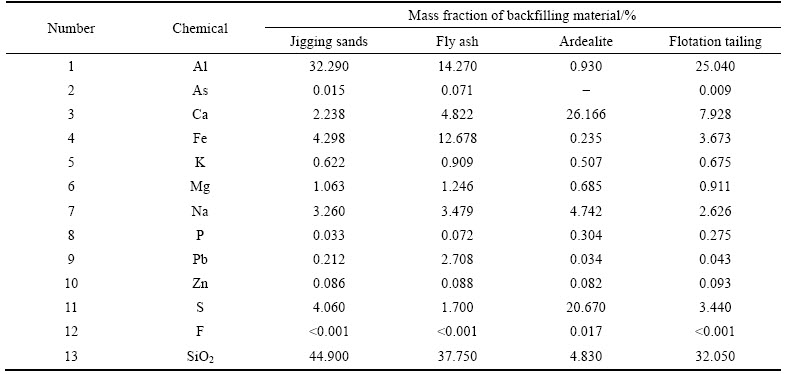
Table 2 Main physical-mechanical properties of backfilling materials

Table 3 Particle size distributions of backfilling materials
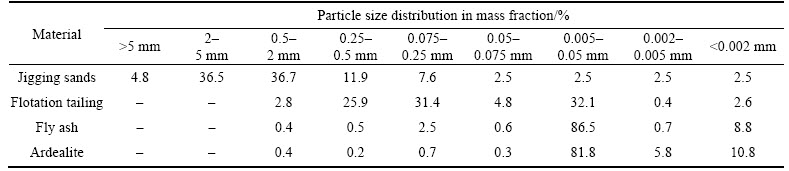
Jigging sands are coarse and the particles whose sizes larger than 0.5 mm account for 78% of the volume; the median size of its particles corresponds to 1.442 mm, and the particles whose sizes are smaller than 0.075 mm is only 2.5%; particles with large sizes contribute to reinforcing the backfilling body strength, and the loss of small size particles leads to segregation phenomena, blockage and wear in pipelines.
Flotation tailings are fine, with a median size of particles corresponding to 0.110 mm; the permeability coefficient corresponds to 3.91°Ń10®C8 cm/s, this low value goes against dewatering of backfilling body; however, fine particles cause less wear of pipelines and contribute to pipeline transportation of backfilling slurry.
Compared to ardealite, particle size of fly ash is smaller; the median particle size of fly ash and ardealite are 0.016 and 0.010 mm, respectively; both of their permeability coefficients are small, these low values go against dewatering of the backfilling body; however, their nonuniform coefficients are small and contribute to forming a stable structural fluid of backfilling slurry; hence, fly ash and ardealite can be used as modified materials to improve transportation performance of backfilling slurry.
The compressibility coefficient and compression modulus of jigging sands are 0.234 and 6.3 MPa, respectively, with pressure ranging from 100 to 200 kPa; because of weak compressibility, settling volume of backfilling body is small, and roof-contacted backfilling craft can be implemented successfully.
Due to the fact that #32.5 cement is alkaline, the acidity of backfilling aggregate can be neutralized after the backfilling body formed by specific mass fractions and mass ratios.
Comprehensively considering the physical-chemical properties and discharging abilities of backfilling materials in JPM, it is reasonable to choose jigging sands as the main backfilling aggregate; the choice of modified materials needs further arguments by conducting proportioning tests.
3 Proportion optimization
Proportion of backfilling materials is the most important basis of backfilling system design; it should meet requirements of backfilling body strength, pipeline transportation, and economic conditions. Optimized parameters of proportion such as mass fraction and mass ratio were determined by proportioning test and analysis; these optimized parameters were suggested to JPM for actual backfilling engineering.
3.1 Proportioning test
Slurry samples were made by different proportions of backfilling materials under normal temperature condition; after being mixed intensively, slurry was poured into a standard tri-unit model of 7.07 cm°Ń 7.07 cm°Ń7.07 cm; after certain maintenance periods, 8 cube specimens for each proportion were formed; numbered the specimens and put them into curing box for maintenance; uniaxial compressive strength tests were carried out on specimens cured for 3, 7 and 28 d by the WDW-2000 rigid hydraulic pressure servo machine; and the normal stress is calculated by
 (1)
(1)
where P is press load; S is press area.
The purpose of proportioning test is to determine the optimized modified material and measure proportion parameters, with #32.5 cement acting as binding material; these parameters are mass ratio, cement-sand ratio and mass fraction. The tests were divided into 3 groups by different backfilling materials collocations: jigging sands group (J), jigging sands and ardealite group (JA), jigging sands and fly ash group (JFA). The results of proportioning tests are listed in Tables 4®C6.
3.2 Analysis of results
The relationship curve of mass fraction and compressive strength at a certain mass ratio (cement: jigging sands of 1:12) is shown in Fig. 1. Compressive strength of specimen J9 (solid mass fraction, w(s)=80%, cement: jigging sands mass ratio of 1:12) cured for 28 d is 0.446 MPa; it is more than twice of compressive strength of specimen J7 (w(s)=76%, cement: jigging sands mass ration of 1:12) cured for the same period. It shows that the mass fraction of backfilling slurry actually reflects the value of water- cement ratio; mass fraction has a direct influence on compressive strength of backfilling body. When mass fraction gets higher, the uniaxial compressive strength of samples becomes larger; backfilling body strength can be improved through increasing the mass fraction and then reducing the dewatering amount.
The relationship curve of cement-sand ratio and compressive strength at a certain mass fraction (of which the value is 78%) is shown in Fig. 2. The amount of binding material is the key factor influencing backfilling body strength when mass fraction of backfilling slurry is unchanged; compressive strength of specimen J11 (w(s)=78%, cement: jigging sands mass ratio of 1:15) cured for 7 d is 0.063 MPa, while for specimen J2 (w(s)= 78%, cement: jigging sands mass ratio of 1:8) which was cured for the same period, the compressive strength is 0.296 MPa; it shows that compressive strength of backfilling body becomes larger significantly with an increasing use of binding material when other factors unchanged.
Table 4 Results of uniaxial compressive strength tests of J group
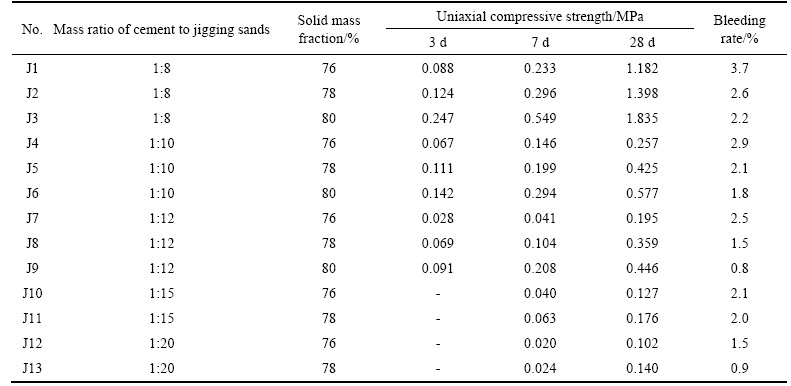
Table 5 Results of uniaxial compressive strength tests of JA group
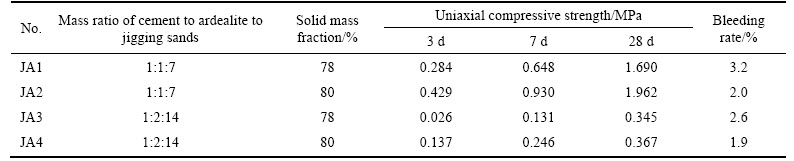
Table 6 Results of uniaxial compressive strength tests of JFA group
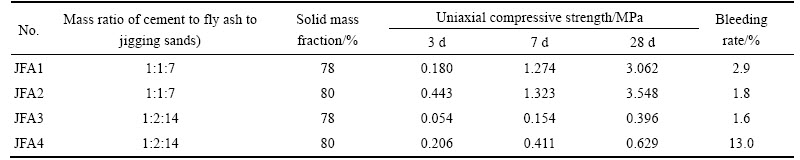

Fig. 1 Relationship curve of compressive strength and mass fraction

Fig. 2 Relationship curve of compressive strength and mass ratio of cement to jigging sand
The relationship curve of different backfilling materials collocations and compressive strength is shown in Fig. 3. The compressive strength of specimen JFA3 (w(s)=78%, cement: fly ash: jigging sands of 1:2:14) cured for 28 days is 0.396 MPa, it is larger than compressive strength of specimen J8 and JA3; so fly ash can improve backfilling body strength and has a better modification effect than ardealite.

Fig. 3 Relationship curve of compressive strength and slurry group
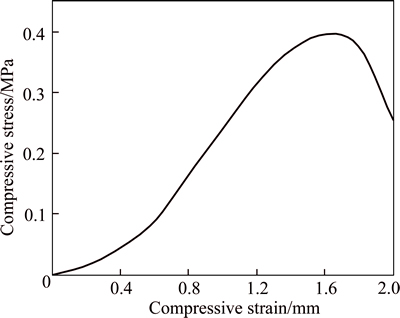
Fig. 4 Compressive stress®Cstrain curve
Residue strength of backfilling body has high elasticity and plasticity, so that backfilling body can bear the weight of the gobs efficiently after breakage; if cement-sand ratio (cement: jigging sands) is below 1:15, backfilling body strength does not change distinctly; compressive strengths of the specimens cured for 7 d and 28 d change gently, with a bit decrease within 0.05 MPa and 0.02 MPa, respectively; meanwhile, the tensile strength is far lower than the compressive strength, thus tensile stress concentration should be under consideration to reduce the possibility of forming tensile fracture when designing backfilling system.
According to safety requirements and economic efficiency, the required compressive strength of backfilling body cured for 28 d should be no less than 0.3 MPa; thus the slurry with a solid mass fraction of 78% and a mass ratio (cement: fly ash: jigging sands) of 1:2:14 is suggested to JPM.
4 Mechanism of cemented backfilling
Scanning electron microscopy (SEM) and energy spectrum analysis tests were conducted on sample JFA3 after maintenance period of 11 d (w(s)=78%, cement: fly ash: jigging sands of 1:2:14). The SEM images of different magnification and ESA images are shown in Figs.5®C6.
It can be seen from Fig. 5 that the hydration products of cement wrap the backfilling aggregate densely and equably, combining with fly ash which is also fine aggregate, so fly ash improves the grain composition of cemented backfilling body efficiently. Figure 6 shows that due to the high content of SiO2 and Al2O3, fly ash naturally owns potential cementing properties and it partly becomes succedaneum of cement; crystal grows intensively during the calcification period of fly ash, and it contributes to the formation of ettringite, which has a decisive influence on backfilling body strength; ettringite helps to enhance the expansibility of concrete to about 120% and improve flowability of backfilling slurry. The plastic strength of mutative properties is partitioned to three states during the construction formation: non-plastic strength suspended state, initial coagulation state and consolidation state [1®C3].
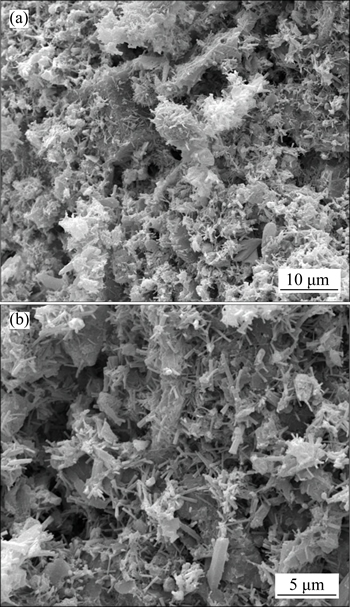
Fig. 5 SEM images of JFA3

Fig. 6 EDS results of JFA3
4.1 Non-plastic strength suspended state
The mixture of cement, fly ash and jigging sands is suspended slurry after adding water in the initial phase. A layer of rich silicon is formed on the surface of the mineral particles of fly ash and cement after adding water. And a superficial electric double layer structure is constructed on the surface of the mineral particles by absorbing calcium from solution to maintain electric equilibrium. Consequently, the slurry during the process of initial hydration is a dispersoid of solid particles with superficial electric double layer structure, and the properties and change of slurry lie on the reaction between these solid particles. At the beginning of adding water to the mixture, slurry is in suspended state with non-plastic strength that is easy to pipeline transportation, for the big space between particles and no represented force each other.
4.2 Initial coagulation state
The force of particles is embodied when the space decreases to a certain value, and the long-distance coagulation is represented at last when the Vander Waals force of attraction and the electrostatic repulsive-force are equivalent. Because the electric potential and charge reduce and the Vander Waals force of attraction keeps unchanged, two particles can adhere together. Then, the initial coagulation state is emerged for the loosen reticulation framework by reaction coagulation.
4.3 Consolidation state
The force of particles, changing from the Vander Waals force of attraction to chemical bond force or hypo-chemical bond force, makes the strength higher, along with the yield of hydration particles and decrease of space between particles. Because of the property change of the force, the subsequent hydration particles form cross-link or connect each other by nucleation on the surface of particles, the inner chemical function represents crystallization, and the outer of slurry enters consolidation state. Meanwhile, strength is high, being easy to backfill afterwards.
5 Evaluation of rheological characteristics
Rheological tests based on L-type pipeline and VT550 viscometer were respectively conducted to ascertain the flow state and fluid properties of several typical slurry samples and verify preliminary results. These tests are of great significance especially in adjusting proportion of backfilling materials, determining transportation pipeline parameters, guiding backfilling system design, etc.
5.1 L-type pipeline test
L-type pipeline test was conducted first in laboratory to observe actual flow state of several typical slurry samples. The test device is comprised of a slurry funnel and an L-type pipeline. By letting slurry flow in L-type pipeline, flow state can be observed visually; flow parameters such as flow rate, flow velocity and height of static liquid column can be measured directly; through fluid model calculation, viscosity, initial yield stress and transportation resistance would be derived. Structure and sizes of L-type pipeline are shown in Figs. 7®C8.
Contrast tests were conducted on the following slurry samples:S1(w(s)=78%, cement: jigging sands of 1:12), S2(w(s)=76%, cement: fly ash: jigging sands of 1:2:14), S3(w(s)=77%, cement: fly ash: jigging sands of 1:2:14), S4(w(s)=78%, cement: fly ash: jigging sands of 1:2:14) and S5(w(s)=80%, cement: fly ash: jigging sands of 1:2:14); appropriate amount of slurry samples were poured into the slurry funnel and started to flow by gravity in L-type pipeline. In the course of the test, some certain heights of static liquid column and corresponding slurry velocity were measured. The observation results are listed in Table 7.
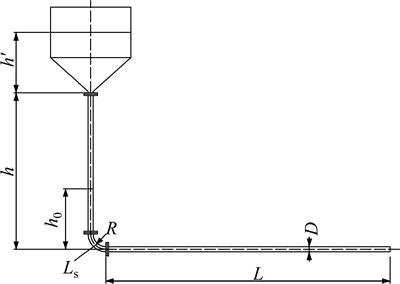
Fig. 7 Structure sizes of L-type pipeline
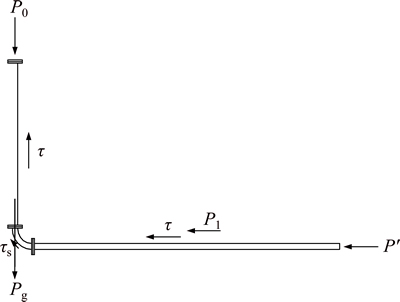
Fig. 8 Stress state of flowing backfilling slurry
Table 7 Observation results of flow states of slurry samples
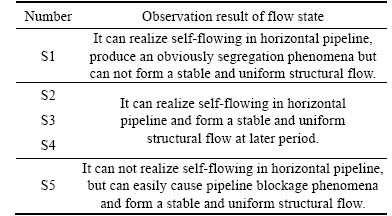
In mining industry, paste slurry is a kind of non-Newtonian fluid, which has large initial yield stress, high plastic viscosity and poor fluidity, it is commonly made of total tailings, with a mass fraction of 75%®C85% [4®C6]; paste slurry can not realize self-flowing, when transported by high pressure pump, it can move monolithically in pipeline just like squeezing a tooth paste and form a stable and uniform structural flow; while paste-like slurry is a kind of non-Newtonian fluid, which has better fluidity, smaller initial yield stress and time-varying apparent viscosity compared with paste slurry, it is commonly made of total tailings or other sands, with a solid mass fraction of 72%®C78%; paste-like slurry can realize self-flowing transportation and form structural flow at some time; the boundary value of initial yield stress to differentiate the two kinds of slurry is 180®C220 Pa [7®C10]. Analyzing the flow states and fluid appearance of slurry samples above, S5 is determined as paste slurry; S2, S3 and S4 are determined as paste-like slurry.
Bingham fluid model was applied to paste-like slurry samples S2, S3 and S4 to evaluate fluid quality and transportation performance. The analysis processes are as follows.
Slurry in L-type pipeline is assumed to have the same cross-section flow velocity, and according to Bingham rheological equation and Buckingham formula, the following equation is obtained:
 (2)
(2)
where D is pipeline diameter; V is cross-section flow velocity; ¶”0 is initial yield stress; ¶« is plastic viscosity.
The value of  is extremely small so that it can be ignored, and Eq. (1) is simplified to
 (3)
(3)
The structure sizes of L-type pipeline are shown in Fig. 7; the flowing stress state and pipeline resistance of backfilling slurry are shown in Fig. 7. According to energy conservation equation, the following can be derived:
P0+Pg=P1+P°š (4)
 (5)
(5)
 (6)
(6)
 (7)
(7)
 (8)
(8)
where P0 is inlet pressure; Pg is gravity pressure; P1 is friction head loss; P°š is outlet pressure loss; ¶√ is unit weight; u is velocity; g is gravity; ¶ői is local resistance loss coefficient.
Local losses include knee head loss and splice loss, calculation for local losses is more complicated and the equation below is derived by assuming that local losses are 10% of the resistance loss of the straight pipeline part, the equations above is simplified to
 (9)
(9)
During the test, the liquid level dropped, and velocity of slurry decreased continually to zero. Finally, the height of static liquid column in vertical pipeline was h0, gravity of the liquid column and the static friction resistance produced from the vertical pipeline got to a mechanical equilibrium, and initial yield stress of slurry is calculated by
 (10)
(10)
During the test, unit weight and velocity of slurry with different mass fractions were measured and the viscosity coefficient of slurry is calculated by
 (11)
(11)
The calculation results of initial yield stress and viscosity coefficient are listed in Table 8.
Table 8 Calculation results of yield stress and viscosity coefficient

The value of initial yield stress is the true value as the calculation method is based on equilibrium of forces and conservation of energy; while the value of viscosity coefficient is an average value of some certain actual flow states in self-flowing transportation; it can be seen from Eq. (3) that the intercept of shear rate-stress curves of paste-like slurry is determined as 4/3 the true value of the initial yield stress and the slope characterizes the value of viscosity coefficient. The simulated curves with Bingham fluid model of paste-like slurry are shown in Fig. 9.
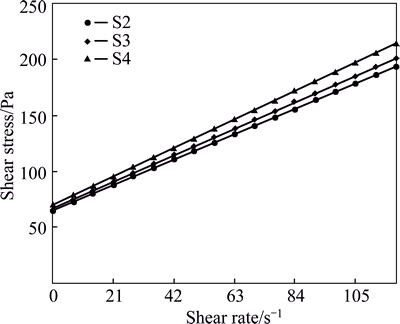
Fig. 9 Bingham fluid model curves of paste-like slurry samples
5.2 VT550 viscometer test
German Haake VT550 rotational viscometer was used to accurately track apparent viscosity, and observe the flow and stress states of paste-like slurry samples S2, S3 and S4; test results obtained by VT550 viscometer can be displayed on LCD screen and printed out by RheoWin, which is a kind of special software using VT550 viscometer. VT550 viscometer has three operation modes: control stress (CS), control rate (CR) and control displacement (CD); under these modes, a variety of curves such as fluid curve, viscosity- temperature curve, time curve and thixotropic curve can be drawn and printed out by RheoWin, and the fluid viscosity, yield and shear stress can also be measured accurately. VT550 viscometer°Įs cross-shaped rotor contributes to measuring slurry samples with high mass fraction or containing large particles; compared with traditional rotational viscometer, cross-shaped rotor barely causes damage to the flocculent structure of samples and efficiently overcomes the slip effect of cylindrical face. Shear stress and apparent viscosity of paste-like slurry samples S2, S3 and S4 were tracked under CD mode; the shear rate®Cstress curves of samples S2, S3 and S4 are shown in Figs. 10®C12.
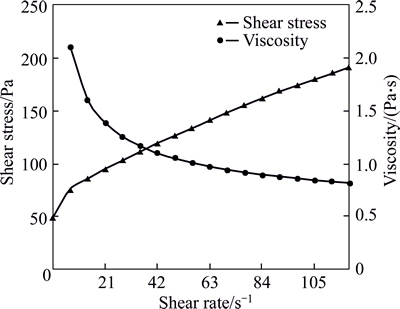
Fig. 10 Shear stress-shear rate and viscosity curves of S2
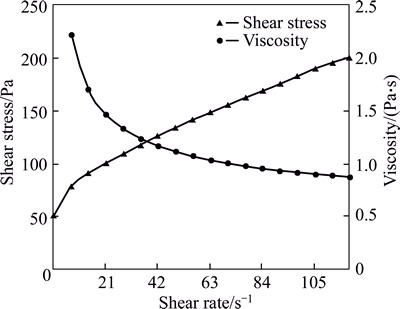
Fig. 11 Shear stress-shear rate and viscosity curves of S3

Fig. 12 Shear stress-shear rate and viscosity curves of S4
It can be seen from the curves above that paste-like slurry samples S2, S3 and S4 all belong to the class of pseudo plastic fluid with initial yield stress; they all start to flow after overcoming an initial yield stress of 48.98 Pa, 50.33 Pa and 55.35 Pa, respectively. For these three paste-like slurry samples, the shear stress increases as shear rate getting higher; at range of low shear rate (0®C35 s®C1), the apparent viscosity decreases dramatically and the relationship between shear stress and shear rate is parabolic; while at range of medium and high shear rate (higher than 35 s®C1), the apparent viscosity decreases not that significantly and the shear rate®Cstress curve seems close to a straight line; they all show up the time-varying characteristics of shear thinning phenomena, which is the viscosity decreasing as the shear rate gets higher; when shear rate increases to infinity, the apparent viscosity reaches the limiting viscosity and stays stable.
5.3 Casson fluid model
For pseudo plastic fluid with initial yield stress which shows obvious shear thinning phenomena, it is not so accurate to simulate the shear rate®Cstress curve by Bingham fluid model, because the plastic viscosity of Bingham fluid model is a constant value while the apparent viscosity of pseudo plastic fluid is time-varying. Relative to Bingham rheology model, Casson fluid model has analyzed the effect of shear thinning and the results drawn from the model performs a higher precision and a wider scope. Casson°Įs constitutive equation [11®C15] is a nonlinear relation between shear stress and shear rate, given by
 (12)
(12)
 (13)
(13)
or
 (14)
(14)
 (15)
(15)
where ¶« is the apparent viscosity; ¶”0 is the initial yield stress; ¶«°ř is limiting viscosity (viscosity at high shear rate); ¶√ is the shear rate; ¶” is the shear stress.
Casson fluid model has been employed to many industrial such as petroleum, oil paint, medical science, coating and plastics. For example, in petroleum industry, it is applied to drilling fluid to research the affection of rheological properties of drilling fluid on drilling rate, pump pressure, displacement and cuttings carrying with suspension and cementing quality; in medical science, it is applied to blood to research the causes of cerebral thrombus, coronary heart disease and acute renal failure.
There are two constant parameters in Casson°Įs constitutive equation, ¶”0 and ¶«°ř; the initial yield stress ¶”0 can be measured directly by VT550 viscometer, while the limiting viscosity ¶«°ř should be calculated by the following process:
 (16)
(16)
 (17)
(17)
 (18)
(18)
The calculated values of limiting viscosity of slurry sample S2, S3 and S4 are 0.41, 0.44 and 0.48 Pa°§s, respectively; and the initial yield stresses measured from VT550 viscometer directly are respectively 48.98, 50.33 and 55.35 MPa. The simulated curves of Casson fluid model of S2, S3 and S4 are shown in Figs. 13®C15; and the actual measured curves and simulated curves of Bingham model of S2, S3 and S4 are also contained ineach figure to compare the simulation effects of paste- like slurry samples.

Fig. 13 Simulated and actual shear stress®Cshear rate curves of S2
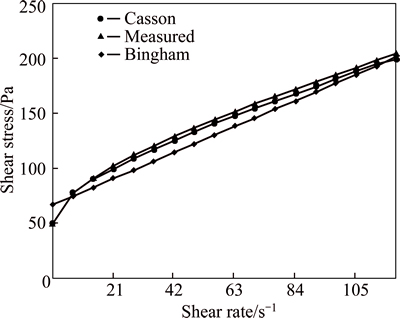
Fig. 14 Simulated and actual shear stress®Cshear rate curves of S3
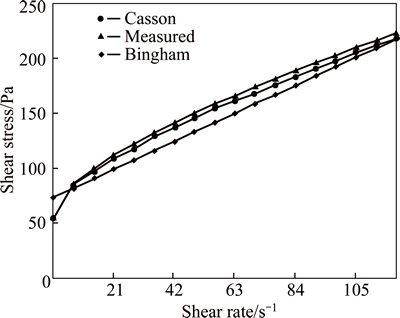
Fig. 15 Simulated and actual shear stress®Cshear rate curves of S4
To compare the simulation effect of Bingham fluid model and Casson fluid model, several observed point of slurry samples S2, S3 and S4 were selected, and their residual standard deviations of both fluid models are calculated by
 (19)
(19)
where S is residual standard deviation; yi is the calculated value of simulated fluid curve;  is the true value of actual fluid curve; Q is the residue sum of squares; fQ is the residual degree of freedom.
The results of residual of true value and simulated value of both the fluid models are shown in Tables 9®C11, and residual standard deviations of both the fluid models are listed after the tables.
Residual standard deviation for Bingham model of slurry samples S2, S3 and S4 are 6.42, 8.19 and 9.23, respectively; while for Casson model of slurry samples S2, S3 and S4 are 4.30, 3.50 and 4.90, respectively, which are lower than that of Bingham model. So Casson fluid model has a better simulation effect than Bingham model to paste-like slurry.
5.4 Analysis of results
Slurry samples S2, S3 and S4 are all determined as paste-like slurry, which is a kind of pseudo plastic fluid with initial yield stress; by observing L-type pipeline tests, slurry samples S2, S3 and S4 can form a stable and uniform structural flow at later period, they have similar performance with paste slurry in flow state; and by comparing Figs. 10®C12, slurry sample S4, which is made of suggested backfilling proportion (w(s)=78%, cement: fly ash: jigging sands of 1:2:14), has the largest initial yield stress (of which the value is 55.35 Pa), but this value is far lower than the boundary value of initial yield stress of paste and paste-like backfilling slurry (180®C220 Pa). The initial yield stress is positively associated with mass fraction; slurry sample S2, whose mass fraction is the lowest (76%) among the three paste-like slurry samples, and has the smallest initial yield stress (of which the value is 48.98 Pa); with the increasing mass fraction, particle number on unit cross section becomes larger and then the driving force to make the slurry flow gets higher.
Slurry samples S2, S3 and S4 all lead to a phenomena of shear thinning, the apparent viscosity decreases with the shear rate getting larger. It can be seen from Figs. 10®C12 that the apparent viscosity of three slurry samples all decreases dramatically within the range of shear rate of 0®C35 s®C1, and then starts to level off to their corresponding limiting viscosity; at low shear rate range, shear stress has a parabolic relationship with shear rate; while at medium and high shear rate range, the shear stress-rate curve becomes an approximate line, due to that the viscosity decreases gently at this period.
It can be concluded from Figs. 13®C15 that Casson fluid model has a better simulation effect of actual relationship between shear stress and shear rate of three paste-like samples, which have obvious shear thinning phenomena in low shear rate region. Residual standard deviations for Bingham model of slurry samples S2, S3 and S4 are 6.42, 8.19 and 9.23, respectively; while for Casson model of slurry samples S2, S3 and S4 are 4.30, 3.50 and 4.90, respectively, which are lower than that of Bingham model. Meanwhile, when deducing the derivative of the Casson°Įs constitutive equation and making shear rate to infinity, the limiting viscosity of each slurry would be derived, so Casson fluid model would also have good simulation effect on high shear rate range; but the average apparent viscosity coefficient of slurry samples S2, S3 and S4 derived from Bingham fluid model, are 1.079, 1.129 and 1.216, respectively, it would make Bingham fluid model curve deviate from the actual shear rate®Cstress curve at high shear rate range; only when the range of shear rate is large enough, the average viscosity coefficient of the Bingham model curve would approach to the limiting viscosity and then Bingham fluid model would have a good simulation effect at high shear rate range.
6 Backfilling system
According to the analysis of results of proportioning and rheological tests on backfilling materials, paste-like cemented backfilling technology is adopted to Jiangan Pyrite Mine, China, which is taking jigging sands, fly ash and #32.5 cement as the backfilling aggregate, modified material and binding material, respectively. After the backfilling materials and proportion parameters being determined, backfilling system design becomes the key factor to determine the implement results of cemented paste-like backfilling technology.
Table 9 Calculation results of residual of true value and simulated value of S2

Table 10 Calculation results of residual of true value and simulated value of S3

Table 11 Calculation results of residual of true value and simulated value of S4

Backfilling system includes preparation system and transportation system. The preparation plant for paste-like cemented backfilling system is established at the west of jigger plant. Based on on-site surveys in Jiangan Pyrite Mine, China, the transportation system and backfilling craft are determined and the process flows are shown in Fig. 16.
Jigging sands becomes dry tailing with a mass fraction of 80% after dewatering and is transported to the preparation plant by belt or shovel cars for store, and then the jigging sands is poured into hopper and transported to agitator by belt; #32.5 cement is transported by tank trucks and discharged into vertical cement bunker, when backfilling, the cement is transported to agitator by screw conveyer; fly ash is stored at fly ash yard, when backfilling, it is poured into hopper and transported to belt through feeder and then transported to agitator; waste water underground is stored in head tank and circularly used in backfilling through pipeline transportation; the backfilling slurry, which is made of these materials by suggested proportion parameters in the agitator, is transported to the mined-out gobs through pipelines and drilling holes by backfilling pumps.
7 Conclusions
1) Jigging sands, fly ash and #32.5 cement are determined as the backfilling aggregate, modified material and binding material, respectively; backfilling slurry made of optimized materials, with a mass fraction of 78% and a mass ratio of 1:2:14 (cement: fly ash: jigging sands), is suggested to JPM. Fly ash has a better modification effect than ardealite in JPM; backfilling slurry adding with fly ash has an obvious improvement in grain composition, transportation performance and backfilling body strength.
2) Slurry made of suggested backfilling proportion is determined as paste-like slurry, which can form a stable structural flow in pipelines and realize self-flowing transportation; paste-like slurry belongs to pseudo plastic fluid with initial yield stress, it has better flowability and lower initial yield stress compared with paste slurry; while at high shear rate range, they have similar flow state and properties.
3) Slurry made of suggested backfilling proportion in JPM produces evidently shear thinning phenomena, its apparent viscosity decreases dramatically at low shear rate and approaches to limiting viscosity when shear rate reaches infinity.
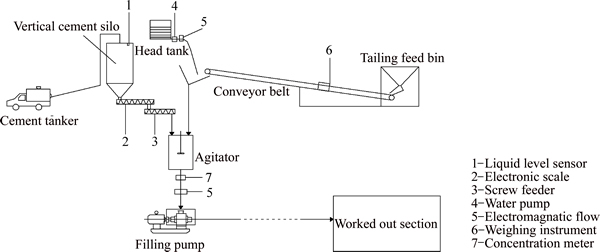
Fig. 16 Process flows of transportation system and backfilling craft in JPM
4) When modeling the flow and stress state of paste-like slurry with shear thinning phenomena, Casson fluid model has a better simulation effect than Bingham fluid model, especially at low shear rate range; the viscosity coefficient calculated by Bingham fluid model is an average value at some certain shear rate range; while through Casson°Įs constitutive equation, simulated values of shear stress and apparent viscosity at any shear rate points can be calculated.
References
[1] WANG Xin-min, ZHAO Jian-wen, XUE Jun-hua, YU Guo-feng. Features of pipe transportation of paste-like backfilling in deep mine [J]. Journal of Central South University of Technology, 2011, 18(5): 1413®C1417.
[2] WANG Xin-min, GU De-sheng, ZHANG Qin-li. Theory and technology of deep mine backfilling [M]. Changsha: Central South University Press, 2010. (in Chinese)
[3] WANG Xin-min, ZHAO Bin, ZHANG Qin-li. Cemented backfill technology based on phosphorous gypsum [J]. Journal of Central South University of Technology, 2009, 16(2): 285®C291.
[4] PENG Xin, LI Xi-bing, ZHANG Qin-li, WANG Xin-min. Quality evaluation of layerlike backfilling and flow pattern of backfill slurry in stope [J]. Journal of Central South University of Technology, 2007, 14(4): 580®C583.
[5] ZHANG Qin-li, WANG Xin-min. Performance of cemented coal gangue backfill [J]. Journal of Central South University, 2007, 14(2): 216®C219.
[6] ZHANG Qin-li, CUI Ji-qiang, ZHENG Jing-jing, WANG Xin-min, WANG Xiao-lai. Wear mechanism and serious wear position of casing pipe in vertical backfill drill-hole [J]. Transactions of Nonferrous Metals Society of China, 2011, 21(11): 2503®C2507.
[7] WANG Xin-min, ZHANG De-ming, ZHANG Qin-li, ZHAO Bin. Pipeline self-flowing transportation property of paste based on FLOW-3D software in deep mine [J]. Journal of Central South University: Science and Technology, 2011, 42(7): 2102-2108. (in Chinese)
[8] ZHANG Qin-li, HU Guan-yu, WANG Xin-min. Hydraulic calculation of gravity transportation pipeline system for backfill slurry [J]. Journal of Central South University of Technology, 2008, 15(5): 645®C649.
[9] WANG Xin-min, LI Jian-xiong, XIAO Zhi-zheng, XIAO Wei-guo. Rheological properties of tailing paste slurry [J]. Journal of Central South University of Technology, 2004, 11(1): 75®C79.
[10] WANG Xin-min, ZHAO Bin, ZHANG Qin-li, XU Dong-sheng. Cemented backfilling technology with unclassified tailings based on vertical sand silo [J]. Journal of Central South University of Technology, 2008, 15(6): 801®C807.
[11] CHEN Jia-lang, LIU Chong-jian. Structural flow of Casson fluids and determination of Casson rheological parameters [J]. Acta Petrolei Sinica, 1982, 4(2): 69®C80. (in Chinese)
[12] NADEEM S, HAQ R U L, AKBAR N S, KHAN Z H. MHD three dimensional flow of Casson fluid past a porous linearly stretching sheet [J]. Alexandria Eng J, 2013, 52(4): 577®C82.
[13] DASH R K, MEHTA K N, JAYARAMAN G. Casson fluid flow in a pipe filled with a homogeneous porous medium [J]. Int J Eng Sci, 1996, 34(10): 1145®C1156.
[14] MUKHOPADHYAY S. Casson fluid flow and heat transfer over a nonlinearly stretching surface [J]. Chinese Physics B, 2013, 22(70): 1®C5.
[15] NADEEM S, RASHID M, SHER A N. Optimized analytical solution for oblique flow of a Casson nano fluid with convective boundary conditions [J]. Int J Therm Sci, 2014, 78(1): 90®C100.
(Edited by FANG Jing-hua)
Cite this article as: WEI Chong, WANG Xin-min, ZHANG Yun-hai, ZHANG Qin-li. Paste-like cemented backfilling technology and rheological characteristics analysis based on jigging sands [J]. Journal of Central South University, 2017, 24(1): 155-167. DOI: 10.1007/s11771-017-3417-9.
Foundation item: Project(2012BAC09B02) supported by the National Science and Technology Pillar Program during the 12th Five-Year Plan Period, China
Received date: 2015-08-08; Accepted date: 2015-11-17
Corresponding author: WANG Xin-min, PhD, Professor; Tel: +86®C731®C8879821; E-mail: wxm1958@126.com

