
J. Cent. South Univ. (2020) 27: 277-287
DOI: https://doi.org/10.1007/s11771-020-4295-0

Refracturing candidate selection for MFHWs in tight oil and gas reservoirs using hybrid method with data analysis techniques and fuzzy clustering
TAO Liang(����)1, GUO Jian-chun(������)1, ZHAO Zhi-hong(��־��)1, YIN Qi-wu(������)2
1. State Key Laboratory of Oil and Gas Reservoir Geology and Exploitation,Southwest Petroleum University, Chengdu 610500, China;
2. Dagang Oilfield, Tianjin 300000, China
 Central South University Press and Springer-Verlag GmbH Germany, part of Springer Nature 2020
Abstract: The selection of refracturing candidate is one of the most important jobs faced by oilfield engineers. However, due to the complicated multi-parameter relationships and their comprehensive influence, the selection of refracturing candidate is often very difficult. In this paper, a novel approach combining data analysis techniques and fuzzy clustering was proposed to select refracturing candidate. First, the analysis techniques were used to quantitatively calculate the weight coefficient and determine the key factors. Then, the idealized refracturing well was established by considering the main factors. Fuzzy clustering was applied to evaluate refracturing potential. Finally, reservoirs numerical simulation was used to further evaluate reservoirs energy and material basis of the optimum refracturing candidates. The hybrid method has been successfully applied to a tight oil reservoir in China. The average steady production was 15.8 t/d after refracturing treatment, increasing significantly compared with previous status. The research results can guide the development of tight oil and gas reservoirs effectively.
Key words: tight oil and gas reservoirs; idealized refracturing well; fuzzy clustering; refracturing potential; hybrid method
Cite this article as: TAO Liang, GUO Jian-chun, ZHAO Zhi-hong, YIN Qi-wu. Refracturing candidate selection for MFHWs in tight oil and gas reservoirs using hybrid method with data analysis techniques and fuzzy clustering [J]. Journal of Central South University, 2020, 27(1): 277-287. DOI: https://doi.org/10.1007/s11771-020-4295-0.
1 Introduction
Tight oil and gas reservoirs represent a big percentage of unconventional resources throughout the world and have become an important successor to energy consumption worldwide [1, 2]. Due to its extremely low porosity and permeability, tight oil could not obtain significant economic benefits via conventional technology [3-5]. Multi-fractured horizontal wells (MFHWs) is the key technique to effectively develop tight oil reservoirs [6-8]. A large amount of field data show that the average daily oil production has been improved 3 to 4 times after MFHWs [9-11]. However, unconventional reservoirs have poor physical properties, lower permeability and porosity, making the flow resistance of fluid in tight rock pores very high and the horizontal wells fail to inject water for formation energy supplement [5, 12]. In addition, the artificial fractures closure with production time and strong stress-sensitivity, the conductivity of hydraulic fracture decreases [11-16], resulting in rapid daily oil production decline and adversely hindering the continuous and efficient development of tight oil reservoirs [17-19]. In order to restore or increase well productivity, it is presently more economic than drilling a new well among the most widely used restimulation techniques [20, 21].
Refracturing treatment consists of three steps: selection of refracturing candidates, optimization design of refracturing, and evaluation of refracturing effect. Candidate well identification is a key part of refracturing technology [20]. However, it involves a lot of parameters. It largely depends on reservoir quality, well completion, formation pressure, well productivity, cumulative oil and gas production, in-situ stress reorietation, wellbore quality and initial fracture conductivity, making the section of refracturing candidates very difficult [22-24]. How to comprehensively consider these parameters and identify the key factors is the primary challenge of the candidate well identification.
There have been a lot of researches on selection of refracturing candidates including production statistics, typical curve, article neural network and reservoir numerical simulation [25-29]. Production statistics are based on field data. Reservoir engineers analyze production dynamic data based on experience, evaluate well completion efficiency and predict the fracturing effect. Some scholars developed the algorithm for refracturing candidates from production statistics using the dimensionless quantities, such as well completion efficiency index, formation pressure index, and reservoir quality [26]. In recent years, artificial neural network method has been widely used in the selection of refracturing candidates [29]. By selecting a large number of existing refracturing wells, database and evaluation criteria were established. However, this method requires a large number of refracturing well data and the establishment of evaluation criteria for the optimal refracturing wells. Reservoir numerical simulation is used to analyze reservoirs energy, material basis and in-situ stress field distribution of candidate wells [29]. Each of the above methods has advantages and disadvantages, but few studies have combined these methods for selection of refracturing candidates.
Analytic hierarchy proess (AHP) and grey correlation analysis (GRA) have obvious advantages in dealing with complex relationships among different influence factors [30-33], and are widely used in evaluation of well productivity, reservoir quality evaluation and hydraulic fracturing effect and selection of fracturing well [34, 35]. AHP is appied to clarify the primary and secondary relations among different parameters. The GRA is used to calculate the weighting factors to determine the main control factors. As a statistical technique, fuzzy clustering has gained attention due to its ability to cope with uncertainty. The fuzzy theory was applied in studying rock face, fractures, water saturation estimation and prediction of porosity and permeability of sandstones [36, 37].
There is no example in literatures, where fuzzy clustering combines data analysis techniques for the purpose of selecting candidate wells for refracturing. In this paper, we firstly present a workflow for refracturing candidate selection. Then, data analysis techniques and fuzzy clustering are described. Finally, the hybrid method is tested in a tight oilfield and some conclusions are presented for refracturing candidate selection.
2 Construction of hybrid method
The novel hybrid approach provides significant insight to the refracturing candidate selection workflow which consists of four steps: 1) Collecting the special multi-fractured horizontal wells (MFHWs) parameters which contain reservoir data, production performance data and completion efficiency data from the well site and determining the individual strategic factors by using AHP; 2) GRA is used to determine the key factors which have significant impact on oil productivity in particular oilfield and the comprehensive evaluation factor (CEF) was calculated for classification of reservoir quality; 3) Based on the primary parameters, the idealized refracturing well is established and the potential of the candidate well for refracturing are ranked in order of their classification priority by using fuzzy clustering; 4) Reservoirs numerical simulation (RNS) was used to further evaluate production performance of the optimum refracturing wells. The result is illustrated in Figure 1.
2.1 Analytic hierarchy process component
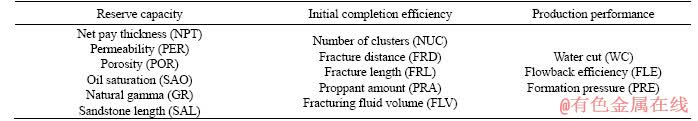
AHP is widely used to cope with complex relationships between a large number of uncertain parameters. Based on the field data and the multi-parameter evaluation system, the factors which influence the refracturing potential are divided into three sections according to the secondary evaluation index system: reserve capacity, initial completion efficiency, and production performance. The sub criterion contains several factors. The arrangement is shown in Table 1.
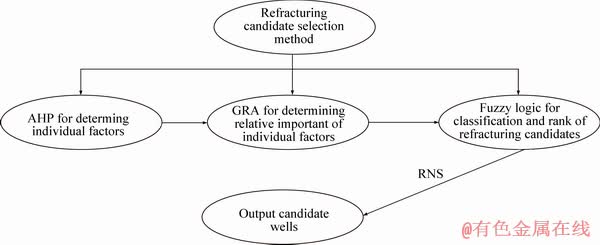
Figure 1 Workflow of refracturing candidate selection
2.2 Grey relation analysis component
2.2.1 Establishment of evaluation matrix
Based on the field data, evaluation matrix is firstly established in the grey theory system. The evaluation matrix contains a large amount of reservoir quality parameters and initial completion parameters. The reference series is made up of the initial cumulative production of each well in the first year after hydraulic fracturing. The expressions are as follows:
 ,
,
i=1, 2, ��, m; j=1, 2, ��, n (1)
 ,
,
i=1, 2, ��, m (2)
where X is the evaluation matrix; X0 is the reference sequence; m is the number of candidate wells; n is the number of appraisal criteria for each candidate well.
2.2.2 Calculation of weight coefficient
Weight coefficient is calculated by using Eqs. (1)-(5). The bigger value, the more important appraisal factor will be.
 (3)
(3)
 (4)
(4)
 (5)
(5)
where ��i(j) is the grey relational coefficients; rj is the grey relational grade; ��i(j) is the deviation sequence between the reference sequence; aj is the weight coefficient; �� is the identification coefficient.
2.2.3 Calculation of comprehensive evaluation factor
Comprehensive evaluation factor (CEF-Q) was defined to evaluate tight oil reservoir quality, the higher the value is obtained from Eq. (6), the better the reservoir quality will be. On this basis, inflection point method was applied to determining classification thresholds of reservoir quality.
 (6)
(6)
where Q is the comprehensive evaluation factor;  is the normalized evaluation value; h is the number of reservoir quality parameters.
2.3 Fuzzy clustering component
As a typical decision-making problem involving several factors, the choice of most proper refracturing wells is generally accomplished through the comprehensive evaluation of all the factors that are involved. The effective method is clustering. It helps better storage the data from different candidate wells by clustering them into small groups.
Table 1 Criteria considered in evaluating refracturing potential
In this paper, based on the correlation analysis of the appraisal factors and production, the idealized refracturing well was established as the objective function. The degree of similarity between candidate wells and idealized refracturing well was evaluated by calculating the averaging distances, namely Euclidean distance. The higher the degree of similarity, the more the refracturing potential. By the order of similarity, the classification threshold of candidate wells was determined and the most appropriates candidate wells can be selected. It works in 3 steps: idealized refracturing well parameters determination; fuzzy matrices establishment and data pre-processing; similarity computation and candidate wells classification. Each step is detailed as below.
2.3.1 Establishment of idealized refracturing well
In order to reflect the combined effects of all key factors and obtain comprehensive results, the idealized refracturing well which has the biggest refracturing potential and the biggest production after refracturing is established in the section considering two aspects: reservoir quality and initial fracturing effect. The parameters of idealized refracturing as well as the objective function are made up of the reserve capacity, initial completion efficiency and production performance.
 (7)
(7)
where k is the number of parameters for idealized refracturing well.
According to the distribution region of candidate wells parameter, the parameters values of idealized refracturing well are determined. In order to obtain the better production post refracturing treatment, NPT, SAL, POR, PRE, SAO, PER, FLE, FRD take the maximum and GR, WC take the minimum by correlating with initial cumulative production, which means a better reservoir quality. Fracturing parameters NUC, FRL, PRA, FLV take the minimum by correlating with initial cumulative production, which means that completion efficiency was poor.
2.3.2 Establishment of fuzzy matrix
In order to use fuzzy clustering, the first step is to generate a comparative series, which contain reservoir parameters, initial completion parameters and production performance parameters. The appraisal factors can be represented by yij, and the matrix Y is made up of the comparative series comprising l candidate wells with k appraisal factors.

j=1, 2, ��, l (8)
where k is the number of appraisal factor for each candidate well; l is the number of candidate wells.
2.3.3 Fuzzy matrix standardization
For better comparability between candidate wells and idealized refracturing well, it needs to normalize the comparative series by using Z Scores [38]. The first step is to calculate mean and standard deviation of the column vector by Eqs. (9) and (10).
 (9)
(9)
 (10)
(10)
Then we can obtain a normalized vector and standardized data can be represented by  which are the parameters of candidate wells.

j=1, 2, ��, l (11)
2.3.4 Calculation of Euclidean distance and similarity coefficient
Euclidean distance is defined as an average distance of candidate well to idealized refracturing well based on the standardized data and is calculated by Eq. (12).
 (12)
(12)
Similarity coefficient is calculated by using Eq. (13). The bigger the value, the higher the degree of similarity between the candidate wells and idealized refracturing well. Then sort them in the descending order according to its degree of similarity. The classification threshold can be determined by the ordering of the similarity coefficient.
 (13)
(13)
2.4 Reservoir numerical simulation component
The candidate wells productivity numerical model was established by using the ECLIPSE simulator. The actual fracture parameters were imported to the model using the grid refinement method. The remaining oil saturation distribution and present reservoir pressure distribution were obtained through history matching in order to further evaluate wells refracturing potential.
3 Results and discussion
The hybrid method was applied to refracturing candidate selection in tight oil reservoirs in China. At present, the average daily oil production of some wells in the field has decreased from 28.3 to 2.5 t/d. The field data from 15 MFHWs which contain reservoirs capacity parameters, initial completion efficiency parameters, and production performance were collected to test our method.
3.1 Field data analysis
In order to make effective decision, there is a need to analyze all involved factors closely and holistically. The correlation coefficients were calculated to analyze relationship between each of the appraisal factors and initial cumulative production (ICP). In order to better understand the relationship between appraisal factors and MFHWs production, industrial databases of 30 wells were collected from the actual field. The reserve capacity, initial completion efficiency, and production performance parameters of cross plotting are shown in Figures 2(a) and (b). It can be seen from the figure that each parameter has a low correlation with initial cumulative production. Some parameters are positively correlated with ICP, and some parameters are negatively correlated with ICP. It indicates that the selection of refracturing candidates needs to consider the comprehensive effects of these factors at the same time.
Table 2 Descriptive statistics of wells P1 to P15
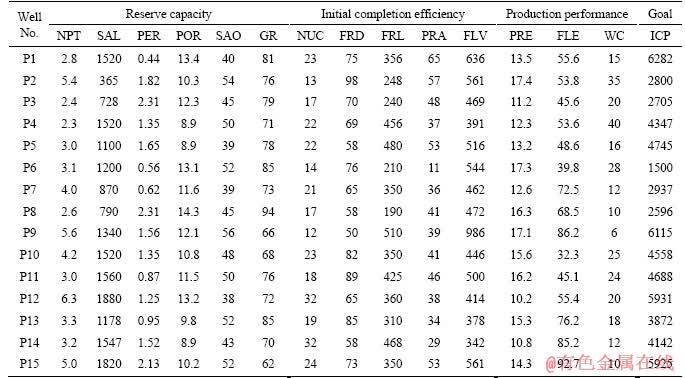
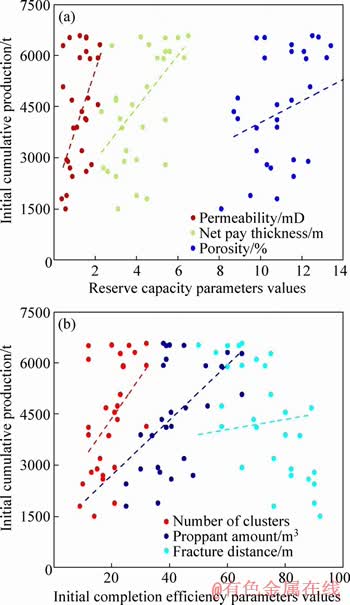
Figure 2 Correlation of reserve capacity parameters and ICP (a) and initial completion efficiency parameters and ICP (b)
3.2 Evaluation of refracturing potential
3.2.1 Evaluation of reservoir quality
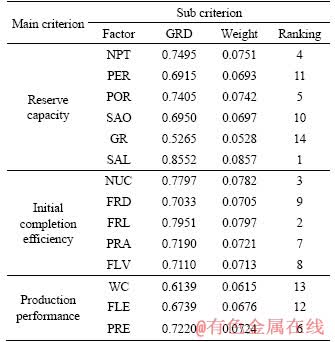
Based on the field data of candidate wells and grey theory, each parameter of grey relational grade and weight coefficient were calculated by using Eqs. (1)-(5), and the results were shown in the third and fourth column of Table 3. The weight coefficient of sandstone length is the highest (0.0857), followed by fracturing fracture length and number of clusters. It indicates that reservoir quality and initial fracturing volume are the key factors for selection of refracturing candidate.
Table 3 Weight coefficient of appraisal factor
We used Eq. (6) to calculate CEF-Q, with the results as shown in Table 4. In our study, CEF-Q of well P15 is the highest (0.342), followed by well P12, P9, P10, P14, P4, P11, P8, P2, P3, P6, P1, P13, P5 and P7. It indicates that well P15 has the most production potential. On the basis, inflection point method was applied to determining thresholds of reservoir quality classification. In this study, the classification thresholds are 0.25 and 0.30, and the reservoir quality was divided into three grades. The order of production potential is grade I (0.30- 0.35)>grade II(0.25-0.30)>grade III (0.20-0.25). For the same grade and the same reservoir quality, wells P9, P10, P12, and P15 belong to the first grade 1; wells P2, P3, P4, P8, P11 and P14 belong to the second grade 2; wells P1, P5, P6, P7, and P13 belong to the third grade 3. The results are shown in Figure 3.
3.2.2 Optimization of refracturing wells
In order to obtain comprehensive evaluation results, the idealized refracturing well, which has the most refracturing potential, was established with comprehensively considering the key appraisal factors. Each parameter value of the idealized refracturing well was determined by the appraisal parameters distribution region of all candidate wells and the relationship between each of the appraisal factors and ICP. The results are shown in Table 4.
Based on the data of Tables 2 and 5, Euclidean distances between candidate wells and idealized refracturing well were calculated by using Eqs. (8)�C(12), and the results are shown in Table 4. Refracturing candidates were divided into three grades by comparing the Euclidean distance with each well. The order of refracturing potential is grade I>grade II>grade III, and the same grade has the same refracturing potential. Candidate wells P10, P6, P13, P15, P11 belong to the grade I; P8, P9, P3, P2, P7, P4, P12 belong to the grade II; P1, P14, P5 belong to the grade III, and the classification results were shown in Figure 4.
Table 4 Calculation of Euclidean distance and similarity coefficient
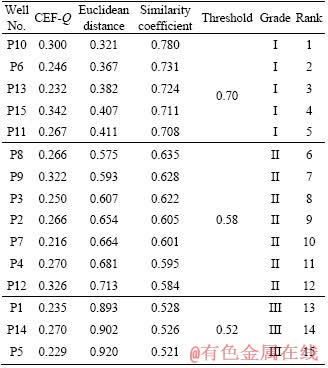
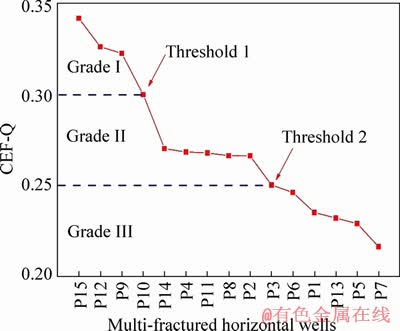
Figure 3 Classification of reservoir quality for MHFWs
Based on the Euclidean distance for each candidate wells shown in Table 4, similarity coefficient was calculated by using Eq. (13). In this example, similarity coefficient of candidate well P10 is the highest, followed by well P6, P13, P15,P11, P8, P9, P3, P2, P7, P4, P12, P1, P14, P5. It indicates that candidate well P10 has the most refracturing potential. Other candidate wells were ranked in the descending order according to its degree of similarity. Similarly, inflection point method was applied to determining classification thresholds of refracturing potential. In this study, the classification thresholds are 0.70, 0.58, 0.52, and the order of production potential was SI (0.70-0.80)>SII (0.58-0.70)>SIII (0.52-0.58). The results are shown in Table 4 and in Figure 5.
Table 5 Parameter value for idealized refracturing well
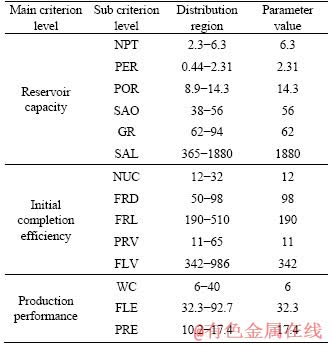
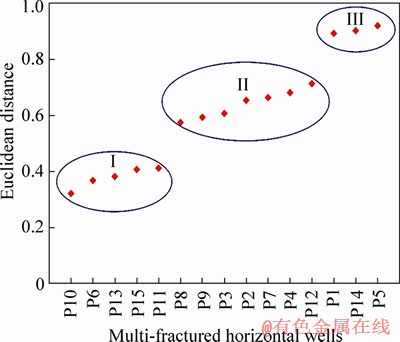
Figure 4 Classification of refracturing candidates in actual field
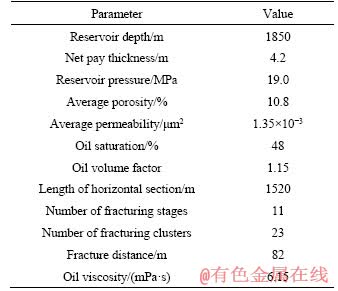
Based on the results of refracturing candidate selection by using quadrant analysis, a numerical model for the candidate well P10 was established by using the ECLIPSE simulator to further evaluate the remaining oil and formation pressure for refracturing treatment. The basic reservoirs parameters and initial completion parameters of the model were shown in Table 6.
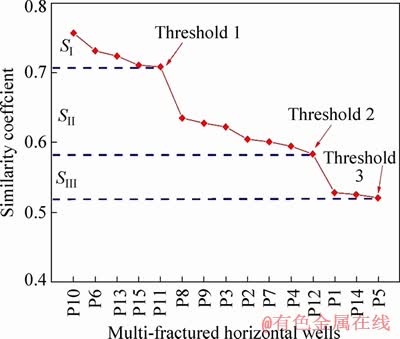
Figure 5 Classification threshold of refracturing potential
Table 6 Basic parameter sets for simulation model
Based on the establishment of numerical model, history matching was used to perform the cumulative liquid production, cumulative oil production, cumulative water production, daily oil production, daily water production and formation pressure. The remaining oil saturation distribution and present reservoir pressure distribution are obtained through history matching with the results shown in Figures 6(a) and (b). The results show that the staged recovery efficiency is only 3.5% and the current average reservoir pressure is 15.6 MPa and the reservoirs pressure retaining degree is 82.1%,which indicates that the candidate well has sufficient energy basis for refracturing treatment.
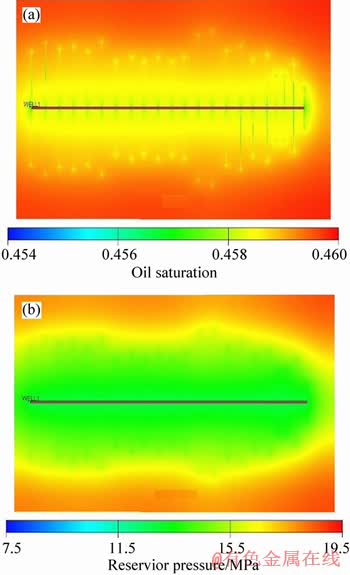
Figure 6 Distribution of remaining oil saturation (a) and reservoir pressure (b)
3.3 Hybrid method validation and discussion
In order to verify the approach and the results of refracturing candidate selection, the correlation between reservoir quality and initial cumulative production was analyzed with the results shown in Figure 7. It is found that well production and reservoir quality are positively correlated: the better the reservoir quality, the higher the well production. The correlation between ICP and CEF-Q was also used to evaluate the initial completion efficiency. For example, the well P6 (CEF-Q=0.246) and P1 CEF-Q=0.235) belong to the grade I and the reservoir quality of well P6 is better than P1. But the ICP of well P1 (ICP=6282 t) had higher ICP than P6 (ICP=1500 t) post initial hydraulic fracturing, which indicates that P1 has better initial well completion efficiency than P6, because the productivity is determined by both the reservoir quality and initial well completion efficiency. Wells P5 and P13 can also get the same result.
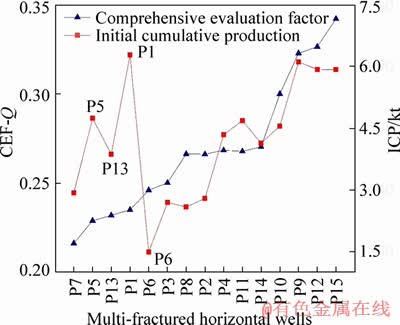
Figure 7 Correlation chart of ICP and CEF-Q
Importantly, wells P6 and P13 were selected for refracturing by using our hybrid method, they also belong to the grade I, and the correctness of the hybrid method was further verified.
Wells P10, P11, and P13 which belong to the grade I have been restimulated by refracturing treatment, and the average steady production was increased from 2.0 to 15.8 t/d post refracturing treatment. The results are shown in Figure 8, increasing significantly compared with previous status.
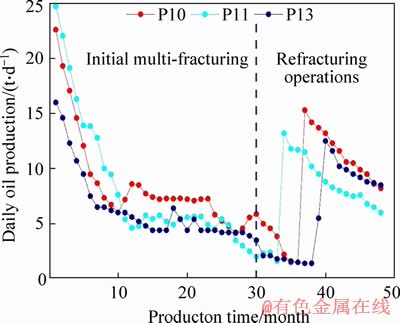
Figure 8 Average daily oil production of wells P10, P11, and P13 before and after refracturing
4 Conclusions
This paper provides a new hybrid approach to identify optimum refracturing candidates. Here are the conclusions are obtained from this work.
1) The idealized refracturing well considering both the reservoir capacity, initial well completion and production performance can be applied to evaluating the candidate well for refracturing comprehensively. The candidate well��s potential for refracturing was ranked in the descending order according to the similarity degree between candidate wells and idealized refracturing well.
2) The weight coefficient of sandstone length is the highest, followed by fracturing fracture length and number of clusters. The reservoir quality was divided into three levels, and the classification thresholds are 0.25 and 0.30. Reservoir numerical simulation method can be used to evaluate the geological reserves and energy basis for refracturing treatment.
3) The hybrid method was tested in tight oilfield based on data from 15 MFHWs. The average steady production was 15.8 t/d after refracturing treatment, increasing significantly compared with previous status. The research results can guide the development of tight oil reservoirs effectively.
References
[1] RUI Zhen-hua, CUI Ke-hang, WANG Xiao-qing, LU Jun. A quantitative framework for evaluating unconventional well development [J]. Journal of Petroleum Science & Engineering, 2018, 166: 900-905.
[2] GUO Ling, JIA Chao-chao, DU wei. Geochemistry of lower Silurian shale of Longmaxi Formation, southeastern Sichuan Basin, China: Implications for provenance and source weathering [J]. Journal of Central South University, 2016, 23(3): 669-676.
[3] JAVAHERI A, DEHGHANPOUR H, WOOD J M. Tight rock wettability and its relationship to other petrophysical properties: A montney case study [J]. Journal of Earth Science, 2017, 28(2): 381-390. (in Chinese)
[4] CHONG Zhao-hui, LI Xue-hua, CHEN Xiang-yu. Numerical investigation into the effect of natural fracture density on hydraulic fracture network propagation [J]. Energies, 2017, 10(7): 914-947.
[5] WANG Shen, LI Hua-min, LI Dong-yin. Numerical simulation of hydraulic fracture propagation in coal seams with discontinuous natural fracture networks [J]. Processes, 2018, 6(8): 113-138.
[6] BHATTACHARYAS S, NIKOLAOU M. Comprehensive optimization methodology for stimulation design of low-permeability unconventional gas reservoirs [J]. SPE Journal, 2016, 21: 947-964.
[7] LIU Jia, WANG Jian-guo, LEUNG Chun-cai, GAO Feng. A multi-parameter optimization model for the evaluation of shale gas recovery enhancement [J]. Energies, 2018, 11(3): 1-29.
[8] ZENG Jie, WANG Xiang-zeng, GUO Jian-chun, ZENG Fan-hua. Composite linear flow model for multi-fractured horizontal wells in tight sand reservoirs with threshold pressure gradient [J]. Journal of Petroleum Science & Engineering, 2018, 165: 890-912.
[9] DU Jin-hu, LIU He, MA De-sheng. Discussion on effective development techniques for continental tight oil in China [J]. Petroleum Exploration & Development, 2014, 41(2): 217-224.
[10] ZHAO Yu-long, ZHANG Lie-hui, ZHOU Yu-hui, LIU Qi-guo. Pressure response and production performance for multi-fractured horizontal wells with complex seepage mechanism in box-shaped shale gas reservoir [J]. Journal of Natural Gas Science & Engineering, 2016, 32: 66-80.
[11] TAO Liang, GUO Jian-chun, ZHOU Xiaofeng, ALENA K, ZENG Jie. A new productivity prediction hybrid model for multi-fractured horizontal wells in tight oil reservoirs [C]// SPE Russian Petroleum Technology Conference. Society of Petroleum Engineers, Moscow, Russia, 2018: SPE-191714.
[12] CHONG Zhao-hui, LI Xue-hua, CHEN Xiang-yu, ZHANG Ji. Numerical investigation into the effect of natural fracture density on hydraulic fracture network propagation [J]. Energies, 2017, 10(7): 914-947.
[13] GUO Jian-chun, WANG Jian-dong, LIU Yu-xuan, CHEN Zhang-xin. Analytical analysis of fracture conductivity for sparse distribution of proppant packs [J]. Journal of Geophysics & Engineering, 2017, 14(3): 599-610.
[14] FENG Qi-hong, XIA Tian, WANG-Sen, SINGH H. Pressure transient behavior of horizontal well with time-dependent fracture conductivity in tight oil reservoirs [J]. Geofluids, 2017, 12: 1-19.
[15] HOU Teng-fei, ZHANG Shi-chen, MA Xin-fang, SHAO Jun-jie. Experimental and theoretical study of fracture conductivity with heterogeneous proppant placement [J]. Journal of Natural Gas Science & Engineering, 2016, 37: 449-461.
[16] ZANFANEH B, CLARKSON C, HAWKES R. Reinterpretation of fracture closure dynamics during diagnostic fracture injection tests [C]// SPE Western Regional Meeting. Bakersfield, California, 2017: SPE- 185649-MS.
[17] HE You-wei, CHEN Shi-qing, QIN Jia-zheng, CHAI Zhi, WANG Ping. Analytical interference testing analysis of multi-segment horizontal well [J]. Journal of Petroleum Science & Engineering, 2018, 171: 919-927.
[18] GUO Jian-chun, TAO Liang, ZENG Fan-hui. Optimization of refracturing opportunity for horizontal well in tight oil reservoirs: A case study of cretaceous Qingshankou formation in the Songliao Basin, NE China [J]. Petroleum Exploration and Development, 2019, 46(1): 1-6.
[19] JACOBS T. Renewing mature shale wells through refracturing [J]. Journal of Petroleum Technology, 2014, 66(4): 52-60.
[20] SHAH M, SHAH S, SIRCAR A. A comprehensive overview on recent developments in refracturing technique for shale gas reservoirs [J]. Journal of Natural Gas Science & Engineering, 2017, 46: 350-364.
[21] FRENCH S, RODGERSON J, FEIK C. Re-fracturing horizontal shale wells: Case history of a Woodford shale pilot project [C]// SPE Hydraulic Fracturing Technology Conference. The Woodlands, Texas, USA, 2014: SPE- 168607-MS.
[22] GRIESER B, CALVIN J, DULIN J. Lessons learned: refracs from 1980 to present [C]// SPE Hydraulic Fracturing Technology Conference. The Woodlands, Texas, USA, 2016: SPE-179152.
[23] LINDSAY G, WHITE D, MILLER G. Understanding the applicability and economic viability of refracturing horizontal wells in unconventional plays [C]// SPE Hydraulic Fracturing Technology Conference. The Woodlands, Texas, USA, 2016: SPE-179113.
[24] VINCENT M��Refracs: Why do they work, and why do they fail in 100 published field studies? [C]// SPE Annual Technical Conference and Exhibition. Florence, Italy, 2010, SPE-134330.
[25] UDEGBE E, MORGAN E, SRINIVASAN S. From face detection to fractured reservoir characterization: Big data analytics for restimulation candidate selection [C]// SPE Annual Technical Conference and Exhibition. San Antonio, Texas, USA, 2017: SPE-187328-MS.
[26] ROUSSEL N P, SHAEMA M M. Selecting candidate wells for refracturing using production data [J]. SPE Production & Operations, 2013, 28(1): 36-45.
[27] REEVES S R, BASRIAN P A, SPIVEY J P. Benchmarking of restimulation candidate selection techniques in layered, tight gas sand formations using reservoir simulation [C]// SPE Annual Technical Conference and Exhibition. Dallas, Texas. 2000: SPE-63096-MS.
[28] WANG Yang-fang, SALEHI S. Refracture candidate selection using hybrid simulation with neural network and data analysis techniques [J]. Journal of Petroleum Science and Engineering, 2014, 123: 138-146.
[29] TAVASSOLI S, WEI Y, JAVADPOUR F, SEPEHRNOORI K. Selection of candidate horizontal wells and determination of the optimal time of refracturing in Barnett Shale [C]// SPE Unconventional Resources Conference. Alberta, Canada, 2013: SPE-167137.
[30] ISHIZAKA A, LABIB A. Review of the main developments in the analytic hierarchy process [J]. Expert Systems with Applications, 2011, 38(11): 14336-14345.
[31] ZENG Fan-hui, CHENG Xiao-zhao, GUO Jian-chun, TAO Liang. Hybridising human judgment, AHP, grey theory, and fuzzy expert systems for candidate well selection in fractured reservoirs [J]. Energies, 2017, 10(4): 447-469.
[32] XIAO Yong, GUO Jian-chun, HE Song-gen. A Comparison study of utilizing optimization algorithms and fuzzy logic for candidate-well selection [C]// SPE/IATMI Asia Pacifc Oil & Gas Conference & Exhibition. Nusa Dua, Bali, Indonesia, 2015: SPE-187328-MS.
[33] DENG Jing-long. Control problems of grey systems [J]. Systems & Control Letters, 1982,1(5): 288-294.
[34] ASLAN N. Use of the grey analysis to determine optimal oil agglomeration with multiple performance characteristics [J]. Fuel, 2013, 109(7): 373-378.
[35] RUI Zhen-hua, LU Jun, ZHANG Zhi-en, GUO Rui. A quantitative oil and gas reservoir evaluation system for development [J]. Journal of Natural Gas Science & Engineering, 2017, 42: 31-39.
[36] FANG J H, CHEN H C. Fuzzy modelling and the prediction of porosity and permeability from the compositional and textural attributes of sandstone [J]. Journal of Petroleum Geology, 2010, 20(2): 185-204.
[37] MASOUDI P, AIFA T, MEMARIAN H, TOKHMECHI B. Uncertainty assessment of volumes of investigation to enhance the vertical resolution of well-logs [J]. Journal of Petroleum Science & Engineering, 2017, 154: 252-276.
[38] WEI M, SUNG A, CATHER M. Mining spatially abnormal data in spatial databases [C]// Canadian International Petroleum Conference. Calgary, Alberta, 2004: PETSOC- 2004-42.
(Edited by ZHENG Yu-tong)
���ĵ���
�������ݷ�����ģ�����������������ˮƽ���ظ�ѹ��ѡ����Ϸ���
ժҪ���ظ�ѹ��ѡ�����Ͳع���ʦ���ٵ�һ����Ҫ�Ĺ�����Ȼ����Ӱ���ظ�ѹ��ѡ���������ڶ࣬�ҹ�ϵ���ӣ��ڲ�ͬ�̶���Ӱ���ظ�ѹ��Ч����ʹ���ظ�ѹ��ѡ��ʮ�����ѡ����������һ���µĽ�����ݷ���������ģ��������ظ�ѹ�Ѿ���Ϸ��������ȣ��������ݷ����������㲻ͬӰ�����ص�Ȩ�����ӣ���ȷӰ��ѹ��Ч���Ĺؼ����ء���Σ�������µ������ظ�ѹ�Ѿ��������ģ����������ۺ�ѡ���ظ�ѹ��DZ����������Ͳ���ֵģ�ⷽ����һ�����������ظ�ѹ�Ѿ��ĵز����������ʻ������û�Ϸ����ɹ���Ӧ�����й������������ظ�ѹ��ѡ����ʵ���˺�ѡ���ظ�DZ���ȼ������������������ظ�ѹ�Ѻ�����Ч���������ߣ��ȶ��ղ�����15.8 t���о��ɹ������������ظ�Ч��������Ҫָ�����á�
�ؼ��ʣ����������أ������ظ�ѹ�Ѿ���ģ�����ࣻ�ظ�ѹ��DZ������Ϸ���
Foundation item: Projects(51204054, 51504203) supported by the National Natural Science Foundation of China; Project(2016ZX05023-001) supported by the National Science and Technology Major Project of China
Received date: 2018-09-25; Accepted date: 2019-09-14
Corresponding author: TAO Liang, PhD, Engineer; Tel: +86-17780615086; E-mail: taoliangyouxiang@163.com; ORCID: 0000-0001- 5709-0834

