Weldability evaluation and tensile strength estimation model for aluminum alloy lap joint welding using hybrid system with laser and scanner head
��Դ�ڿ����й���ɫ����ѧ��(Ӣ�İ�)2012���3��
�������ߣ�Dong-Yoon KIM Young-Whan PARK
����ҳ�룺596 - 604
Key words��laser welding; scanner remote welding; 5J32 aluminum alloy; regression model
Abstract: Aluminum welding using a hybrid system with a laser and scanner welding head was performed under various welding conditions to verify the feasibility of applying an aluminum alloy to a car body. The experimental material was 5J32 aluminum alloy, and the laser power, welding speed, and laser incidence angle were used as the control variables. The weld bead shape and the tensile shear strength were evaluated in order to understand the aluminum lap joint weld characteristics. Analysis of variance (ANOVA) was conducted to identify the effect of the process variables on the tensile shear strength. Tensile strength estimation models using three different regression models were also suggested. The input variables were the laser power, welding speed, and laser incidence angle, and the output was the tensile shear strength. Among the models, the second-order polynomial estimation model had the best estimation performance, and the average error rate of this model was 0.058.
Trans. Nonferrous Met. Soc. China 22(2012) s596-s604
Dong-Yoon KIM, Young-Whan PARK
Department of Mechanical Engineering, Pukyong National University, Busan 608-796, Korea
Received 21 May 2012; accepted 6 October 2012
Abstract: Aluminum welding using a hybrid system with a laser and scanner welding head was performed under various welding conditions to verify the feasibility of applying an aluminum alloy to a car body. The experimental material was 5J32 aluminum alloy, and the laser power, welding speed, and laser incidence angle were used as the control variables. The weld bead shape and the tensile shear strength were evaluated in order to understand the aluminum lap joint weld characteristics. Analysis of variance (ANOVA) was conducted to identify the effect of the process variables on the tensile shear strength. Tensile strength estimation models using three different regression models were also suggested. The input variables were the laser power, welding speed, and laser incidence angle, and the output was the tensile shear strength. Among the models, the second-order polynomial estimation model had the best estimation performance, and the average error rate of this model was 0.058.
Key words: laser welding; scanner remote welding; 5J32 aluminum alloy; regression model
1 Introduction
The environment has been polluted and energy resources have been exhausted because of the substantial increase in the need for automobiles over the last several decades. In light of this, some countries have set stricter regulations on automobile fuel efficiency and exhaust gas. Therefore, most car manufacturers have attempted to reduce the car mass. One method for making a lightweight vehicle is to use aluminum for parts of the car body. Aluminum is not only a good material to use for reducing the mass of a car by as much as 40% but also has superior specific strength, corrosion resistance, and thermal conductivity.
Following this trend, attempts are being made to use lightweight aluminum not only in automobiles but also in railway vehicles, aircraft, and vessels. Welding technology is necessary for the aluminum alloy used in the body assembly process. However, because aluminum has high thermal conductivity and a low melting point, it is very difficult to weld using arc welding. Therefore, welding using a high-density heat source is necessary and laser welding has attracted attention [1].
Many studies of aluminum laser welding are in progress, including investigations into industrial applications using CO2 lasers, Nd:YAG lasers, disk lasers, and fiber lasers [2]. The weld characteristics for aluminum using CO2 laser welding have been evaluated [3]. The remote scanner welding process is characterized by long focal lengths and a highly dynamic beam deflection by mirrors refracting the beam onto the workpiece [4,5]. Because of high welding speed and productivity, laser welding is being adopted in the automotive industry and replaced for spot and arc welding. Recently, strength evaluation using a CO2 laser remote welding system was conducted for SPRC440 [6]. A three-dimensional remote scanner welding system using a Nd:YAG laser has also been established [7,8]. Moreover, mathematical models derived from the experimental results can be used to determine the welding process parameters and to predict the tensile strength parameters accurately [9]. It has also been proven by several researchers that the efficient use of the statistical design of experimental techniques allows for the development of an empirical methodology in order to incorporate a scientific approach into the welding procedure [10,11]. In flux core arc welding, a method for optimizing the weld bead geometry was introduced [12]. In CO2 laser welding, the bead width and penetration depth have been modeled using multiple regression analysis and neural network algorithms [13].
In this study, aluminum laser welding using a hybrid system with a scanner head was performed. The weldability evaluation according to the welding process parameters was conducted in terms of the mechanical properties. The weldability evaluation used bead shape, cross sections, and tensile strength to express the mechanical properties. In order to estimate the tensile shear strength, three regression models were suggested in this work: a multiple linear regression model, a second- order polynomial regression model, and a multiple nonlinear regression model. The coefficient of determination and the average error rate were calculated to quantitatively evaluate the models.
2 Experimental
2.1 Laser welding system with scanner head
The photo and the principles of the laser welding system with the scanner head are shown in Fig. 1, in which the laser beam is focused at a point on the specimen plane bended by two mirrors. Operators are able to simultaneously weld points by using robots equipped with a scanner and a laser. The speed of the welding can be at least five times faster than conventional resistance spot welding.

Fig. 1 Photo of laser welding system with scanner (a) and schematic illustration of scanner head (b)
A disk laser with a maximum output of 4 kW and the remote scanner of the welding head were used in the experiment. The base metal was 5J32 with the thickness of 1.6 mm. The chemical composition of 5J32 is listed in Table 1. The welding groove was an overlap, as shown in Fig. 2. The overlap length was 40 mm, and the weld length was 80 mm.
2.2 Laser welding conditions
The experiment was conducted in accordance with the design of the experiment. There are many parameters that determine the welding quality in laser lap welding, such as the laser power, welding speed, shielding gas, focal point, depth of focus, and gap between the sheets. In this study, the radiation angle of the laser incidence angle, laser power, and welding speed were the parameters selected as the control variables.
Table 1 Chemical Composition of 5J32 aluminum alloy
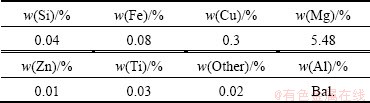

Fig. 2 Geometry of welding specimen (unit: mm)
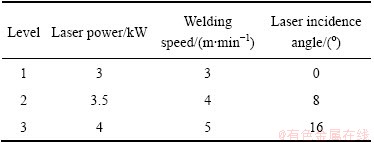
Each parameter had three levels. The laser power (LP) was 3 kW, 3.5 kW, and 4 kW; the welding speeds (WS) were 3 m/min, 4 m/min, and 5 m/min; and the laser incidence angles using the remote scanner were 0, 8, and 16. Therefore, there were 27 welding conditions. The conditions for the welding process are listed in Table 2. Welding was repeated three times for each experimental condition.
To investigate the weldability of aluminum laser welding, the weld bead shapes and their cross-sectional views were observed. Reinforcement, bead width, and penetration depth were also measured. To evaluate the strength of the weld, tensile shear tests were carried out.
Table 2 Laser weld experimental condition
3 Results
3.1 Bead shape and cross section
The weld bead shapes and their cross-sectional views were observed for each welding condition. Figure 3 shows the top and bottom bead surfaces under different welding conditions. The weld beads of aluminum laser welding can be classified into three different types, as shown in Fig. 3. Type I beads have smooth top and bottom beads because the heat input is sufficient to melt the base metal. In type II beads, the top bead is good while the bottom bead is irregular because the heat input is insufficient for melting the base metal. In type III beads, convex-shaped beads are sporadically formed on the top surface, while no bottom beads are produced because of insufficient heat input.
Cross-sectional images of the aluminum laser welds using the remote scanner are shown in Fig. 4 according to the welding conditions. In most cases, there are porosities in the welds, as shown in Fig. 4. The collapse of the keyhole due to instability is also one of the sources of large pores in the weld. In addition, because the boiling point of magnesium, which is the main element for 5000 series aluminum alloys, is lower than that of aluminum, it is easy to vaporize and to produce pores that are trapped during the solidification [14].
When the laser incidence angles are 8�� and 16��, the bead shapes leaned slightly rightward, as shown in Figs. 4 (b) and (c).
3.2 Weld bead geometry
In aluminum laser welding, the height and width of the beads were measured for the observation. Figure 5 shows the method for determining the bead shape. Figure 6 shows the depth of penetration, height of the top bead, and depth of the bottom bead. Figure 7 shows the width of the bead.
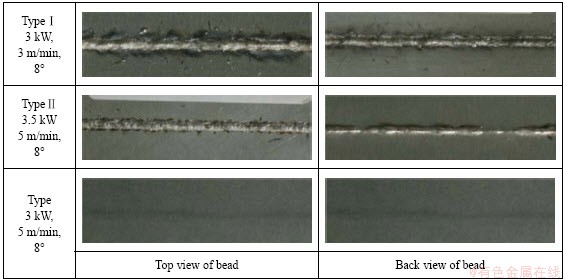
Fig. 3 Type of bead shape at different welding conditions
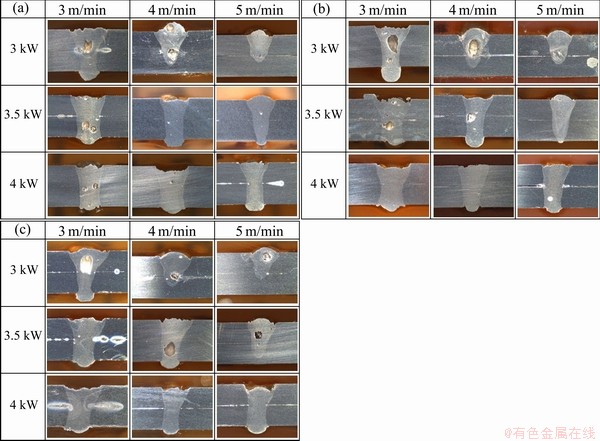
Fig. 4 Cross-sectional images of laser welding system using scanner with angle of 0�� (a), 80�� (b) and 16�� (c)
When the depth of penetration is greater than 3.2 mm, full penetration occurs and results in a concave bead shape, which is indicated by the negative value of the top bead height in Fig. 6(b). The value of the back bead width is positive for full penetration. In case of partial penetration, the depth of penetration is smaller than 3.2 mm and the reinforcement of the weld is formed on the top beads. In that case, bottom bead width was 0.
When the laser power is 4 kW, full penetration occurs and type I bead shapes (Fig. 3) are formed at all welding speeds. At 3.5 kW of laser power, full penetration occurs under four conditions, and in the case of 3 kW, full penetration occurs under two conditions.

Fig. 5 Measurement of bead height and width

Fig. 6 Bead height according to welding conditions

Fig. 7 Bead width according to welding conditions
In the case of Type II beads, the height of the beads is affected by the welding speed. As the welding speed decreases, the bead width increases and the penetration deepens because of the increased heat input.
The height of the top bead is positive, a convex bead shape is formed, and the depth of the bottom bead is 0 at a high welding speed and low laser power. In that case, the bead can be classified as Type III, as shown in Fig. 3. Because the keyhole does not achieve full penetration, the melting metal piles up on the top bead.
As the welding speed decreases and the laser power increases, the width of the bead increases. Distinctively, the width of the interface bead is more than 1.45 mm at full penetration. The width of the bottom bead increases as the interface bead increases.
3.3 Tensile shear strength
A tensile shear test was carried out to investigate the mechanical properties of the laser weld. The method of the tensile test followed the Korean standard KS B 0851 (Specimen dimensions and procedure for share testing the resistance spot and embossed projection welded joints). The test specimens were made as shown in Fig. 8 from the test coupon of Fig. 2.
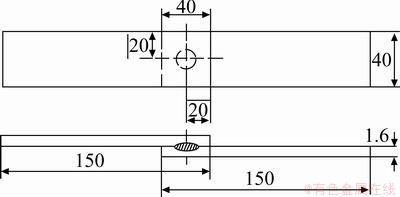
Fig. 8 Shape of test piece for tensile shear test (unit: mm)
In order to determine the allowable strength of the weld, the ISO Standard ISO14373 (Resistance welding-welding-Procedure for spot welding of uncoated and coated low carbon steels) was referred. The minimum weld tensile shear strength was defined as 7400 N, which is the minimum shear strength of spot welding for low carbon steels. Usually, laser welding is a substitute for resistant spot welding when manufacturing a car body; therefore, 7.4 kN is set as the standard in this research to determine good or poor welding quality.
The tensile shear strength is shown in Fig. 9. As the laser power increases and the welding speed decreases, the tensile strength increases because of sufficient input heat. At 4 kW of laser power, the allowable tensile strength is met regardless of the welding speed. Figure 10 shows the fracture types after the tensile test.

Fig. 9 Results of tensile shear test at different angles
Specimen fractured at the weld or the heat-affected zone (HAZ) and at the interface. If the tensile strength is greater than 90 kN, fracture occurs at the weld or HAZ, otherwise, fracture occurs at the interface of the two sheets.

Fig. 10 Fracture types after tensile test
3.4 Analysis of variance (ANOVA)
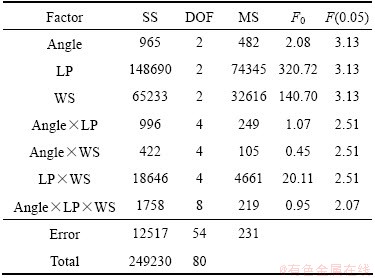
To evaluate the effect of each process parameter on the tensile shear strength, the analysis of variance (ANOVA) was carried out. ANOVA shows the sum of squares (SS) for experimental results and partitions the SS into various sources that are related to the experiment, such as control factors, error, and interactions among the factors. ANOVA finally determines the effects on the experimental results by comparing the mean square (MS) of error with the MS of factors including interactions. The results from ANOVA are summarized in Table 3, where, angle is the incidence angle; DOF is degree of freedom. For the ANOVA, ������ refers to the interaction. An interaction is the effect of combining levels of each factor. Each F0 is determined by dividing the MS of a factor by the MS of the error. A higher F0 indicates that the corresponding factor has a greater effect on the experimental results. The level of significance is shown by F(0.05), where 0.05 indicates 95% for the level of significance [15]. In other words, a factor that has an effect on the results is statistically verified with 95% significance.
Table 3 shows the results from the ANOVA for tensile strength. As shown in Table 3, F0 of the welding speed is higher than F(0.05), which indicates that the laser power and the welding speed significantly affected the tensile shear strength. There were interactions between the laser power and the welding speed, because the laser power was directly proportional to the heat input and the welding speed was inversely related to the heat input. However, the interactions between other factors had negligible effects.
Table 3 ANOVA for tensile strength about welding parameters
4 Tensile strength estimation model using regression analysis
4.1 Normalizing of process parameters
In order to suggest a model for estimating the tensile shear strength, the input variables was normalized. Normalizing refers to the division of multiple sets of data by a common variable in order to negate that variable��s effect on the data. Therefore, the weight of each input factor in order to maintain its influence on output uniformly should be standardized by each value of a input variables between 1 and 3. Input variables were normalized using equation (1).
 (1)
(1)
where xn is the normalized variable, x is the welding parameter value in the experimental range, and xmin and xmax are the minimum and maximum values of the experimental range.
4.2 Regression models
Regression models were configured using the normalized variables and the tensile shear strength from the results of the experiments. On the basis of the experimental results in section 3, a model for estimating the tensile shear strength was configured. Three regression models are suggested in this work: a multiple linear regression model, a second-order polynomial regression model, and a multiple nonlinear regression model.
The first model was a multiple linear regression model. Equation (2) is the proposed equation for the first model. The second regression model is a second-order polynomial regression model and is shown as equation (3). Finally, the multiple nonlinear regression model is shown as equation (4).
 (2)
(2)
 (3)
(3)
 (4)
(4)
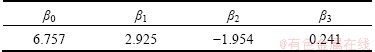
The laser power, welding speed, and laser incidence angle were used as the input variables, and the estimated tensile shear strength was the output ones. The inputs and output were expressed as x1, x2, x3, and  , respectively. In the equations, ��0 is the intercept of the y-axis and ��1�C��9 are the coefficients of each input variable. These values are obtained through the least mean square method. The values of each coefficient of the multiple linear regression model, second-order polynomial regression model, and multiple nonlinear regression model are listed in Tables 4, 5, and 6, respectively. The value of the coefficient can express the importance of an output factor, because each input variable is normalized.
For all the regression models, the values of the laser power and the welding speed are the most important variables. The laser power and incidence angle have a positive effect, and the welding speed has a negative effect because the heat input decreased as the welding speed increased. This is consistent with the results of the experiments.
Table 4 Coefficients for multiple linear regression model

Table 5 Coefficients for second-order polynomial regression model
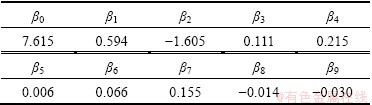
Table 6 Coefficients for multiple nonlinear regression model
4.3 Performance evaluations of each model
Figures 11, 12, and 13 show the estimation performance of each regression model, respectively. The x-axis of the figures is the real tensile shear strength and the y-axis is the estimated tensile shear strength. Appearing as a straight line, the regression data are an excellent prediction of the experimental data.

Fig. 11 Estimation results of multiple linear regression model
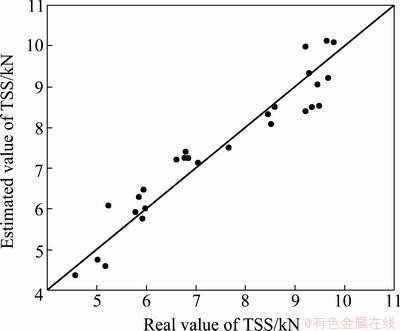
Fig. 12 Estimation results of second-order polynomial linear regression model
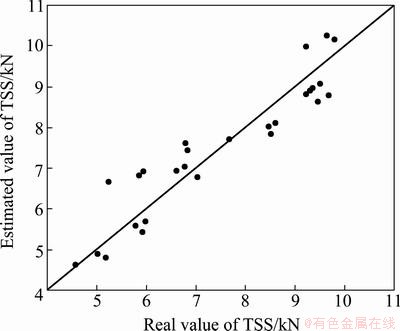
Fig. 13 Estimation results of multiple nonlinear regression model
Although the multiple nonlinear regression model is generally good for estimation performance, it is worse than the multiple linear regression model and the second-order polynomial regression model.
To evaluate the fitness of the regression models, the average error rate (AER), defined as equation (5), is calculated.
 (5)
(5)
where Rave is the average error rate; n is the number of experiments; i is the number of data; y is the value of the measured data, and is the estimated value of each model. As AER is close to 0, the estimation performances of the regression models are excellent. Therefore, the AER of each model was compared (Tables 7-9). As shown in Figs. 11�C13 and Table 7, among the three models, the estimation performance of the second-order polynomial regression model is the best.
Table 7 Average error rate for each model

5 Conclusions
1) Remote laser welding was conducted using the aluminum alloy 5J32, and a weldability evaluation was conducted according to process variables. The parameters were the laser power (3 kW, 3.5 kW, and 4 kW), welding speed (3 m/min, 4 m/min, and 5 m/min), and laser incidence angle (0��, 8��, and 16��).
2) Full penetration occurred when the laser power was high and the welding speed was low. The bead was leaned through incidence angle. To investigate the mechanical properties, tensile shear tests were performed. As the laser power increased and the welding speed decreased, the tensile strength increased. At a tensile strength greater than 9.0 kN, fracture occurred at the weld or HAZ. To evaluate the effect of each process parameter on the weld characteristics, ANOVA was conducted. As a result, the laser power had the greatest effect on the tensile strength. The welding speed also had an effect. There were also interactions between the laser power and the welding speed.
3) In order to estimate the tensile shear strength, three regression models were suggested: a multiple linear regression model, a second-order polynomial regression model, and a multiple nonlinear regression model. Each model was verified by calculating the average error rate, and each model had good predictive performance. Among the three models, the second-order polynomial regression model had the best estimation performance, with an average error rate of 0.058.
References
[1] GENE M. The welding of aluminum and its alloys [M]. Cambridge: Woodhead Publishing Ltd, 2002: 150.
[2] KATAYAMA S. Applications of laser in welding [C]//International Symposium on Combustion Engine and Marine Engineering. Busan, 2003: 17-23.
[3] KATAYAMA S, MATSUNAWA A. CO2 laser weldability of aluminum alloys (Report 4): Effect of welding defects on mechanical properties, deformation and fracture of laser welds [J]. Journal of Light Metal Welding & Construction, 1999, 37(3): 12-18.
[4] GOEBEL G, HAVRILLA D, WETZIG A, BEYER E. Laser welding with long focal length optics [C]//Conference on International Congress on Applications of laser & Electro-Optics. Dearborn, 2000: 28-37
[5] MACKEN J, Remote laser welding [C]//International Body Engineering Conference and Exposition. Detroit, 1996: 11-15.
[6] KLOZBATCH A, MORGENTHAL L, BEYER E. Laser welding on the fly with coupled axes systems [C]//Conference on International Congress on Applications of laser & Electro-Optics. Florida, 2001: 64-70.
[7] SUH J, LEE M Y, JUNG B H, SONG M J. Remote welding components using CO2 laser and scanner [J]. Journal of Korean welding and Joining Society, 2008, 26(5): 506-510.
[8] KANG H S, SUH J, LEE J H. Development of 3D Laser Welding System [C]//Spring conference on Korean Society for Precision Engineering. Kwangju, 2005: 932-935.
[9] KIM J S, KIM I S, NA H H, LEE J H. An Experimental study on prediction of back-bead geometry in pipeline using the GMA welding process [J]. Journal of Korean Society of Manufacturing Technology Engineers, 2001, 20(1):74-80.
[10] KIM I S, SON J S, KIM H H. A Study on real-time prediction of bead width on GMA welding [J]. Journal of Korean Welding and Joining Society, 2007, 26(6): 618-624
[11] ALLEN T T, RICHARDSON R W, TAGLIABUE D P, MAUL G P. Statistical process design for robotic GMA welding of sheet metal[J]. Welding Journal, 2002, 81(5): 69-76.
[12] MURUGAN N, PARMER R S. Stainless steel cladding deposited by automatic gad metal arc welding [J]. Welding Journal, 1997, 76(10): 391-402.
[13] PALANI P K, MURUGAN N, Optimization of weld bead geometry for stainless steel claddings deposited by FCAW [J]. Journal of Materials Processing Technology, 2007, 190(3): 291-299
[14] PARK H, RHEE S. Estimation of weld bead size in CO2 laser welding by using multiple regression and neural network [J]. Journal of Laser Applications, 1999, 11(3): 143-150.
[15] YOON J W. Laser welding of Aluminum alloys [J]. Journal of Korean Welding and Joining Society, 2000, 18(2): 147-153
[16] DOUGLAS C. Design and Analysis of Experiments [M]. 7th Ed. New York: Wiley, 2009: 362.
(Edited by ZHAO Jun)
Foundation item: Project (KRF-2010-0003259) supported by the Korea Research Foundation Grant funded by the Korean Government
Corresponding author: Young-Whan PARK; Tel: +82-51-6296148; E-mail: parkyw@pknu.ac.kr
DOI: 10.1016/S1003-6326(12)61771-3

