
Phase field model for strong anisotropy of kinetic and highly anisotropic interfacial energy
ZHANG Guo-wei(张国伟), HOU Hua(侯 华), CHENG Jun(程 军)
Department of Materials and Science Engineering, North University of China, Taiyuan 030051, China
Received 20 April 2006; accepted 30 June 2006
Abstract: A phase-field model was established for simulating pure materials, which was calculated effectively and taken into account the strong anisotropy of kinetic and highly anisotropic interfacial energy. The anisotropy (strong kinetic and highly interfacial energy) of various degrees was simulated with numerical calculation. During a variety of interfacial anisotropy coefficient, equilibrium crystal shape varies from smoothness to corner. There has a critical value during the course of the transformation. When the anisotropy coefficenct is lower than the critical value, the growth velocity v increases monotonically with the increase of it. Whereas the anisotropy coefficent is higher than the critical value, the growth velocity decreases with the increases of it. During a variety of degree of supercooling, the growth velocity is under control from thermal diffusion to kinetics. Under the control of thermal diffusion, the growth velocity increases with the increase of degree of supercooling and tip radius R decreases with the increase of temperature. Under the control of kinetics, with the increase of degree of supercooling both V and R, which can not fit the traditional microcosmic theory.
Key words: anisotropy; kinetics; interfacial energy; growth rate; supercooling degree
1 Introduction
Solidification of metal is not only influenced by macroscopical solidification conduction, but also subjected to microcosmic intrinsic characteristic. In the intrinsic characteristics, it is the most important to the anisotropy of solid-liquid interface. It is a very important parameter to influence the growth shape of crystals. The free dendrite must involve the interface anisotropy in order to form the stable dendrite tip shape; at the meantime the growth direction and the tip radius have relations between anisotropy.
The anisotropy of solid-liquid interface includes the interfacial energy anisotropy and interfacial kinetics anisotropy[1]. The interfacial energy anisotropy affects the choice of dendrite shape and stability of dendrite growth. When the interfacial energy anisotropy is weaker, the balance state of crystals is smooth, which makes the interface grow at all directions. As the reinforcement of anisotropy, the balance state of crystals presents distortion.
In the recent years, the phase-field model[2-7] has become a very important tool of simulating solidification structure evolvement. In the phase-field model, we considered the effect of anisotropy by angle function between interface normal and special direction with interface energy. The current phase-field model aims at non-facets with weakly anisotropy chiefly (anisotropic coefficient is smaller than 0.067). As to the research of facets crystal with strong anisotropy[8, 9], there have not reports much more. Until the latest, EGGLESTON et al[10] put forward the revised method of strong anisotropy. KARMA and RAPPEL’s[11] phase-field model have a great value of theory and application, and can be used to simulate dendrite growth.
2 Effect of interfacial anisotropy on equilibr-
ium shape
As to a complete description of dendrite growth simulation, the anisotropy of solid -liquid interface must be considered. In the research, the interfacial energy anisotropy and interfacial kinetics anisotropy will be introduced and processed(Fig.1). Forms are as follows:
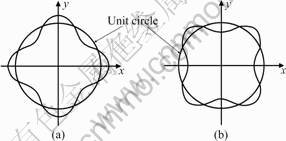
Fig .1 Overview of anisotropy
The interfacial energy anisotropy:
 (1)
(1)
The interfacial kinetics anisotropy:
 (2)
(2)
where  is the angle between interface normal and principal axis direction of dendrite, which is given by
  ; λ is the modulus of anisotropy, the value is common 4 or 6;
  is the exponential of anisotropy, which value is between 0.001 and 0.07, the greater the value, the larger the anisotropy strength, and the common value is 0.05-0.02.
Fig.2 shows that θ0 has influence on the anisotropy
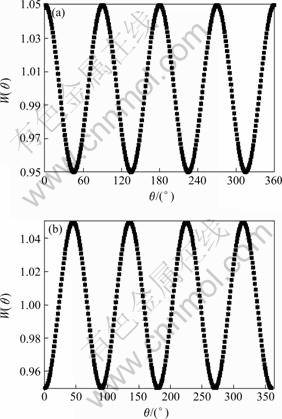
Fig.2 Relationship between W(θ) and θ: (a) θ0=0; (b) θ0=45?
of shape. As shown in Fig.3, the priority growth direction of crystals should be 45? and the slowest growth direction is 0? and 90?. According to the theory of crystallography, as to Al, Ni with fcc, their priority growth directions should be 0? and 90?. Why the priority growth direction in the interfacial energy model is different from in the theory of crystallography? KARMA and RAPPEL[11] introduced the phase-field equation of thin interface to explain the problem. KARMA et al [11] and KIM[12] recovered the following relationship between the capillary length d0, the kinetic coefficient β and the interfacial energy anisotropy W(θ):
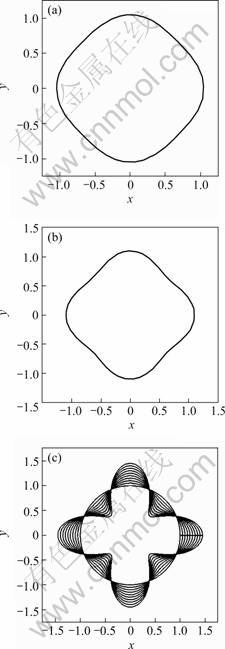
Fig.3 Shapes of W(θ) with different γ: (a) γ=0.05; (b) γ=0.1;(c) γ=0-0.5

 (4)
(4)
From Eqn.(3), the interfacial energy anisotropy has connection with  directly. The shape of
  with different γ is shown in Fig.4.
In the balance state, the equilibrium shape of crystals can be determined by the following formulas [2]:
 (5)
(5)
where A is a constant.
The equilibrium shape of crystals changes with the variety of γ as shown in Fig.5. Fig.5 shows that equilibrium shape of crystals is smooth when γ is smaller than 0.067. The effect of anisotropic interf- acial energy on equilibrium shape can be described by Gibbs-Thomson equation:
 (6)
(6)
where k is the interface curvature, f L and f S are liquid and solid free energy densities.
when γ<0.067, fL>fS, all directions of the interface
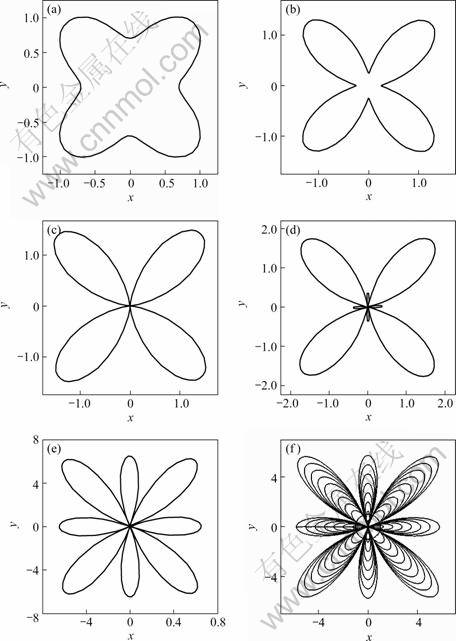
Fig.4 Shapes of  with different γ: (a) γ=0.02; (b) γ=0.05; (c) γ=0.066 7; (d) γ=0.09; (e) γ=0. 5; (f) γ=0-0.5
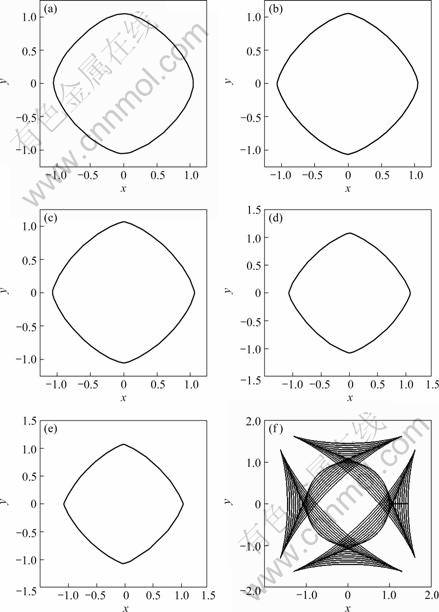
Fig.5 Equilibrium shapes of crystals with different γ: (a) γ=0.05; (b) γ=0.067 7; (c) γ=0.07; (d) γ=0.08; (e) γ=0.09; (f) γ=0-0.5
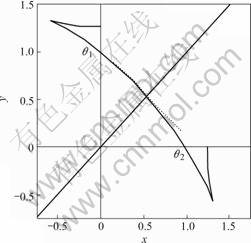
Fig. 6 Equilibrium shape of crystals with γ of 0.25
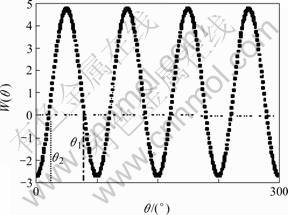
Fig.7 Relationship between interfacial energy anisotropy and θ (γ=0.25)
are stable, and the interface is smooth and continual. >θ1, both unstable and stable orientations are missing When γ>0.067, the value of fL>fS is minus in some directions, therefore the interface is no longer smooth, bringing on edges and corners. Some orientations with high energy will disappear from the equilibrium shape. As shown in Fig.6, each corner of the figure occurs ears. The orient- ations corresponding to a concave surface are unstable and the orientations corresponding to a convex surface are matastable. The orientation corresponding to edge in the first quadrant range from θ2=0.63? to θ1=0.940?, as shown in Fig.7. When |θ|<θ2 and π/2>|θ| in the equilibrium. In the range of the orientation θ2<|θ|<θ1, anisotropy can be treated using the standard form of angular dependence of gradient energy coefficient 
Besides, we need amend the gradient energy coefficient relying on angle without changing equilibr- ium shape. We adopted the method of Eggieston [2] to amend anisotropy:
 (7)
(7)
Fig.8 shows, when ||<2 and2>|>1, the interfacial energy is isotropy,  . All directions of the interface are stable.
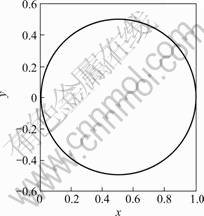
Fig. 8 Shape of W () =W(2)
3 Phase-field model
Based on the entropy function we established non- isothermal phase-field model, adopted the thin interfacial analysis presented by KARMA and RAPPEL[11], defined the variable of phase-field, φ=1 representing solid,φ=-1 representing liquid. Adopting nondimens- ional phase-field model is as

where u is the nondimensional temperature, u=(T-TM)/L/cp,  is the nondimensional time,
  ,
, is the nondimensional length,
 ,
,  is the nondimensional interfacial thickn- ess,
 ,
,  is the phase field mobility,
  ,
,  is the nondimensional interf- acial kinetics coefficient,
  , w is the reference length.
When  , the standard phase-field equations are available, in accord with the result of Karma and Rappaz’s thin interface asymptotic analysis,
  ; when
 , it needs modify, the phase-field model modified is as follows.
When θ2<|θ|<θ?, the phase equation refers to for- mula (8).
When |θ|<θ2, the interfacial energy is isotropic.

When π/2>|θ|>θ, the interfacial energy is isotr- opic.

4 Results and discussion
Figs.9 and 10 show v and R in the variation of undercooling and the parameters of simulating as listed in Table 1. Fig.10 shows that R decreases with increasing undercooling under the low undercooling, in accord with the theories of marginal stability and macro-solvability, and R2v is a constant. As shown in region 1, in this section, the growth is controlled by thermal diffusion chiefly; when the undercooling is bigger than 0.75, R
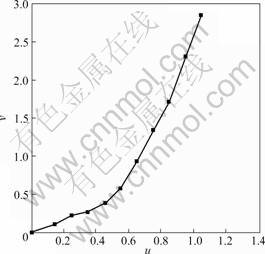
Fig.9 Relationship between dendrite tip velocity and undercooling u
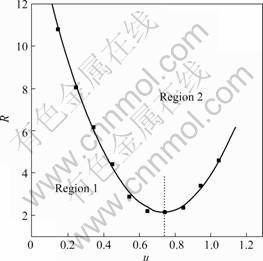
Fig.10 Relationship between tip radius and undercooling u
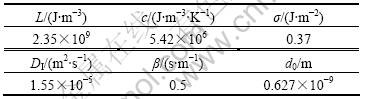
Table 1 Thermo-physical parameters of pure nickel
increases with degree of increasing supercooling. In region 2, the R2v=Cosntant law are no longer available. The growth is controlled by interface kinetics.
Fig.10 shows the dendrite shapes with different anisotropies. Derived from the figure, when the anisotr- opy parameter is smaller than the critical value 0.067, the interface is smooth; when the parameter is bigger than 0.067, the interfacial shape occur corners, and the growth becomes unstable. Fig.11 shows the effect of anisotropic coefficient on dendrite tip growth rate and tip radius.
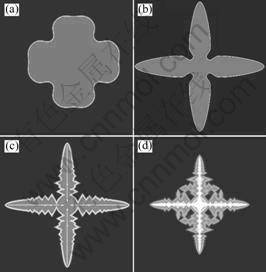
Fig.11 Influence of γ on dendrite morphology: (a) γ=0.02; (b) γ=0.05; (c) γ=0.067; (d) γ=0.15
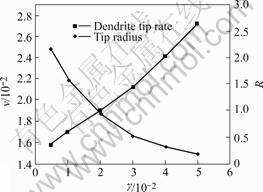
Fig.12 Influence of anisotropy parameter on dendrite tip growth
Derived from the figure, as anisotropic coefficient increases, the dendrite tips growth rate decreases in line and the radius decreases in parabola. When the anisotropy parmaeter is higher than the critical value, because the interfacial shapes occur corners and the growth is unstable, the dendrite top growth rate decreases with increasing coefficients in all directions.
5 Conclusions
1) With a change of interfacial energy anisotropy coefficient, the equilibrium crystal shape in the phase- field varies from smoothness to corner.
2) In the variation of degree of supercooling , the growth rate transforms from thermal diffusion control to kinetics control. When controlled by thermal diffusion, the growth velocity increases with increasing degree of supercooling and the tip radius decreases with the degree of increasing supercooling; when controlled by interface kinetics, the growth velocity and the tip radius increase with degree of increasing supercooling. This is contr- adictory with the conventional theory of macro- solvability: R2v=Constant.
References
[1] KESSLER D, LEVINE H. Dendritic growth in a channel [J]. Phys Rev A,1986, 34: 4980-4987.
[2] YU Y M, YANG G C, ZHOU D W. Determination of interface width value in phase-field simulation of dendritic growth into undercooled melt [J]. Progress in Natural Science, 2002, 12(3): 103-108.
[3] NESTLER B, WHEELER A A, RATKE L. Phase field model for solidification of a monotectic alloy with convection [J]. Physica D, 1999, 140: 133-154.
[4] LEE S, SUZUKI T. Numerical simulation of isothermal dendritic growth by phase-field model [J]. ISIJ International, 1999, 39(3): 246-252.
[5] KIM S G, KIM W T, SUZUKI T. Interfacial compositions of solid and liquid in a phase-field model with finite interface thickness for isothermal solidification in binary alloys [J]. Phys Rev E, 1998, 58(3): 3316-3323.
[6] ANDERSON D M, MCFADDEN G B, WHEELER A A. A phase field model with convection: sharp-interface asymptotics [J]. Phys D, 2001, 151: 305-331.
[7] HOU Hua, JU Dong-ying. Numerical simulation for dendrite growth of binary alloy with phase field method [J]. Journal of Materials Science Technology, 2004, 20: 45-48.
[8] MULLIS A M. A study of kinetically limited dendrite growth at high undercooling using phase-field techniques [J]. Acta Materialia, 2003, 51: 1959-1969.
[9] UEHARA T, SEKERKA R F. Phase field simulations of faceted growth for strong anisotropy of kinetic coefficent[J]. Journal of Crystal Growth, 2003, 254: 251-261.
[10] EGGLESTON J J. A phase model for highly ansiotropic interfacial energy[J] . Physica D, 2001,150: 91-103.
[11] KARMA A, RAPPEL W J. Numerical simulation of three-dimensional dendritic growth[J]. Physical Review Lett, 1996, 77(10): 4050-4053.
[12] KIM S G. Phase field modeling of dendritic growth with high anisotropy [J] . Journal of Crystal Growth, 2004, 263: 620-626.
(Edited by LI Xiang-qun)
Foundation item: Project (200504) supported by the Microstructure Simulation of Aluminum Alloy under Solidification Process of North University , China
Corresponding author: ZHANG Guo-wei; Tel: +86-351-3922164; Fax: +86-351-3922012; E-mail: gwzhangas@sina.com.cn

