Trans. Nonferrous Met. Soc. China 22(2012) 2930-2936
Fatigue behavior and life prediction of A7N01 aluminium alloy welded joint
LIU Xue-song1, ZHANG Liang1, WANG Lin-sen1,2, WU Shuang-hui1, FANG Hong-yuan1
1. State Key Laboratory of Advanced Welding and Joining, Harbin Institute of Technology, Harbin 150001, China;
2. Welding Process Section, Dongfang Boiler Group Co., Ltd., Zigong 643001, China
Received 8 March 2012; accepted 27 July 2012
Abstract: Fatigue characteristics of A7N01 aluminium alloy welded joint were investigated and a fatigue crack initiation life-based model was proposed. The difference of fatigue crack initiation life among base metal, weld metal and heat affected zone (HAZ) is slight. Furthermore, the ratio of fatigue crack initiation life (Ni) to fatigue life to failure(Nf) is a material dependent parameter, 26.32%, 40.21% and 60.67% for base metal, HAZ and weld metal, respectively. Total fatigue life predicted using the presented model is in good agreement with the experimental data and that using Basquin��s model. The observation results of fatigue fracture surfaces, using scanning electron microscope (SEM), demonstrate that fatigue crack initiates from smooth surface due to welding process for weld metal, blowhole in HAZ causes fatigue crack initiation, and the crushed second phase particles play an important part in fatigue crack initiation in base metal.
Key words: aluminium alloy; A7N01 aluminum alloy; welded joint; crack initiation; fatigue; fatigue life; life prediction
1 Introduction
A7N01 aluminium alloy is widely used in storage tanks of space rockets, armor plates, military vehicles, road tankers and railway transport systems, because of its specific properties, such as high specific strength, low quench sensitivity, good hot workability and excellent corrosion resistance [1,2]. Most of these welded components in service are subjected to cyclic loading frequently. Hence, the fatigue characteristics of welded joints, which are important to the safety and reliability of these applications, have aroused wide attention and detailed studies. RAVINDRA et al [3] developed a empirical relationship to predict gas metal arc welded crucifrom joints of AA7075 aluminium alloy. BALASUBRAMANIAN et al [4] reported the influences of pulsed current welding and post weld aging treatment on fatigue crack growth behaviour of AA7075 aluminium alloy. LILJEDAHL et al [5] investigated the weld residual stress effects on fatigue crack growth behavior of 2024-T351 aluminium alloy fabricated by variable polarity plasma arc welding. However, few investigations have been carried out on fatigue crack initiation behaviors of Al-Zn-Mg alloy welded joint. In fact, fatigue crack initiation life occupies about 40%-50% of the total life for endurances between 105 and 106 cycles [6]. If the stage of fatigue crack initiation is overlooked, it is too late to avoid a disaster even if thorough investigations of the fatigue crack growth is carried out. Therefore, it is necessary to pay more attention to fatigue crack initiation.
In this work, U-shape notched specimens were adopted in fatigue test. Then fatigue life for crack initiation and total fatigue life of base metal, weld metal and HAZ of A7N01 aluminium alloy welded joint were obtained. The characteristics of fatigue crack initiation for different regions were analyzed. Meanwhile, a fatigue crack initiation life based model was developed to evaluate the total fatigue life. Further, the mechanism of fatigue crack initiation in each region was clarified.
2 Experimental
The manual gas tungsten arc welding (GTAW) of rolled A7N01 aluminium alloy was carried out using filler material ER5356 with a diameter of 1.6 mm. The chemical compositions of the base metal and the filler wire are given in Table 1. Prior to welding, the plates of 6 mm in thickness were cut into required dimensions (250 mm��300 mm) and thoroughly cleaned to remove any dirt or grease adhering to the surface. The other welding conditions are summarized in Table 2. During the welding operation, necessary care was taken to avoid joint distortion and parallel misalignment.
Table 1 Chemical compositions of A7N01 alloy and wires ER5356 (mass fraction, %)

Table 2 Manual-GTAW welding parameters

Metallographic specimens were cut across vertical transverse cross-section of the weld metal, and ground with emery paper of 240, 500, 800 grid, followed by fine polishing with diamond suspensions of 1 ��m; finally, etched with Keller��s reagent (HF 1 mL, HCl 1.5 mL, HNO3 2.5 mL and H2O 95 mL). The microstructures were characterized using an optical microscope and energy dispersive X-ray spectroscopy (EDS). After the fatigue specimen broken, fatigue fractography and crack initiation sites were observed using a HITACHI S-3400 scanning electron microscope (SEM).
In order to evaluate the strength reduction near the weld metal, microhardness test was performed on the transverse section of the joint at various distances from the weld centre.
Aiming to investigate the fatigue behaviors of each region, notched fatigue test specimens were prepared. Weld reinforcements were removed mechanically, meanwhile, a single U-shape notch was introduced in base metal, HAZ and weld metal, respectively. Further, the corresponding stress concentration factor was calculated according to the approach presented in Ref. [7], that is 3.49. Details of fatigue specimen are illustrated in Fig. 1.

Fig. 1 Geometry of fatigue specimen (Unit: mm)
Constant amplitude fatigue tests with R=0 were conducted using an electromagnetic resonance fatigue testing machine in air at room temperature. The samples were loaded in the form of sinusoidal waveform at a resonant frequency of about 82 Hz, and at each stress level three samples were tested until failure, which was defined as 5 Hz resonant frequency drop. Normally�� the drop was almost followed by complete rupture of materials.
In this study, the size of fatigue crack initiation was defined as 1 mm [8]. A travelling microscope with an accuracy of 0.01 mm was used to monitor the length of crack length every 20000 cycles. In order to reduce measurement error caused by surface roughness, the specimens were polished mechanically, and then electropolishing was made near the notch.
3 Results and discussion
3.1 Microstructures and microhardness
Microstructures of base metal, weld metal and HAZ of A7N01 aluminium alloy welded joints are displayed in Figs. 2(a), (b) and (c), respectively. Elongated matrix grain morphology parallel to the rolling direction in base metal can be observed in Fig. 2(a). Zn and Mg are the major alloyed elements and the phase ��(MgZn2) is the main strengthening precipitates of A7N01 aluminium alloy [9]. Meanwhile, quite a lot of coarse particles, which are enriched in Cr, Mn and Fe measured by EDS, can be found in base metal. It is believed that incomplete dissolution during the rolling process gives rise to the existence of coarse particles. Wire ER5356, which is Al-Mg alloy, was adopted to reduce welding hot cracking susceptibility, thereby ��(Al3Mg2) phases are obtained at room temperature, as shown in Fig. 2(b). In this micrograph fine solidification structure can be observed throughout the weld metal. However, being subjected to weld thermal cycle, fibrous structure formed during the rolling process transformed into recrystallized and incomplete recrystallized structures in HAZ, as seen in Fig. 2(c).
Figure 2(d) illustrates the evolution of microhardness in the cross section of the joint. The microhardness test results demonstrate that the difference of hardness among weld metal, HAZ and base metal is significant. Furthermore, the average microhardnesses of weld metal and base metal are HV72.4 and HV108.7, respectively. Lower hardness is caused by less alloy element in welding wires ER5356 which leads to the decrease of strengthening effect. In addition, because welding thermal cycle is different from HAZ, there are partially melted zone, quenched zone and overaging zone in HAZ. The microhardness increases with increasing distance from weld center. In overaging zone, the aggregation and growth of precipitation phases contributes to the decrease of hardness and formation of softened zone.

Fig. 2 Microstructures of base metal (a), weld metal (b), HAZ (c) and micro-hardness distribution (d)
3.2 Fatigue behavior
Fatigue life to failure (Nf) of base metal, weld metal and HAZ are displayed in Fig. 3. Obviously, remarkable difference of the lifetime among the three regions can be observed. The difference diminishes gradually with increasing the stress level.

Fig. 3 Fatigue test data of base metal, weld metal and HAZ for A7N01 aluminium alloy welded joint
Figure 4 shows the fatigue crack initiation life (Ni) of base metal, weld metal and HAZ. It can be seen that the difference of fatigue crack initiation life is slight at a higher stress level; however, the difference can be observed gradually with decreasing the stress amplitude. The fatigue crack initiation life of base metal is a little longer than that of weld metal. However, the fatigue crack initiation life of HAZ fluctuates due to inhomogeneous microstructure which results from welding thermal cycle. It is implied that slight diversity of microstructure around the notch tip gives rise to the difference of fatigue crack initiation lives. Overall, the variation of fatigue crack initiation life is not very obvious.

Fig. 4 Fatigue crack initiation life data of base metal, weld metal and HAZ
From Figs. 3 and 4, the ratios of fatigue crack initiation life to total fatigue life of different regions are obtained, as displayed in Fig. 5. As shown in Fig. 5, the ratios are stable, which are 26.32%, 40.21% and 60.67% for base metal, HAZ and weld metal, respectively. Furthermore, the ratio is independent on the stress amplitude, but dependent on the microstructure and mechanical properties. In summary, the stage of fatigue crack initiation plays an important role during the process of fatigue damage.

Fig. 5 Ratio of Ni/Nf for base metal, weld metal and HAZ for A7N01 aluminium alloy welded joint
3.3 New approach to predict fatigue life
Generally, the process of fatigue failure consists of two stages: fatigue crack initiation and fatigue crack growth. Fatigue life has been predicted successfully using fatigue crack growth rate based models [10-13]. However, the stage of crack initiation under cyclic loading covered a considerable proportion of total fatigue life. It is well known that long testing time is required to obtain total fatigue life. If total fatigue life can be predicted according to the characteristics of fatigue crack initiation, a large amount of time and energy will be saved. From the view mentioned above, a novel model is developed to predict the total fatigue life.
The fatigue life to failure can be written as
Nf=Ni+Np (1)
where Np is the fatigue crack propagation life.
The ratio of fatigue crack initiation to total fatigue life is defined as
��= Ni /Nf (2)
In present work, a continuum damage mechanic model for high cycle fatigue developed by LEMAITRE [14] was employed to predict fatigue crack initiation life:
 (3)
(3)
where ��0 and B0 are material and temperature dependent coefficients. Applied the model to one-dimensional case, the equivalent stress ��eq=|��|, the triaxiality function (Rv) is 1. For the case of present study, stress ratio is 0, then,
 (4)
(4)
where  , K and ��0 are evaluated from the S��Ni curve as shown in Fig. 4. Thus, fatigue initiation life of the three regions can be predicted using a uniform model:
 (5)
(5)
The fatigue test shows that the ratio �� of fatigue crack initiation life to total fatigue life is constant approximately for different regions (see Fig.5). Hence, it is reasonable to believe that the ratio �� is a material dependent parameter. Thus, the total fatigue life can be expressed as
 (6)
(6)
The experimental data, predicted results using the proposed model and Basquin��s model are shown in Fig. 6. It can be observed that the results of predicted total fatigue life using the proposed model and Basquin��s model are comparable. Therefore, it is reasonable to believe that the proposed model has a good ability of predicting the total fatigue life.

Fig. 6 Experimental and predicted fatigue life for different regions
3.4 Fatigue crack initiation sites
Figure 7 reveals a typical example of SEM micrograph of fracture surface near the crack initiation site for weld metal. SEM observations show that all cracks initiated on smooth surfaces for all tested specimens of weld metal. The fatigue crack initiated on the root of the notch due to the smooth surface on the fracture surface covered with thin films. And many crystallized particles can be observed in Fig. 7. It is reasonable to believe that the formation of smooth surface at a result of solidification cracking or eutectics existing at grain boundaries which generated during the welding solidification process. Consequently, the existence of smooth surfaces decreased the cohesion between grains and increased the tendency of crack even under low loading.

Fig. 7 SEM fractograph of fatigue crack initiation site of weld metal
As shown in Fig. 8, fatigue crack initiation occurred at a blowhole that was produced during the welding process in HAZ. The blowhole is located in the vicinity of the notch tip, and the diameter is about 90 ��m. Due to high heat temperatures, quickly heating and cooling in HAZ (exactly in fusion zone), blowhole is a common defect in aluminium alloy welding processing. Despite the fact that fatigue crack initiated at the blowhole, the blowhole hardly affected the fatigue crack initiation life, as shown in Fig. 3, compared with the case of weld metal and base metal.
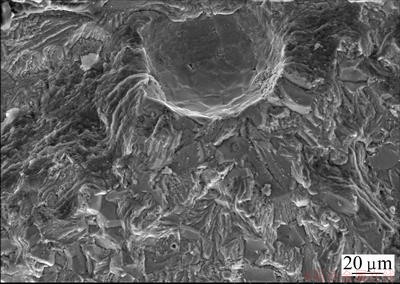
Fig. 8 SEM fractograph of fatigue crack initiation site of HAZ
The fracture morphology of base metal near the fatigue crack initiation site is shown in Fig. 9. It can be seen that fatigue crack initiated from a large second phase particles. Figure 10(a) shows the morphology of the second phase particle, the same as the one in Fig. 9 in terms of the chemical compositions. The corresponding energy dispersive X-ray spectroscopy (EDS) analysis (Fig. 10(b)) reveals that the second phase particles are enriched in Cr, Mn and Fe. Constituent particles, generally iron-bearing phases, have been identified as the most likely site of crack initiation in 7000 series alloy [15]. And the existence of the large particle is incomplete dissolution in the process of rolling. As shown in Fig.10(a), microcracks in the second phase particles can be observed in the base metal. Hence, it is reasonable to infer that the particles were crushed during the rolling process. Furthermore, since the loading direction was parallel to the rolling direction and perpendicular to microcrack, propagation of the microcrack was induced to the matrix by stress concentration produced at interface between the particle and matrix. Accordingly, the crack initiated at the coarse particle under cyclic loading.

Fig. 9 SEM fractograph of fatigue crack initiation site of base metal

Fig. 10 Morphology of second phase particle in base metal (a) and EDS spectrum of small area analysis in particle (b)
Although the fatigue crack initiation mechanisms for base metal, weld metal and HAZ are different, the distinctions of fatigue crack initiation life among the three regions are insignificant, as shown in Fig. 4. Hence, it is reasonable to attribute the difference of total fatigue life among the three regions to the diversity of fatigue crack growth life.
Generally, the fatigue crack growth life depends on the fatigue crack growth rate. OULD CHIKH et al [16] proposed a model to evaluate fatigue crack growth rate:
 (7)
(7)
where rc is the plastic zone size, and A is the correction factor of the plastic zone.
IRWIN [17] believed that plastic zone size depends on the yield strength of material:
 (8)
(8)
where k is the stress intensity factor, and ��s is the yield strength. It is noticed that the higher the yield strength, the smaller the plastic zone size.
Experimental results revealed that the yield strength can be determined by hardness test. Then, the fatigue crack growth rate of base metal, weld metal and HAZ can be predicted by the hardness testing results shown in Fig. 2. Consequently, a higher hardness leads to a smaller plastic zone size, and results in a longer total fatigue life. Accordingly, base metal with a higher hardness has a longer fatigue life. The weld metal has the lowest hardness and the shortest fatigue life.
4 Conclusions
1) Total fatigue life to failure of base metal is longer than that of HAZ and weld metal, and weld metal has the shortest fatigue lifetime.
2) The difference of fatigue crack initiation life for base metal, weld metal and HAZ is negligible. The ratio of Ni to Nf is independent on stress amplitude, but dependent on microstructure and mechanical property.
3) A fatigue crack initiation life based model was proposed. The predicted total fatigue life using the present model is in good agreement with the experimental data, and comparable with that using Basquin��s model.
4) The fatigue crack initiation mechanisms of base metal, weld metal and HAZ are different. In weld metal, fatigue crack initiated at solidification cracking or eutectics existing in grain boundaries. Blowhole is the primary reason of fatigue crack initiation for HAZ. And the cause of fatigue crack initiation in base metal is attributed to crushed large second phase particles.
References
[1] SINGH R K R, SHARMA C, DWIVEDI D K. The microstructure and mechanical properties of friction stir welded Al�CZn�CMg alloy in as welded and heat treated conditions [J]. Materials & Design, 2011, 32(2): 682-687.
[2] GHOSH K S, GAO N. Determination of kinetic parameters from calorimetric study of solid state reactions in 7150 Al-Zn-Mg alloy [J]. Transactions of Nonferrous Metals Society of China, 2011, 21(6): 1199-1209.
[3] RAVINDRA B, KUMAR T S, BALASUBRAMANIAN V. Fatigue life prediction of gas metal arc welded crucifrom joints of AA7075 aluminium alloy failing from root region [J]. Transactions of Nonferrous Metals Society of China, 2011, 21(6): 1210-1217.
[4] BALASUBRAMANIAN V, RAVISANKAR V, MADHUSUDHAN REDDY G. Influences of pulsed current welding and post weld aging treatment on fatigue crack growth behaviour of AA7075 aluminium alloy joints [J]. International Journal of Fatigue, 2008, 30(3): 405-416.
[5] LILJEDAHL C D M, BROUARD J, ZANELLATO O. Weld residual stress effects on fatigue crack growth behaviour of aluminium alloy 2024-T351 [J]. International Journal of Fatigue, 2009, 31(6): 1081-1088.
[6] ZHANG Y H, MADDOX S J. Fatigue life prediction for toe ground welded joints [J]. International Journal of Fatigue, 2009, 31(7): 1124-1136.
[7] PILKEY W D, PETERSON R E. Peterson��s stress concentration factors [M]. New York: Wiley, 1997: 89.
[8] CHABOCHE J L. Continuum Damage Mechanics: Part I��General concepts [J]. Journal of Applied Mechanics, 1988, 55(1): 59-64.
[9] CHEMINGUI M, KHITOUNI M, JOZWIAK K. Characterization of the mechanical properties changes in an Al�CZn�CMg alloy after a two-step ageing treatment at 70 ��C and 135 ��C [J]. Materials & Design, 2010, 31(6): 3134-3139.
[10] XIANG Y, LU Z, LIU Y. Crack growth-based fatigue life prediction using an equivalent initial flaw model, Part I: Uniaxial loading [J]. International Journal of Fatigue, 2010, 32(2): 341-349.
[11] MOHANTY J R, VERMA B B, RAY P K. Prediction of fatigue crack growth and residual life using an exponential model: Part I��Constant amplitude loading [J]. International Journal of Fatigue, 2009, 31(3): 418-424.
[12] GLANCEY C D, STEPHENS R R. Fatigue crack growth and life predictions under variable amplitude loading for a cast and wrought aluminum alloy [J]. International Journal of Fatigue, 2006, 28(1): 53-60.
[13] BAO R, ZHANG X. Fatigue crack growth behaviour and life prediction for 2324-T39 and 7050-T7451 aluminium alloys under truncated load spectra [J]. International Journal of Fatigue, 2010, 32(7): 1180-1189.
[14] LEMAITRE J. How to use damage mechanics [J]. Nuclear Engineering and Design, 1984, 80(2): 233-245.
[15] PAYNE J, WELSH G, CHRIST JR R J. Observations of fatigue crack initiation in 7075-T651 [J]. International Journal of Fatigue, 2010, 32(2): 247-255.
[16] OULD CHIKH B, IMAD A, BENGUEDIAB M. Influence of the cyclic plastic zone size on the propagation of the fatigue crack in case of 12NC6 steel [J]. Computational Materials Science, 2008, 43(4): 1010-1017.
[17] IRWIN G R. Analysis of stresses and strains near the end of a crack transfering of a plate [J]. Journal of Applied Mechanics, 1957, 24(4): 361-364.
A7N01���Ͻӽ�ͷ��ƣ�����Լ�����Ԥ��
��ѩ��1���� ��1������ɭ1,2����˫��1������Ԩ1
1. ��������ҵ��ѧ �Ƚ����������ӹ����ص�ʵ���ң������� 150001��
2. ������¯�ɷ�����˾ ���ղ������ң��Թ� 643001
ժ Ҫ���о�A7N01���Ͻӽ�ͷ��ƣ�����ԣ��������ƣ��������������������Ԥ��ģ�͡�ĸ�ġ���Ӱ�����ͺ������������ڵ�ƣ�������������������С���������������ڣ�ƣ����������������ƣ��������֮����һ�������ڲ��ϵIJ���������ĸ�ġ���Ӱ�����ͺ���ֱ�Ϊ26.32%��40.21% ��60.67%�������ƣ������Ԥ��ģ����ʵ������Basquin��sģ��Ԥ�����Ǻ����á�����ɨ���������(SEM)��ƣ�ͶϿڽ��й۲죬���ֺ�����������������ں��ӹ����в����Ĺ⻬���档��Ӱ������ƣ�������������ۺ������ס�ĸ��������ĵڶ���������ƣ�����Ƶ���Ҫԭ��
�ؼ��ʣ����Ͻ�A7N01���Ͻ𣻺��ӽ�ͷ������������ƣ�ͣ�ƣ������������Ԥ��
(Edited by LI Xiang-qun)
Corresponding author: LIU Xue-song; Tel: +86-451-86418433; Fax: +86-451-86416186; E-mail: hanjiejiegou@sina.com
DOI: 10.1016/S1003-6326(11)61552-5

