Article ID: 1003-6326(2005)02-0389-06
Simulation of cooling channel rheocasting process of A356 aluminum alloy using three-phase volume averaging model
T. Wang1, 3, B. Pustal1, M. Abondano1, T. Grimmig1,
A. B��hrig-Polaczek1, M. Wu2, A. Ludwig2
(1. Foundry Institute, Aachen University of Technology, Aachen, D-52072, Germany;
2. Department of Metallurgy, University of Leoben, Leoben, A-8700, Austria;
3. Research Center of Foundry Engineering, Dalian University of Technology, Dalian 116024, China)
Abstract: The cooling channel process is a rehocasting method by which the prematerial with globular microstructure can be produced to fit the thixocasting process. A three-phase model based on volume averaging approach is proposed to simulate the cooling channel process of A356 Aluminum alloy. The three phases are liquid, solid and air respectively and treated as separated and interacting continua, sharing a single pressure field. The mass, momentum, enthalpy transport equations for each phase are solved. The developed model can predict the evolution of liquid, solid and air fraction as well as the distribution of grain density and grain size. The effect of pouring temperature on the grain density, grain size and solid fraction is analyzed in detail.
Key words: A356 alloy; modeling; cooling channel; three-phase; semi-solid CLC number: TG249.9
Document code: A
1 INTRODUCTION
In spite of a lot of advantages of the thixocasting process, the transformation to industrial production has still only happened in individual cases yet. This market caution is highly affected by the divided production of prematerial by continuous casting with electromagnetic stirring and the reheating process of the thixo-material. This way of production is known as low-cost method to produce high quality castings. Characteristic of the rheocasting process is that the globular microstructure is attained in one step process with a direct connection to the die casting machine. The reheating process of solid billets is not necessary. The overall costs and especially the energy consumption are lower than in the conventional thixocasting process[1, 2]. The cooling channel technique is one of the popular methods for the rheocasting process, which is schematically shown in Fig.1. Liquid metal with only a slight superheating is poured over an inclined cooling channel. By this way, the liquid melt falls quickly into the semi-solid area and consequently nucleates. The newly developed grains get sheared and come into the container because of the flow over the declined channel. An important aspect for the success of the process is the pouring temperature. The experiments show that the best results could be achieved by pouring temperatures 10-15K over the liquidus temperature. After the termination of the pouring, the cooling process to semi-solid temperature is influenced by the isolation of the ceramic coated container through a decelerated cooling. A globular microstructure is finally attained. The semi-solid billet is then transferred to the forming unit directly[2, 3].
In recent years, a lot of researchers focused on modeling the semi-solid processes. Wu et al[4] developed a shape determination model for grain growth using solidification velocity and flow speed of the liquid as variations of affecting the shape of crystals. Modigell and Koke[5] modeled the rehocasting and thixocasting processes. In the model, the semi-solid alloy is regarded as a homogeneous material with thixotropic properties and the microstructure is characterized by a structural parameter. The model consists of two parts: the equation of state, including a finite yield stress, and a rate equation for the structural parameter. A new general non-isothermal rheological model of metal alloys in the thixoforming processes has been derived[6]. The model uses the two-phase approach to flow description with two momentum conservation equations buckled by common pressure and interface drag force. The thixotropy phenomena occurring in the globular structure of the alloy, is modelled by means of an extra kinetic equation describing agglomeration degree. In particular, an encouraging multiphase/multiscale volume avera ging model was developed by Beckermann��s group[7-10] and further modified to study the globular equiaxed solidification by Ludwig and Wu[11-15]. In this paper, we apply Ludwig-Wu��s model to simulate the cooling channel process with considering three phases of liquid, solid and air. The modeling of momentum and enthalpy interactions between air and liquid or solid can be found in Ref[16] for the details. This model considers the nucleation law and growth kinetics, and has strong ability to study melt convection and grain movement phenomena in solidification. Here, we focus on simulating the evolution of liquid, solid and air fraction, the distribution of grain density, grain size. The effect of pouring temperature on the distribution of grain density, grain size and solid fraction is studied.
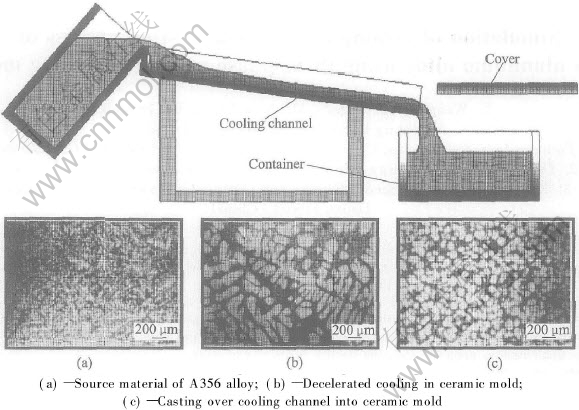
Fig.1 Schematic diagram of cooling channel process[1]
2 MODEL DESCRIPTION
There are totally three phases involved in the cooling channel semi-solid process: the liquid melt, the solidifying grains and the rest air. We employ volume averaging approach to formulate the conservation equations of mass, momentum, species, and enthalpy for the three phases.
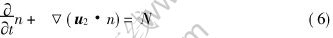
Mass:
where q and p denote the phases of liquid (=1), solid (=2) and air (=3). Note that the air has no mass transfer with other phases, therefore Mpq is zero in case of q=3.
Momentum:
where

Species:

Note that the species calculation for the third phase of air should be omitted since there is no species mass transfer within the air phase.
Enthalpy:
where
Grain Transport:
where f is the volume fraction, u is the velocity vector, c is the mass fraction of species, h is the enthalpy and T is the temperature, n is the grain density, g is the gravity vector, p is the pressure, �� is strain tensor, �� is viscosity, �� is the density, k is the thermal conductivity, cp is specific heat, M is a source term representing the mass transfer between liquid and solid, N is a source term representing the grain nucleation rate, U, C and Q are the source terms caused by a mechanical or thermal interaction and a phase change. All the physical parameters appearing in the conservation equations above follow the concept of ��volume average��.
Please refer to our previous work[11-16] for more details of the descriptions of the nucleation, growth kinetics and mass transfer rate definition, solute partitioning at liquid-solid interface, momentum and enthalpy transfer among the phases of liquid, solid and air.
The conservation equations(Eqns. (1)-(6)) are numerically solved by using a fully implicit and control-volume-based finite difference method. A CFD software FLUENT (Ver. 6.1) is used here.
3 RESULTS AND DISCUSSION
The developed model was used to simulate the cooling channel process. Fig.2 shows the numerical geometry and the predefined A��A�� section in cooling channel and left, center, right, top, bottom sections in container. The pouring way was treated as a velocity inlet with 0.25m/s. The open top of cooling channel was treated as pressure inlet with standard atmosphere pressure 105Pa. Two cases with different pouring temperature were simulated and compared. One is 625�� with superheat of 12��, and another one is 645�� with superheat of 32��.
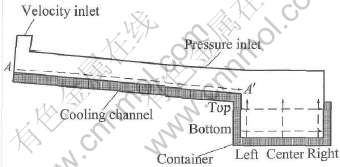
Fig.2 Numerical model of cooling channel process
Fig.3 shows the curve of grain size in A��A�� section after pouring 1.1s. For both cases, the curves appear wavy and the maximum of grain density occurs in the position where the hot melt firstly contacts the cooling channel. The differences are, the curve in case of superheat 12�� is higher and also ��slower�� (more left) than that in case of superheat of 32��. The similar phenomena can be also found in the curves of grain size (see Fig.4) and solid fraction (see Fig.5). The only difference is that the maximums of grain size and solid fraction occur in the front of flow but not at the beginning of cooling channel as the case of grain density. The hot melt is pouring into the cooling channel. A lot of nuclei are then generated while melt contacts the cooling channel due to the sudden chilling. This is the reason why the maximum grain density occurs there. The nuclei are scoured towards the flow front around the cooling channel by the fresh pouring melt frequently. After leaving the hot pouring part, the nuclei start to grow as big grains and finally get together in the flow front forming the maximum grain size and solid fraction there. The curves of grain density, grain size and solid fraction look like wave due to the periodic process: pouring��nucleation��growth��flow��pouring. Lower superheat means higher under-cooling and higher under-cooling means higher nucleation and growth rates. Therefore all the curves in case of superheat of 12�� are higher than those in case of superheat of 32��. However, higher solid fraction produces much more hindering force to the flow and hence the curve of superheat of 12�� looks ��slower�� (more left) than that of another case.
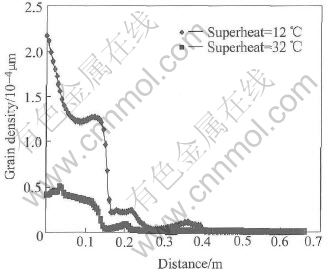
Fig.3 Profile of grain density in A��A�� section of cooling channel
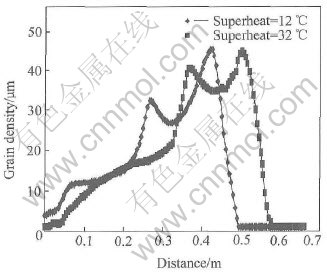
Fig.4 Profile of grain size in A��A�� section of cooling channel
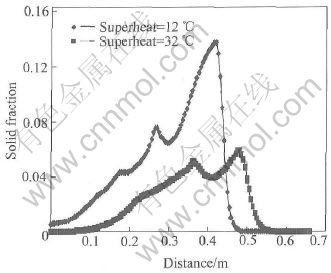
Fig.5 Profile of solid fraction in A��A�� section of cooling channel
After 2.87s, the pouring was stopped and then the melt was kept in container for 12.34s. The corresponding grain density profiles in different sections are shown in Fig.6. It is noted that the grain density is decreased from the left side to the right side and increased from the bottom to the top within the container. The distribution of grain size shown in Fig.7 is similar to that of solid fraction shown in Fig.8 but opposite to that of grain density. In this sense, the grain size plays a dominate role on the solid fraction. From all the curves, relatively smooth distributions are found in the middle but some differences in the four sides within the container. Particularly, the difference is big between the bottom and the top. The difference of grain size is around 60��m between the bottom and the top and around 30��m between the right and the left. The difference of solid fraction is around 0.5 between the bottom and the top and around 0.2 between the right and the left. The differences are mainly caused by the temperature gradient and the convection pattern which can be simulated by the presented model perfectly.
Fig.9 shows the results of each phase fraction, grain diameter and temperature after pouring 2.2s. The large grain size and high solid fraction can be obviously found in the right-bottom corner. The air is squeezed out by the incoming granular flow. The melt stream (characterized by liquid fraction) becomes more and more narrow from the pouring position to the end of cooling channel. However the solid stream (characterized by solid fraction and grain size) is the opposite. As discussed above, nucleation occurs in the pouring position by sudden chilling. And then they are pushed by the new pouring melt towards the end of cooling channel and get together there. From the temperature distribution, a hot zone is seen around the pouring position. This means that the formed nuclei can hardly survive there if they are not put forward to the flow front gradually.
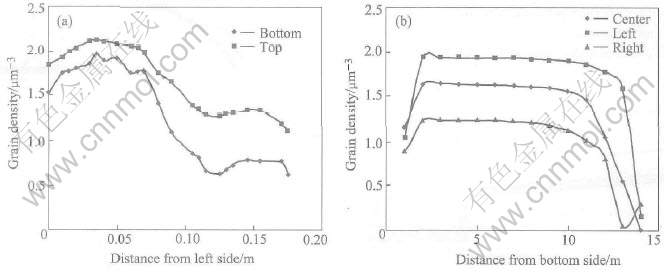
Fig.6 Profile of grain density in container
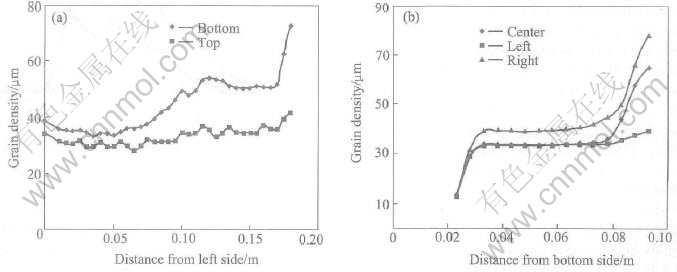
Fig.7 Profile of grain size in container
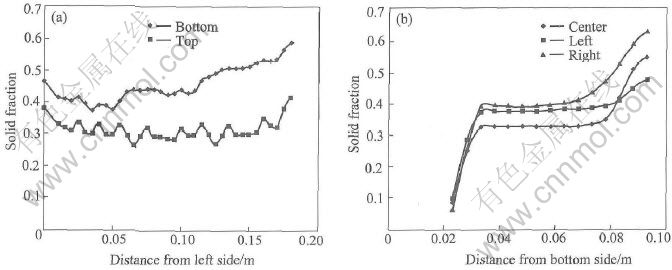
Fig.8 Profile of solid fraction in container
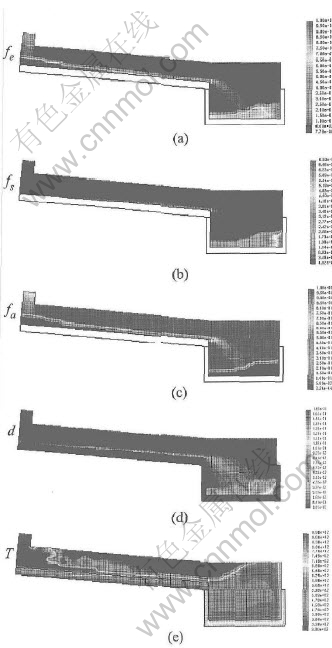
Fig.9 Simulated results of liquid fraction fl(a), solid fraction fs(b), air fraction fa(c),
grain size d(d), and temperature T(e)
4 CONCLUSIONS
1) A three-phase model based on volume averaging approach is developed. It is applied to the cooling channel process.
2) The process in case of pouring temperature 12�� produces higher grain density and solid fraction as compared with the case of pouring temperature 32�� in the cooling channel part. However the flow in the former case is slower than that in the latter case because the higher solid fraction leads to a larger hindering force to the flow.
3) The grain size and solid fraction have similar distribution which is almost opposite to that of grain density. Relatively smooth distributions of grain density, grain size and solid fraction are found in the middle but some differences in the four sides (especially between the top and bottom) within the container.
4) Large solid fraction is found in the front of flow within the cooling channel. A little solid fraction and very high grain density are found in the pouring position.
REFERENCES
[1]Grimmig T, Aguilar J, Fehlbier M, et al. Optimization of the Rheocasting Process under Consideration of the Main Influence Parameters on the Microstructure[DB/CD]. Cyprus: TMS, 2004.
[2]Aguilar J, Fehlbier M, B��hrig-Polaczek A. New Mg-alloys for the thixomoldingTM process [A]. Proceedings of the 6th International Conference Magnesium Alloys and Their Applications [C]. Wolfsburg: Kainer, 2004. 37-42.
[3]Aguilar J, Grimmig T, B��hrig-Polaczek A. Rheo-container-process (RCP): new semisolid forming method for light metal alloys [A]. Proceedings of the 6th International Conference Magnesium Alloys and Their Applications [C]. Wolfsburg: Kainer, 2004. 767-773.
[4]Wu S, Wu X, Xiao Z. A model of growth morphology for semi-solid metals [J]. Acta Materialia, 2004, 52(12): 3519-3524.
[5]Modigell M, Koke J. Rheological modelling on semi-solid metal alloys and simulation of thixocasting processes [J]. Journal of Materials Processing Technology, 2001, 111(1-3): 53-58.
[6]Petera J, Kotynia M. The finite element model of non-isothermal semi-solid fluid flow [J]. International Journal of Heat and Mass Transfer, 2004, 47(6-7): 1483-1498.
[7]Beckermann C, Viskanta R. Mathematical modelling of transport phenomena during alloy solidification [J]. Appl Mech Rev, 1993, 46: 1-27.
[8]Wang C Y, Beckermann C. Equiaxed dendritic solidification with convection-I: Multiscale-multiphase modelling [J]. Metall Mater Trans A, 1996, 27: 2754-2764.
[9]Wang C Y, Beckermann C. Equiaxed dendritic solidification with convection-II: Numerical simulation for an Al-4wt%Cu alloy [J]. Metall Mater Trans A, 1996, 27: 2765-2783.
[10]Wang C Y, Beckermann C. Equiaxed dendritic solidification with convection(��)��Comparisons with NH4Cl-H2O experiments [J]. Metall Mater Trans A, 1996, 27: 2784-2795.
[11]Wu M, Ludwig A. Influence of phase-transport phenomena on macrosegregation and strucutre formation during solidification [J]. Adv Eng Mater, 2003, 5(1-2): 62-66.
[12]Wu M, Ludwig A, B��hrig-Polaczek A, et al. Influence of convection and grain movement on globular equiaxed solidification [J]. Int J Heat Mass Transfer, 2003, 46: 2819-2832.
[13]Ludwig A, Wu M, Wang T, et al. About the interaction between thermo-solutal convection and grain sedimentation during globular equiaxed solidification [A]. Proceeding 3rd International Conference on Computational Modeling and Simulation of Materials [C]. Sicily: 2004.
[14]Ludwig A, Wu M. Modeling of globular equiaxed solidification with a two-phase approach [J]. Metall Mater Trans A, 2002, 33: 3673-3683.
[15]Wu M, Ludwig A. Modeling macroscopic phase seperation phenomena during solidification with an eulerian multiphase approach [A]. Proceedings of the 6th Pacific Rim International Conference on Modeling of Casting and Solidification Processes [C]. Kaohsiung: HWANG Weng-Sing, 2004. 239-246.
[16]Wang T, Wu M, Ludwig A, et al. Globular equiaxed solidification with thermo-solutal convection, shrinkage flow and grain movement by a three-phase model [A]. Proceedings of the 6th Pacific Rim International Conference on Modeling of Casting and Solidification Processes [C]. Kaohsiung: HWANG Weng-Sing, 2004. 181-189.
Received date: 2004-11-20; Accepted date: 2005-01-18
Correspondence: T. Wang, Associate Professor, PhD; Tel: +86-411-84709458; E-mail: tmwang@dlut.edu.cn
(Edited by HE Xue-feng)

