Mechanical and electrical properties of coarse-grained soil affected by cyclic freeze-thaw in high cold regions
��Դ�ڿ������ϴ�ѧѧ��(Ӣ�İ�)2020���3��
�������ߣ����廢 ������ ����� ţ���� �¹��� ��
����ҳ�룺853 - 866
Key words��coarse-grained soil; freeze-thaw cycle; unconfined compressive strength; electrical resistivity; electrical resistivity model
Abstract: To evaluate the geotechnical properties of coarse-grained soil affected by cyclic freeze-thaw, the electrical resistivity and mechanical tests are conducted. The soil specimens are prepared under different water contents, dry densities and exposed to 0-20 freeze-thaw cycles. As a result, the stress-strain behavior of the specimen (w =14.0% and ��d=1.90 g/cm3) changes from strain-hardening into strain-softening due to the freeze-thaw effect. The electrical resistivity of test specimen increases with the freeze-thaw cycles change, but the mechanical parameters (the unconfined compressive strength qu and the deformation modulus E) and brittleness index decrease considerably at the same conditions. All of them tend to be stable after 7-9 cycles. Moreover, both the dry density and the water content have reciprocal effects on the freeze-thaw actions. The failure and pore characteristics of specimens affected by freeze-thaw cycles are discussed by using the image analysis method. Then, an exponential function equation is developed to assess the electrical resistivity of specimens affected by the cyclic freeze-thaw. Linear relations between the mechanical parameters and the electrical resistivity of specimens are established to evaluate the geotechnical properties of the soil exposed to freeze-thaw actions through the corresponding electrical resistivity.
Cite this article as: QU Yong-long, NI Wan-kui, NIU Fu-jun, MU Yan-hu, CHEN Guo-liang, LUO Jing. Mechanical and electrical properties of coarse-grained soil affected by cyclic freeze-thaw in high cold regions [J]. Journal of Central South University, 2020, 27(3): 853-866. DOI: https://doi.org/10.1007/s11771-020-4336-8.

J. Cent. South Univ. (2020) 27: 853-866
DOI: https://doi.org/10.1007/s11771-020-4336-8

QU Yong-long(������)1, 3, NI Wan-kui(�����)1, NIU Fu-jun(ţ����)2,
MU Yan-hu(���廢)2, CHEN Guo-liang(�¹���)4, LUO Jing(��)2
1. College of Geological Engineering and Geomatics, Chang��an University, Xi��an 710064, China;
2. State Key Laboratory of Frozen Soil Engineering, Northwest Institute of Eco-Environment
and Resources, Chinese Academy of Sciences, Lanzhou 730000, China;
3. School of Civil and Architecture Engineering, Xi��an Technological University, Xi��an 710021, China;
4. China Gold Group Tibet Tyrone Mining Development Co., Ltd., Lhasa 850000, China
 Central South University Press and Springer-Verlag GmbH Germany, part of Springer Nature 2020
Abstract: To evaluate the geotechnical properties of coarse-grained soil affected by cyclic freeze-thaw, the electrical resistivity and mechanical tests are conducted. The soil specimens are prepared under different water contents, dry densities and exposed to 0-20 freeze-thaw cycles. As a result, the stress-strain behavior of the specimen (w =14.0% and ��d=1.90 g/cm3) changes from strain-hardening into strain-softening due to the freeze-thaw effect. The electrical resistivity of test specimen increases with the freeze-thaw cycles change, but the mechanical parameters (the unconfined compressive strength qu and the deformation modulus E) and brittleness index decrease considerably at the same conditions. All of them tend to be stable after 7-9 cycles. Moreover, both the dry density and the water content have reciprocal effects on the freeze-thaw actions. The failure and pore characteristics of specimens affected by freeze-thaw cycles are discussed by using the image analysis method. Then, an exponential function equation is developed to assess the electrical resistivity of specimens affected by the cyclic freeze-thaw. Linear relations between the mechanical parameters and the electrical resistivity of specimens are established to evaluate the geotechnical properties of the soil exposed to freeze-thaw actions through the corresponding electrical resistivity.
Key words: coarse-grained soil; freeze-thaw cycle; unconfined compressive strength; electrical resistivity; electrical resistivity model
Cite this article as: QU Yong-long, NI Wan-kui, NIU Fu-jun, MU Yan-hu, CHEN Guo-liang, LUO Jing. Mechanical and electrical properties of coarse-grained soil affected by cyclic freeze-thaw in high cold regions [J]. Journal of Central South University, 2020, 27(3): 853-866. DOI: https://doi.org/10.1007/s11771-020-4336-8.
1 Introduction
Mine dump is a special site where the mining waste is concentrated and discharged. The dump slope stability is of great importance in all conditions and stages of mining working [1, 2]. In recent years, more and more mine exploitations are conducted in seasonal frost and permafrost regions of high-altitude regions. Compared with the dumps in gentle climate regions, the stability of dump slopes in cold regions is additionally affected by the cold climate, especially the freeze and thaw actions [3-5].
Cyclic freeze-thaw is a strong weathering action that can cause series of changes in the geotechnical properties of soils, which results in detrimental effects on the long-term stability of slope and engineering foundations [6, 7]. Up to present, lots of researches on this topic have been carried out mainly through laboratory testing. VIKLANDER [8] found that after cyclic freeze-thaw, the soil exhibited volume changed. That is, the volume of loose soils decreased, while the volume of dense soils increased [9]. HANSSON et al [10] proposed that the sensitivity in freezing and thawing of clay soil was greater than that of sandy soil and silt soil. For the strength properties of soils, GHAZAVI et al [11] found that the freeze-thaw effect resulted in a decreasing unconfined compressive strength of clay soil. KAMEI et al [12] observed that both the strength and durability index of the soft soil decreased because of the effect of cyclic freeze-thaw. WANG et al [13] and QI et al [9] proposed that the freeze-thaw actions decreased the cohesion of the clay soil and increased its internal friction angle. However, LIU et al [14] observed that with the influence of cyclic freeze-thaw, the friction angle of silty sand first decreased and then increased. For the deformation characteristics of soils, LU et al [15] found that the resilient modulus of expansive soil decreased with the change of freeze-thaw cycles. Similar results on the resilient modulus of subgrade soil subjected to the freeze-thaw actions had been reported by SIMONSEN et al [16]. These researches well reveal the structure of soils influenced by the freezing and thawing, thus revealing the geotechnical properties of soils. Compared with laboratory testing, the electrical resistivity method is an effective tool for characterizing soils recently due to its properties of non-destructive [17]. There have been some attempts to study the electrical resistivity of soils and the relationships between mechanical parameters and electrical resistivity, but the freeze-thaw effect has been considered in few studies [18-20].
Coarse-grained soil taken from mine dumps generally shows great variability in grain size distribution [2]. When it contains fine particles, it is sensitive to cyclic freeze-thaw [21]. The complex geotechnical properties of coarse-grained soil affected by the freeze-thaw actions have a close relationship with the long-term stability of dump slopes in cold regions [22, 23]. However, up to the present, quite limited researches have been done on the geotechnical properties of soil from a mine dumps subjected to freeze-thaw actions in cold regions [24, 25]. One of the reasons is that the undisturbed coarse-grained soil is difficult to be collected for laboratory testing, while the electrical resistivity measurement can effectively solve this problem [26, 27]. In this study, laboratory tests are conducted to study the mechanical and electrical properties of coarse-grained soil affected by the cyclic freeze-thaw in high cold regions.
2 Materials and methods
2.1 Material properties
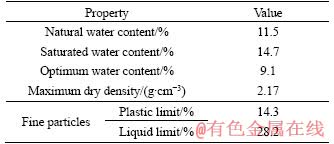
The test soil was collected from a dump slope in the Maizhokunggar regions of China (N29��42'29.12", E91��46'10.53'', an altitude of 5200 m), as shown in Figure 1. According to the weather station at the site, the air temperature of sampling place ranged from -23.5 to 22.7 ��C, with a mean annual value of 5.7 ��C. The grain size distribution of the test soil is listed in Table 1. Thus, the test soil can be classified as coarse-grained soil because the content of particles larger than 0.075 mm is more than 50%. Moreover, the fine particles (silt and clay) in the soil can reach to 23.4%. According to the standard proctor test, the maximum dry density of the test soil was 2.17 g/cm3 and the optimum water content was 9.1%. The plastic limit of the fine particle part was 4.3% and the liquid limit was 28.2%. The physical parameters are presented in Table 2.
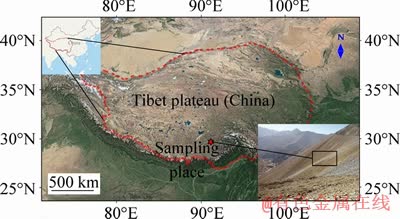
Figure 1 Sampling place in Maizhokunggar regions of China
Table 1 Particle size distribution of test soil
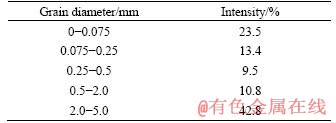
Table 2 Physical properties of test soil
2.2 Specimen preparation
According to the test requirements, the test soil was firstly mixed to the targeted water content and kept in an airtight container for 6 h. Then, the cylindrical specimens (the diameter D=61.8 mm, and the height H=125 mm) were prepared in a steel cylinder, in which the specimens were formed by three layers of compaction. To investigate the influences of density and water on the geotechnical properties of test soil, the dry densities (��d) of 1.9, 2.0 and 2.15 g/cm3 and the water contents (w) of 9.0%, 11.5% and 14.0% were selected in this study.
2.3 Freeze-thaw cycles
As the groundwater level in the study site is deep, there is almost no water supply during the actual freezing and thawing. In this test, the test specimens were wrapped by the plastic films to avoid water evaporation. Then, the specimen was put in a temperature-control environmental box for a closed freeze-thaw test, which had the temperature accuracy of ��0.5 ��C. According to the in-situ air temperature, the frozen temperature of the test specimen was -20 ��C and the thawed one was 20 ��C. Each of the freezing and thawing processes was kept about 12 h. The cycles of 0, 1, 3, 5, 7, 9, 12, 15 and 20 were selected as the targeted freeze-thaw cycles (C). After every freeze-thaw test, the weight of the test specimen was measured to ensure the constant water content.
2.4 Electrical resistivity test
Following the freeze-thaw tests, the two- electrode method was applied to measure the electrical resistivity (��) of test specimens. In a typical two-electrode test, the charge is passed through the specimen using metal electrodes fixed to each end of the soil which has been used on the specimen [17, 20]. According to the measurement of both the electric potential difference (��V) and the electric current (I), the following formula was used to calculate the electrical resistivity:
��=(��V��A)/(I��L) (1)
where A stands for the area of the current across the specimen; L is the length of that. A digital bridge instrument (TH2810D), shown in Figure 2(a), was applied to test the electrical resistivity of specimens. The testing impedance range of the instrument is 0-100 M�� and the accuracy is less than 0.1%. Each specimen was automatically measured ten times to ensure the reliability of results.
2.5 Laboratory mechanical test
After the electrical resistivity test, the unconfined compressive strength test was conducted on the test specimens by using a mechanical testing device (Global Digital Systems Ltd., GDS), which has a maximum load capacity of 25 kN, as shown in Figure 2(b). The test procedure has been followed the Specification of Soil Test (SL237-1999) [28]. During the test, the loading surfaces of the instrument were lubricated with vaseline to eliminate the friction effect on the mechanical properties of specimens. The specimen was loaded at an axial deformation rate of 1.0 mm/min until the failure or the strain reached 15.0%.
3 Results and analysis
3.1 Variations of electrical resistivity
The variations of the electrical resistivity of the test specimens with the freeze-thaw cycles are shown in Figure 3. In this figure, the electrical resistivity of test specimens ranges from 76.9 to 477.4 ����m before the soil is subjected to the freeze-thaw cycles. However, the electrical resistivity of specimens decreases when both dry density and water content increase. This result is attributed to the water that is the main conductive medium of the soil [19, 29]. The increasing dry density can improve the water saturation of the test specimen. Besides, the electrical resistivity of test specimens is more affected by the water content than by the dry density.
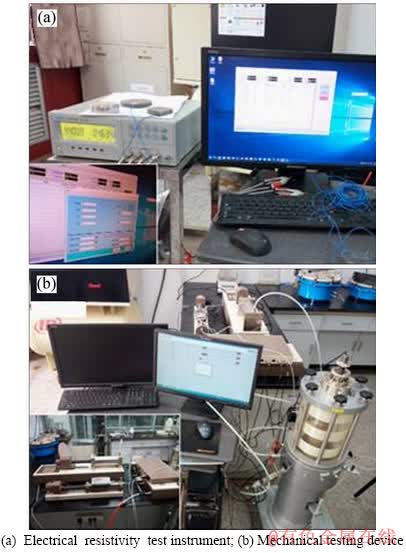
Figure 2 Test apparatus:
For the influence of cyclic freeze-thaw, the electrical resistivity of test specimens increases when the cyclic freeze-thaw changes. Compared with the unfrozen specimens, the electrical resistivity of specimens after 20 freeze-thaw cycles increases by 19.5%-38.7%. This is the result of porosity increase and clay particle decrease in the specimens due to the repeat freezing/thawing [30, 31]. Moreover, the freeze-thaw effect on the electrical resistivity of test soil is affected by the dry density and water content. For example, the dry densities of specimens are 1.9, 2.0 and 2.15 g/cm3, and the increase in the electrical resistivity due to the freezing/thawing ranges from 19.5% to 25.2%, 23.8% to 37.9% and 30.2% to 38.7%, respectively. Thus, both higher dry density and water content have greater freeze-thaw effect on the electrical resistivity. In addition, the considerable augment of the electrical resistivity occurs mainly before 7-9 freeze-thaw cycles. After that, the electrical resistivity of specimens almost remains constant.
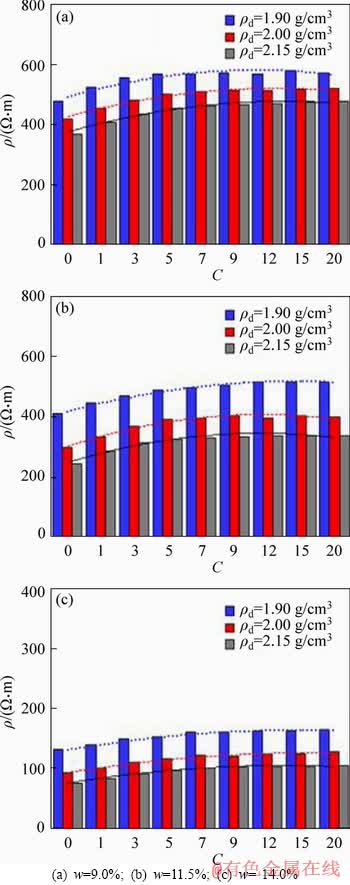
Figure 3 Electrical resistivity of specimen after different freeze-thaw cycles:
3.2 Characteristics of stress-strain behaviors
Figure 4 shows the stress-strain (��-��) relationships of coarse-grained soil affected by different cyclic freeze-thaw. It can be seen that the stress-strain relationships of most specimens before the freeze-thaw cycles show as strain-softening (Figure 4(a)). In the figure, the stress-strain curve has a clear peak stress and the stress reduces rapidly with further increasing strain. However, the stress-strain behaviors of specimens are affected considerably by the water content and the dry density. The strain-softening of stress-strain behaviors changes into strain-hardening with the increasing water content and decreasing dry density. For example, the stress of the test specimen (w=14.0%, ��d=1.90 g/cm3) increases continuously as the strain increases and the peak stress cannot be observed. Figures 4(b) and (c) show the relationships between the stress of specimens exposed to 1�C20 cycles of freeze-thaw and the corresponding strain. To save space, only the results of the specimens at a lower water content and a larger dry density (w=9.0%, ��d=2.15 g/cm3) and other specimens (w=14.0%, ��d=1.90 g/cm3) are shown here. The former represents the specimens with strain-softening behavior and the latter represents those with strain-hardening behavior. It can be seen in Figure 4(b) that the freeze-thaw cycles almost do not change the type of the stress-strain relationships of specimens under the test conditions. However, in Figure 4(c), the stress-strain behavior slightly changes from strain-hardening into strain-softening with the increasing freeze-thaw cycles.
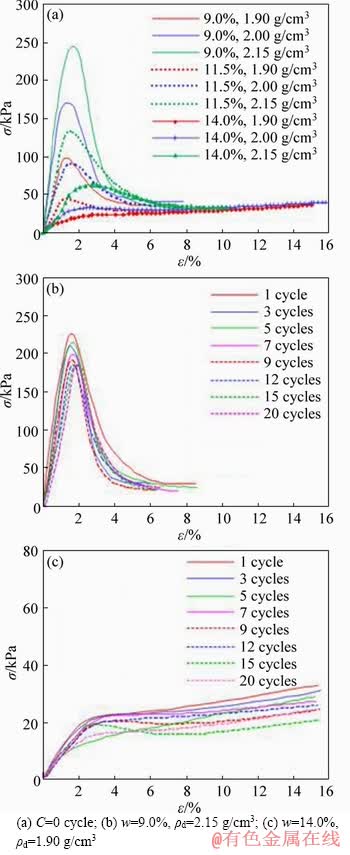
Figure 4 Stress-strain relationships of specimens:
3.3 Variations of strength properties
In the study, the stress at the peak stress (strain-softening) or strain 15.0% (strain-hardening) of stress-strain curve is defined as the unconfined compressive strength (qu) [12, 16]. Relationships between the unconfined compressive strength of specimens and the cycles of freeze-thaw are presented in Figure 5. The strength of specimens without experiencing freeze-thaw actions ranges from 35.7 to 244.0 kPa. The strength increases considerably with the decreasing water content and increasing dry density. However, the strength of specimens decreases as the cycles of freeze-thaw further increase. And the maximum reduction can reach much as 62.0% after 20 freeze-thaw cycles. When the water content of specimen changes from 9.0% to 14.0% in Figure 5(a), the reduction in the strength ranges from 62.0% to 31.8% due to the 20 cycles of freeze-thaw. Thus, the increasing water content has a negative effect on the reduction in strength of specimens. Moreover, the strength tends to be stable after the 7-9 cycles of freeze-thaw. The results illustrate that the freezing/thawing influence on the inner structure of test specimens mainly occurs in the primary freeze-thaw action and then a new equilibrium condition becomes predominant on the specimens [11].
3.4 Variations of deformation properties
In this study, when the strain is 1.0%, the ratio of stress value to the strain value is defined as the resilient modulus (E) [16]. Figure 6 presents the variations of the resilient modulus of the coarse-grained soil to different cycles of freeze-thaw. For specimens without exposed to freezing and thawing, the modulus range is from 1.4 to 24.5 MPa. The resilient modulus increases by 5.6 to 7.3 times when the water content decreases from 14.0 % to 9.0%. With the dry density changes from 1.90 to 2.15 g/cm3, the resilient modulus of specimens increases by 216%-274%. Thus, the water content and the dry density have different influence on the variations of resilient modulus, and the water content effect greater.
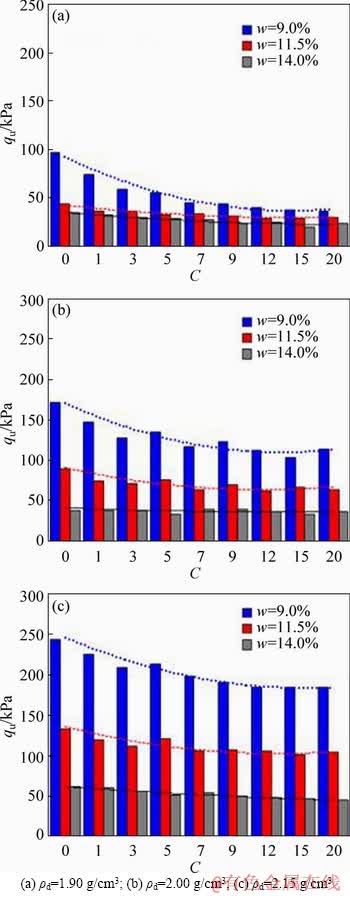
Figure 5 Variations of strength to cycles of freeze-thaw:
For the specimen affected by the freezing/thawing, its resilient modulus reduces with the increase of the cycles of freeze-thaw. After the 20th freeze-thaw cycle, the decreased amplitude of the resilient modulus of specimens reaches to 37.5%-65.0%. In addition, the larger dry density means the greater reduction of resilient modulus with the effect of freeze-thaw actions, but that of water content is opposite. Thus, the specimen at the largest dry density and the lowest water content (��d=2.15 g/cm3, w=9.0%) has the maximum reduction in the resilient modulus. Furthermore, the resilient modulus of the specimens decreases considerably before the 7�C9 freeze-thaw cycles. Beyond this range, the resilient modulus remains almost unchanged.
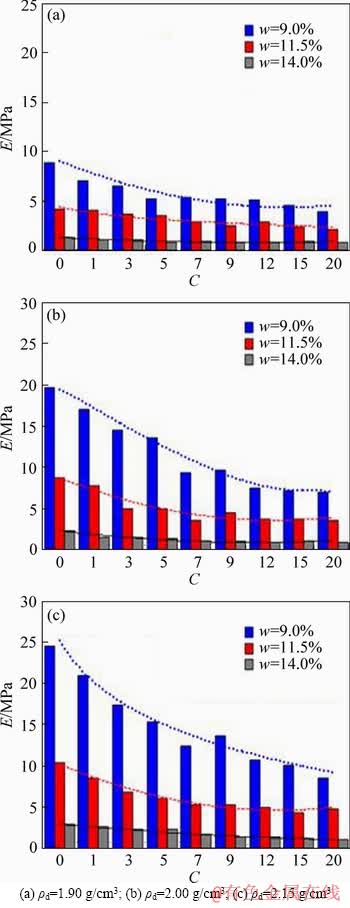
Figure 6 Variations of the resilient modulus to freeze-thaw cycles:
3.5 Variations of brittleness index and failure characteristics
According to the stress-strain behavior of specimens in this study, the deformation of most specimens in test conditions shows brittleness. To investigate the influence of cyclic freeze-thaw on brittle properties of specimens, the brittleness index IB can be defined as [32]:
 (2)
(2)
where qult is the ultimate stress.
Figure 7 shows the brittleness index of the coarse-grained soil subjects to different cycles of freeze-thaw. It is found that the brittleness index of test specimens before cyclic freeze-thaw ranges from 0.89 to 7.65. The increase of dry density improves the brittleness index of specimens, but the water content decreases it. It illustrates that the increasing dry density and decreasing water content have a considerably enhanced influence on the brittleness of test specimens. However, the brittleness index of specimens reduces with the increasing cycles of freeze-thaw. In comparison with the specimens before freeze-thaw cycles, the brittleness index reduction ranges from 19.7% to 54.5% after the 20th cycle. That is the cyclic freeze-thaw results in a weakening brittleness and an enhancing ductility of specimens. Moreover, it is also found that the significant decrease of brittleness index manly occurs before the 7-9 freeze-thaw cycles. Since then, the brittleness index of specimens tends to be stable.
Figure 8 shows the photos of specimens after shear failure. The angle between the failure planes and loading direction varies from 25�� to 45��. The angle and the thickness of the shear plane decrease with the increase of dry density (Figures 8(a)-(c)). It indicates that the increasing dry density enhances the brittleness of specimens. The angle and thickness of the shear plane increase with the increasing water content (Figures 8(c)-(e) and the freeze-thaw cycles (Figures 8(e)-(g)). Meanwhile, the shape of specimens performs as overall convex accompanying with lots of vertical micro-cracks appears (Figures 8(d)-(h)). These results indicate that the brittleness of the specimens weakens, which is consistent with the changes of the brittleness index in Figure 7.
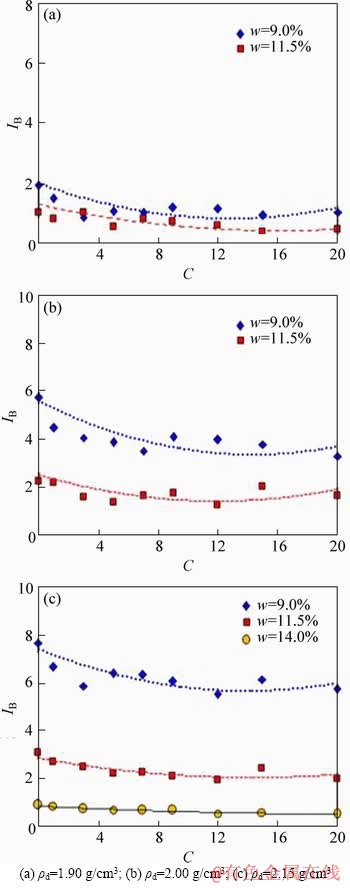
Figure 7 Brittleness index of coarse-grained soil for all freeze-thaw cycles:
4 Discussion
4.1 Effect mechanism of cyclic freeze-thaw
According to the test results above (Figures 4-6), the geotechnical properties of test specimens are affected significantly by the freeze-thaw actions. The reason is that there are a certain number of freeze-thaw sensitive particles (silt and clay particles) in the test specimens [21]. And the specimens at the tested dry density are relatively dense. When the soil freezes, the changes of ice volume result in the increase in particle spaces and a weakening in connection between particles. When the soil thaws, these changes are difficult to recover fully. The cyclic freeze-thaw causes these irreversible damages to accumulate in the soil structure. Subsequently, after freeze-thaw cycles, the mechanical parameters (unconfined compressive strength and resilient modulus) of the test specimen are reduced, which is different from the loose soils and coarse-grained soil without fine particles [9, 22]. Meanwhile, the variations of geotechnical properties of test specimen occur mainly before the 7-9 cycles. Due to the closed freeze-thaw system, the moisture content of test specimens is constant during the freezing and thawing.
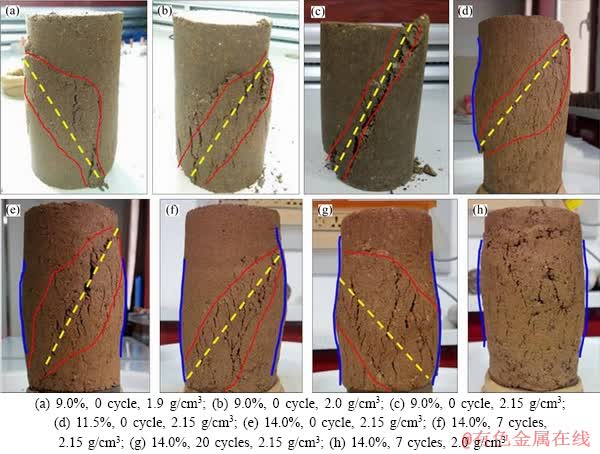
Figure 8 Failure characteristics of coarse-grained soil:(water content-freeze/thaw cycles-dry density)
Furthermore, the pore characteristics of coarse-grained soil affected by various freeze-thaw cycles can be investigated by using the Particles (Pores) and Cracks Analysis System (PCAS). Based on the analysis method of the image binaryzation, this software makes identification and quantization for the isolated areas (particles or pores) in the binary image [33]. As the analysis results, the main parameters of the porosity (��), the form factor (Ff) and the probability entropy (Pe) can be obtained by the statistic analysis of the pixels in the binary image [33, 34]. The analysis process and results on coarse-grained soil are shown in Figures 9 and 10. It is seen that the porosity of specimens increases by 4.6%�C5.4% due to the 20 cycles and it changes slightly after the 7�C9 freeze-thaw cycles. And both the form factor and probability entropy decrease a little with the increasing cycles. These variations illustrate that the freeze-thaw actions enlarge the pore volume of test specimen, complicate the pore edges and weakens the randomness of pore direction, accompanying with the variations of geotechnical properties of coarse-grained soil (Figures 3-8).
4.2 Electrical resistivity model of coarse-grained soil after cyclic freeze-thaw
ARCHIE [29] firstly proposed a linear electrical resistivity model of saturated pure sands. However, it is essential that the electrical resistivity model should consider the situation of unsaturated soil, because the majority of soils in nature are unsaturated. Besides, it was found that the application of Archie��s model usually overestimates the electrical resistivity of soils containing clay particles [35]. This finding is observed due to the conductivity of clay particles in soils.
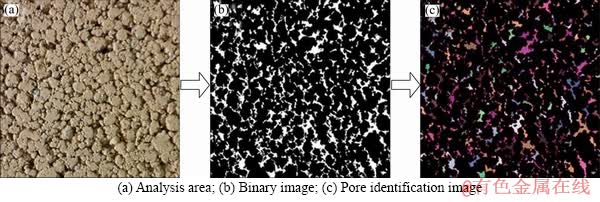
Figure 9 Pores analysis process:
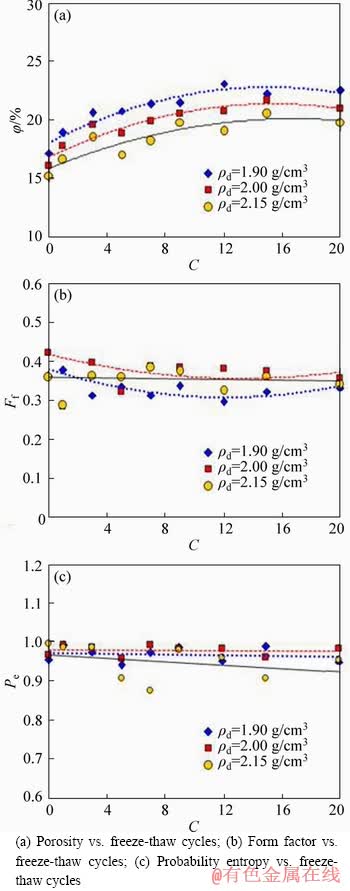
Figure 10 Pores analysis results with w=11.5%:
Then, the water saturation (Sr) is introduced into Archie��s model to adapt the unsaturated soils, as follows:
 (3)
(3)
where ��u is the electrical resistivity of unsaturated soils; ��w is the electrical resistivity of pore water; n and m are regression coefficients.
On the basis of the electric double-layer theory of clay particle, a modified Archie��s model (W-S model) [35] by considering the effect of clay particle is developed as:

 (4)
(4)
where ��0 is the electrical resistivity of unsaturated soils containing clay particle; K is the modified coefficient of clay particle; B is the empirical coefficient related to the cation exchange capacity; Q stands for the equivalent cation capacity per unit volume (lgQ=-3.56-2.74lg��); a is a fitting parameter. Moreover, Eq. (4) has been widely used in engineering, which is also suitable for the unsaturated coarse-grained soil containing fine particles.
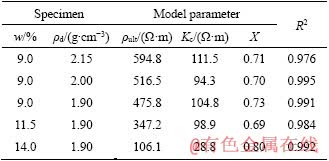
According to the test results in Figure 3, the electrical resistivity of coarse-grained soil in this study is considerably affected by the cyclic freeze-thaw. In order to evaluate the effect of freezing/thawing on the electrical resistivity of specimens (��), an exponential function can be proposed:
 (5)
(5)
where ��ult=�Ħ�0, ��ult is the ultimate resistivity; �� is the freeze-thaw effect coefficient; Kc represents the sensitivity range of curve fluctuation and X is the curve characteristic parameter.
To verify Eq. (5), the function parameters of the specimens are listed in Table 3. The predicted and test results are presented in Figure 11. The analysis results indicate that the determination coefficient (R2) ranges from 0.976 to 0.995. Besides, it can be receivable for the accuracy of the application of Eq. (5) which is used to predict the electrical resistivity of coarse-grained soil affected by cyclic freeze-thaw.
Table 3 Parameters value of proposed model
Then, Eq. (5) is substituted into Eq. (4), and the electrical resistivity model of unsaturated coarse-grained soil containing fine particles affected by the freeze-thaw cycles can be obtained, as follows:
 (6)
(6)
4.3 Relationship between mechanical parameters and electrical resistivity
Based on the test results above, the relationships between mechanical parameters and electrical resistivity of coarse-grained soil affected by cyclic freeze-thaw are investigated. At first, three parameters are defined as the strength ratio, resilient modulus ratio and electrical resistivity ratio. The strength ratio (qu/qu0) is the ratio of the unconfined compressive strength of the test specimens subjected to specific freeze-thaw cycles to that before cyclic freeze-thaw (qu0). The resilient modulus ratio (E/E0) and electrical resistivity ratio (��/��0) are defined the same as the strength ratio.
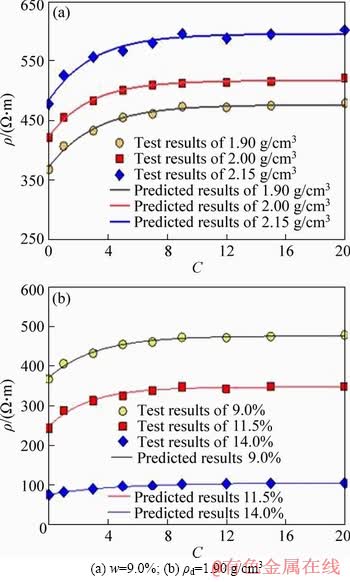
Figure 11 Predicted results of model and test results:
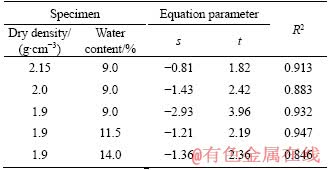
In order to evaluate the freeze-thaw effect on the unconfined compressive strength of test specimens by the electrical resistivity, the variations of the strength ratio versus the electrical resistivity ratio are plotted in Figure 12. It is indicated that the strength ratio reduces with the electrical resistivity ratio changes. Moreover, the relationship between the strength ratio and the electrical resistivity ratio can be regarded as an approximately linear relationship. Thus, the relationship can be expressed as:
 (7)
(7)
where s is the curve slope and t is the intercept of the line, and both of them are dimensionless quantity. Through the regression analysis, the parameters of s and t in Eq. (7) are listed in Table 4. The determination coefficient of Eq. (7) is 0.846 to 0.947.
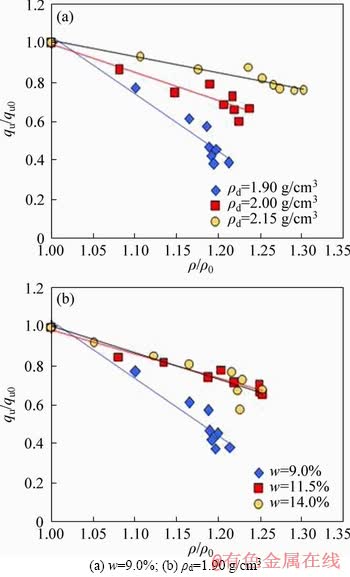
Figure 12 Variations of strength ratio versus electrical resistivity ratio:
Table 4 Computational parameters of equation
Then, the unconfined compressive strength of test specimens subjected to the cyclic freeze-thaw can be further described by the corresponding electrical resistivity, as following:
 (8)
(8)
where S and T are synthetic coefficients,  T=tq0.
In addition, to evaluate the resilient modulus of specimens after different freeze-thaw actions by the electrical resistivity, the variations of the resilient modulus ratio and the electrical resistivity ratio are shown in Figure 13. In the figure, these relationships also approximate to a linear relationship. Then, it also can be described as following:
 (9)
(9)
where g and h are severally the slope and intercept of the straight line, and they are dimensionless quantity. Through the regression analysis of test results, the function parameters (g and h) are listed in Figure 13. And the range of the determination coefficient is from 0.814 to 0.944.
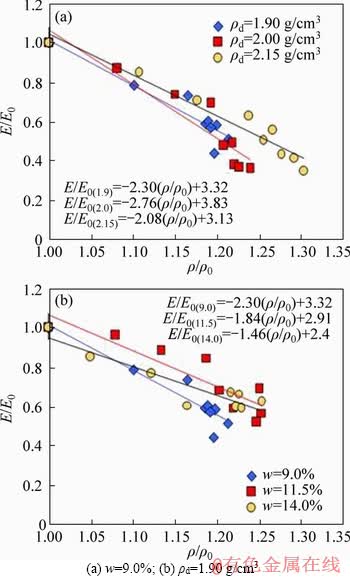
Figure 13 Variations of resilient modulus ratio versus electrical resistivity ratio:
Moreover, through the Eq. (9), the resilient modulus of specimens exposed to freeze-thaw can be evaluated by the corresponding electrical resistivity of the identical specimen, and is expressed as:
 (10)
(10)
where G and H are synthetic coefficients, G=gE0/��0, H=hE0.
On the basis of Eqs. (8) and (10), if both the mechanical parameters (qu0 and E0) and the electrical resistivity (��0) of specimens before freeze-thaw cycles have been measured and both the s and t (g and h) have been determined, the mechanical parameters (qu and E) of specimens after freeze-thaw cycles can be evaluated by the corresponding electrical resistivity (��). Meanwhile, the latter is an efficient nondestructive testing method without disturbing the soil structure, which has great potential for the prediction of geotechnical parameters in situ [20, 26].
Finally, combined with Eqs. (6), (8) and (10), the following uniform equation can be used to estimate the mechanical properties of coarse-grained soil affected by the freeze-thaw actions through the corresponding electrical resistivity:

 (11)
(11)
where P0 is the mechanical parameter of specimen before the cyclic freeze-thaw; P stands for the same parameter of specimen after the freeze-thaw actions; �� is the slope of the linear relationship between the mechanical parameter and electrical resistivity; �� is the intercept of the linear relationship; both M and N stand for synthetic coefficients, M=��P0/��0, N=��P0.
5 Conclusions
In this study, the electrical resistivity and mechanical tests are carried out on the coarse-grained soil subjected to different cycles of freeze-thaw. The purpose is to study the influence of cyclic freeze-thaw on the geotechnical properties of coarse-grained soil taken from a dump slope in the Maizhokunggar regions of China. The results are as follows:
1) The stress-strain relationships (��-��) of test specimens show mainly as strain-softening. However, the relationship of a few specimens (w=14.0% and ��d=1.90 g/cm3) presents as strain- hardening, and tends to change into strain-softening with the influence of cyclic freeze-thaw.
2) The mechanical properties (strength parameter qu and deformation parameter E) and brittleness index decrease with the increasing cycles of freeze-thaw. They all change slightly beyond the range of 7-9 cycles. The larger dry density can result in a greater reduction for all the three parameters, but the water content has an opposite effect.
3) The electrical resistivity of coarse-grained soil increases with the cyclic freeze-thaw changes. The considerable increase in electrical resistivity occurs mainly before the 7-9 cycles. Both the increasing dry density and water content result in decreasing electrical resistivity of the coarse- grained soil and the latter has a greater influence.
4) An exponential function well adapts the variations of electrical resistivity of coarse-grained soil affected by different cyclic freeze-thaw. Linearly relationships between the mechanical parameters (qu and E) and electrical resistivity are proposed to evaluate the mechanical properties of test specimens affected by different freeze-thaw cycles through the corresponding electrical resistivity.
References
[1] CHO Y C, SONG Y S. Deformation measurements and a stability analysis of the slope at a coal mine waste dump [J]. Ecological Engineering, 2014, 68: 189-199. DOI: 10.1016/ j.ecoleng.2014.03.005.
[2] KONER R, CHAKRAVARTY D. Characterisation of overburden dump materials: A case study from the Wardha valley coal field [J]. Bulletin of Engineering Geology and the Environment, 2016, 75(3): 1311-1323. DOI: 10.1007/ s10064-015-0830-x.
[3] ZHOU Zhong, XING Kai, YANG Hao, WANG Hao. Damage mechanism of soil-rock mixture after freeze-thaw cycles [J]. Journal of Central South University, 2019, 26(1): 13-24. DOI: 10.1007/s11771-019-3979-9.
[4] BEHERA P K, SARKAR K, SINGH A K, VERMA A K, SINGH T N. Dump slope stability analysis-A case study [J]. Journal of the Geological Society of India, 2016, 88(6): 725-735. DOI: 10.1007/s12594-016-0540-4.
[5] JONCZY I, GAWOR L. Coal mining and post-metallurgic dumping grounds and their connections with exploitation of raw materials in the region of RudaSlaska [J]. Archives of Mining Sciences, 2017, 62(2): 301-311. DOI: 10.1515/ amsc-2017-0023.
[6] NIU Fu-jun, CHENG Guo-dong, NI Wan-kui, JIN De-wu. Engineering-related slope failure in permafrost regions of the Qinghai-Tibet Plateau [J]. Cold Regions Science and Technology, 2005, 42(3): 215-225. DOI: 10.1016/j.cold regions. 2005.02.002.
[7] LI Guo-yu, YU Qi-hao, MA Wei, CHEN Zhao-yu, MU Yan-hu, GUO Lei, WANG Fei. Freeze-thaw properties and long-term thermal stability of the unprotected tower foundation soils in permafrost regions along the Qinghai-Tibet power transmission line [J]. Cold Regions Science and Technology, 2016, 121: 258-274. DOI: 10.1016/ j.coldregions.2015.05.004.
[8] VIKLANDER P. Permeability and volume changes in till due to cyclic freeze/thaw [J]. Canadian Geotechnical Journal, 1998, 35(3): 471-477. DOI: 10.1139/t98-015.
[9] QI Ji-lin, MA Wei, SONG Chun-xia. Influence of freeze-thaw on engineering properties of a silty soil [J]. Cold Regions Science and Technology, 2008, 53(3): 397-404. DOI: 10.1016/ j.coldregions.2007.05.010.
[10] HANSSON K, LUNDIN L C. Equifinality and sensitivity in freezing and thawing simulations of laboratory and in situ data [J]. Cold Regions Science and Technology, 2006, 44(1): 20-37. DOI: 10.1016/j.coldregions. 2005.06.004.
[11] GHAZAVI M, ROUSTAIE M. The influence of freeze-thaw cycles on the unconfined compressive strength of fiber-reinforced clay [J]. Cold Regions Science and Technology, 2010, 61(2, 3): 125-131. DOI: 10.1016/j.cold regions. 2009.12.005.
[12] KAMEI T, AHMED A, SHIBI T. Effect of freeze-thaw cycles on durability and strength of very soft clay soil stabilized with recycled bassanite [J]. Cold Regions Science and Technology, 2012, 82: 124-129. DOI: 10.1016/ j.coldregions.2012.05.016.
[13] WANG Da-yan, MA Wei, NIU Yong-hong, CHANG Xiao-xiao, WEN Zhi. Effects of cyclic freezing and thawing on mechanical properties of Qinghai-Tibet clay [J]. Cold Regions Science and Technology, 2007, 48(1): 34-43. DOI: 10.1016/j.coldregions.2006.09.008.
[14] LIU Jian-kun, CHANG Dan, YU Qian-mi. Influence of freeze-thaw cycles on mechanical properties of a silty sand [J]. Engineering Geology, 2016, 210(5): 23-32. DOI: 10.1016/j.enggeo. 2016.05.019.
[15] LU Yang, LIU Si-hong, ALONSO E, WANG Liu-jiang, XU Lei, LI Zhuo. Volume changes and mechanical degradation of a compacted expansive soil under freeze-thaw cycles [J]. Cold Regions Science and Technology, 2019, 157: 206-214. DOI: 10.1016/j.coldregions.2018.10.008.
[16] SIMONSEN E, JANOO V C, ISACSSON U. Resilient properties of unbound road materials during seasonal frost conditions [J]. Journal of Cold Regions Engineering, 2002, 16(1): 28-50. DOI: 10.1061/(ASCE)0887-381X(2002)16: 1(28).
[17] CHEN Yu-long, WEI Zuo-an, IRFAN M, XU Jia-jun, YANG Yong-hao. Laboratory investigation of the relationship between electrical resistivity and geotechnical properties of phosphate tailings [J]. Measurement, 2018, 126: 289-298. DOI: 10.1016/j.measurement.2018.05.095.
[18] GINGINE V, DIAS A S, CARDOSO R. Compaction control of clayey soils using electrical resistivity charts [J]. Procedia Engineering, 2016, 143: 803-810. DOI: 10.1016/j.proeng. 2016.06.130.
[19] SUDHA K, ISRAIL M, MITTAL S, RAI J. Soil characterization using electrical resistivity tomography and geotechnical investigations [J]. Journal of Applied Geophysics, 2009, 67(1): 74-79. DOI: 10.1016/j.jappgeo. 2008.09. 012.
[20] ZHANG Ding-wen, CHEN Lei, LIU Song-yu. Key parameters controlling electrical resistivity and strength of cement treated soils [J]. Journal of Central South University, 2012, 19 (10): 2991-2998. DOI: 10.1007/s11771-012- 1368-8.
[21] LI An-yuan, NIU Fu-jun, ZHENG Hao, AKAGAWA S, LIN Zhan-ju, LUO Jing. Experimental measurement and numerical simulation of frost heave in saturated coarse-grained soil [J]. Cold Regions Science and Technology, 2017, 137: 68-74. DOI: 10.1016/j.coldregions. 2017.02.008.
[22] SHI Wei-cheng, ZHU Jun-gao, ZHAO Zhong-hui, LIU Han-long. Strength and deformation behaviour of coarse-grained soil by true triaxial tests [J]. Journal of Central South University, 2010, 17(5): 1095-1102. DOI: 10.1007/s11771-010-0602-5.
[23] ZHANG Yu-zhi, MA Wei, WANG Tian-liang, CHENG Bo-yuan, WEN An. Characteristics of the liquid and vapor migration of coarse-grained soil in an open-system under constant-temperature freezing [J]. Cold Regions Science and Technology, 2019, 165: 102793. DOI: 10.1016/ j.coldregions.2019.102793.
[24] QU Yong-long, CHEN Guo-liang, NIU Fu-jun, NI Wan-kui, MU Yan-hu, LUO Jing. Effect of freeze-thaw cycles on uniaxial mechanical properties of cohesive coarse-grained soils [J]. Journal of Mountain Science, 2019, 16(9): 2159- 2170. DOI: 10.1007/s11629-019-5426-7.
[25] ZHANG Yu-zhi, MA Wei, ZHAO Wei-gang, WEN An, LI Pei, WANG Bao-xian. Water-heat-vapor migration trace and characteristics of unsaturated coarse-grained filling under freeze and thaw cycles [J]. Chinese Journal of Rock Mechanics and Engineering, 2019, 39(1): 156-165. DOI: 10.13722/j.cnki. jrme.2019.0499. (in Chinese)
[26] YAO Xiao-liang, FANG Li-li, QI Ji-lin, YU Fan. Study on mechanism of freeze-thaw cycles induced changes in soil strength using electrical resistivity and X-ray computed tomography [J]. Journal of Offshore Mechanics and Arctic Engineering, 2017, 139(2): 021501. DOI: 10.1115/ 1.4035244.
[27] KANG M, LEE J. Evaluation of the freezing�Cthawing effect in sand�Csilt mixtures using elastic waves and electrical resistivity [J]. Cold Regions Science and Technology, 2015, 113: 1-11. DOI: 10.1016/j.coldregions. 2015.02.004.
[28] Ministry of Water Resources of the People��s Republic of China (MWRPRC). SL237-1999, specification of soil test[S]. Beijing: China Water and Power Press, 1999. (in Chinese)
[29] ARCHIE G E. The electrical resistivity log as an aid in determining some reservoir characteristics [J]. Transactions of the AIME, 1942, 146: 54-62. DOI: 10.2118/942054-g.
[30] FENG De-cheng, LIN Bo, ZHANG Feng, FENG Xin. A review of freeze-thaw effects on soil geotechnical properties [J]. Scientia Sinica Technologica, 2017, 47: 111-127. DOI: 10.1360/N092016-00224. (in Chinese)
[31] HOTINEANU A, BOUASKER M, ALDAOOD A, AL-MUKHTAR M. Effect of freeze-thaw cycling on the mechanical properties of lime-stabilized expansive clays [J]. Cold Regions Science and Technology, 2015, 119: 151-157. DOI: 10.1016/j.coldregions.2015.08.008.
[32] GULLU H, KHUDIR A. Effect of freeze-thaw cycles on unconfined compressive strength of fine-grained soil treated with jute fiber, steel fiber and lime [J]. Cold Regions Science and Technology, 2014, 106-107: 55-65. DOI: 10.1016/ j.coldregions.2014.06.008.
[33] LIU Chun, SHI Bin, ZHOU Jian, TANG Chao-sheng. Quantification and characterization of micro porosity by image processing, geometric measurement and statistical methods: application on SEM images of clay materials [J]. Applied Clay Science, 2011, 54(1): 97-106. DOI: 10.1016/ j.clay.2011.07.022.
[34] SEZER G I, RAMYAR K, KARASU B, GOKTEPE A. B, SEZER A. Image analysis of sulfate attack on hardened cement paste [J]. Materials & Design, 2008, 29(1): 224-231. DOI: 10.1016/j.matdes.2006.12.006.
[35] WAXMAN M H, SMITS L J M. Electrical conductivities in oil-Bearing shaly sands [J]. Society of Petroleum Engineers Journal, 1968, 8(2): 107-122. DOI: 10.2118/1863-A.
(Edited by ZHENG Yu-tong)
���ĵ���
����ѭ�������¸ߺ���������������ѧ�͵�ѧ����
ժҪ��Ϊ���۶���Ӱ���¸ߺ������������Ĺ������ԣ��Բ�ͬ���ܶ�(��d=1.90 g/cm3��2.00 g/cm3��2.15 g/cm3)����ͬ��ˮ��(w=9.0%��11.5%��14.0%)�Ĵ������ڲ�ͬ����ѭ��(C=0~20��)�µ�ѧ�͵�����ѧ���Խ��������о������������ѭ�����������£����ܶȡ��ߺ�ˮ(��d=1.9 g/cm3��w=14.0%)������Ӧ��-Ӧ���ϵ��Ӧ��Ӳ�������������ɡ����Ŷ���ѭ�����������ӣ������ĵ�����(��)���������ƣ���������ѧ����(���Όѹǿ��qu������ģ��E)�ʹ���ָ��(IB)������˥������7~9��ѭ���������ȶ������⣬����ѭ����������Ӱ�컹�ܸ��ܶȺͺ�ˮ�ʵĽ������á�����ͼ����������˶��������´������ļ����ƻ��Ϳ�϶�ṹ��������������Archieģ�͵Ļ����ϣ�����˿��Ƕ���Ӱ��ķDZ��ͺ�ճ���������ĵ�����ģ��������������ѧ���ԵĶ���ЧӦ��������˶��ڴ������ĵ��Όѹǿ�ȡ�����ģ���͵����ʵĹ�ϵ���Ի�������ĵ����ʷ����۶��ڴ�������ѧ���Ծ�����Ҫ���塣
�ؼ��ʣ�������������ѭ�������Όѹǿ�ȣ������ʣ�������ģ��
Foundation item: Project(2016ZGHJ/XZHTL-YQSC-26) supported by the Key Scientific Research Project of China Gold Group; Project(SQ2019QZKK2806) supported by the Second Tibetan Plateau Scientific Expedition and Research (STEP) Program, China; Project(300102268716) supported by the Fundamental Research Funds for the Central Universities, China; Project(LHKA-G201701) supported by the Science and Technology Project of Yalong River Hydropower Development Company, China
Received date: 2019-11-14; Accepted date: 2020-02-24
Corresponding author: MU Yan-hu, PhD, Associate Professor; Tel: +86-13919372173; E-mail: muyanhu@lzb.ac.cn; ORCID: 0000- 0001-6553-1126

