
Fatigue behaviour of pre-strain 7B04-T7451 aluminum alloy
JIANG Feng(姜锋)1, JIAN Hai-gen(蹇海根)1, YIN Zhi-min(尹志民)1, HE Zhen-bo(何振波)2
1. School of Materials Science and Engineering, Central South University, Changsha 410083, China;
2. Northeast Light Alloy Co Ltd, Harbin 150060, China
Received 15 July 2007; accepted 10 September 2007
Abstract: The effect of minimum and the maximum stresses on the fatigue behaviour of a 30 mm thick plate of a 7B04-T7451 (Al-Zn-Mg-Cu) subjected to a tensile pre-strain level of 2% was investigated, including the fatigue crack growth (FCG) rate, microstructure observation, fractographic examination and fatigue S-N curve, etc. The results show that the characteristics of fatigue facture can be observed obviously under high cycle fatigue condition, and the higher the stress amplitude, the wider the space between fatigue striations, the faster the rate of fatigue crack developing and going into the intermittent fracture and the greater the ratio of the intermittent fracture area to the whole fracture area.
Key words: 7B04-T7451 aluminum alloy; high cycle fatigue; fatigue crack growth rate; endurance limit
1 Introduction
The 7ххх series of Al alloys have been widely used in structural engineering and aeronautical industries due to their good mechanical properties and low densities[1-5]. A new 7××× alloy named 7B04 developed in China, which is equivalent to the 7075 alloy developed in the American and В95 alloy developed in Russia, derives from long-used 7A04 alloy by decreasing the content of impurities such as iron and silicon[6-8].
Al-Zn-Mg alloys (7×××), among which 7075 is the most widely used, in the conventional peak-aged temper (T6), have the highest strength by far. The need for high strength coupled with good fatigue performance and stress corrosion cracking SCC resistance leads to the development of 7B04 alloy, going with the improvements in thermomechanical and heat treatment practices. A considerable reduction in the levels of iron, silicon, and manganese, and the over-aged temper (T7) improve the fatigue performance and SCC resistance. However, this results in loss of strength compared with the T6 temper[9-11].
In some cases, 7B04-T7451 is used after application of 2% pre-strain during mass production in factory. Regarding the influence of pre-strain on FCG behavior, few works[12-13] have been published. A large number of researches on the composition, microstructure and mechanical properties of the 7B04 aluminum alloy have been reported already[14-15]. However, till now the fatigue property of 7B04-T7451 aluminum alloy thick plate has not been studied adequately yet. In this work, the fatigue and fracture characteristics of aluminum alloy 7B04-T7451 with thickness of 30 mm were investigated in order to provide available experiment data for the engineering application of this alloy plate.
2 Experimental
Aluminum alloy plate of 7B04-T7451 provided by the Northeast Light Alloy Co Ltd with a thickness of 30 mm was used in this study. The chemical composition is shown in Table 1.
This plate received was under the T7451 condition, that is, solution treated (470 ℃, 60 min) after high temperature soaking to achieve a nearly homogeneous solid solution, then rapidly cooled to prevent precipitation of the solved phases, stress relieved by stretching for 2% and two stages (115 ℃, 8 h+165 ℃, 16 h) to obtain the desired precipitation hardening.
The fatigue behavior of the as-received 7B04-T7451 alloy in the L-T orientation was investigated, the fatigue crack developing rate tests,conforming to specifications in GB/T6398-2000, were performed on the MTS 810 -50 kN machine at a constant cyclic frequency of 10 Hz, stress ratio (R=σmin/σmax) of 0.1 and maximum load of 10 kN, and the stress axes of the specimens were perpendicular to the rolling direction. The stress fatigue samples at the gage section were measured 64 mm in length and 22 mm in diameter. 3-4 samples were prepared for each testing point. The stress fatigue tests, conforming to specifications in HB5287-96, were performed on the JXG-100 machine at different stress amplitudes of 275, 285, 295, 305, 320, 320, 330, 360, 400 and 430 MPa, respectively, a stress ratio of 0.1, stress concentration factor Kt of 1 and sine loading mode, and the stress axes of the specimens were parallel to the rolling direction.
Table 1 Chemical composition of 7B04 aluminum alloy plate

The un-broken specimen (the stress amplitudes was 285 MPa) and the broken specimen (the stress amplitude were 285 MPa and 400 MPa) were examined by optical microscopy, X-Ray diffractometry (XRD), scanning electron microscopy (SEM), and the phases contributed to the failure process were identified by energy dispersive spectrometry (EDS).
3 Results and discussion
3.1 Phase structure of alloys
As shown in Fig.1 the microstructure of the alloy consists of partial recrystallised grains elongated in the rolling direction and unrecrystallised regions.

Fig.1 Optical micrograph of un-broken plate in longitudinal direction of 7B04-T7451 alloy
In Figs.2(a) and (b), the higher magnification SEM images reveal that critical deformation caused by stress amplitude, coarse recrystallised grains and some relatively large particles. In Figs.2(c) and (d), the energy dispersive spectrometry reveals that most of them are some composite phases consist of aluminum, copper, silicon, iron and manganese, although differences in the contents of these elements were found in the various particles[16]. Moreover, some other particles formed by aluminum-chromium or aluminum- manganese are observed by XRD. The XRD diffraction graph of the plate was composed of α(Al), Mg2Zn, Al13Cr2, Al6Mn, Al86Cr14 and a spot of other diffraction peaks (Fig.3); detection of the finest particles will probably require the use of transmission electron microscope (TEM).
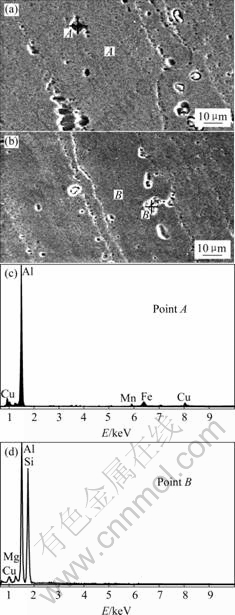
Fig.2 SEM images ((a), (b)) and energy dispersive spectrometry analysis ((c), (d)) of un-broken plate in longitudinal direction of 7B04-T7451
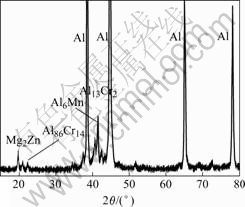
Fig.3 XRD pattern of 7B04-T7451 aluminum alloy plate
3.2 S―N curve of studied alloy
The stress amplitude-number of cycles to failure (S―N) curve of the studied alloy is shown in Fig.4.

Fig.4 Graph of maximum stress versus number of cycles to failure
The graph of the maximum stress number of cycles shows that the endurance limit does not occur in Fig.4, and the values of fatigue life are a little scattered under the same stress condition. For instance, the mean fatigue life of the alloy is about 4.693×10⁶ (broken) under the stress amplitude of 285 MPa, but the best one is more than 1.00×10⁷ (un-broken).
As expected, under the same mean stress, an increase in the stress amplitude leads to a decrease in the fatigue life. For example, the fatigue life of the studied alloy is 1.0×10⁷ under the stress amplitude of 275 MPa, and it is about 5.4×10⁴ under the stress amplitude of 430 MPa.
3.3 Fatigue crack developing rate of studied alloy
The relationship between fatigue crack growth rates and difference between the stress intensity factors (ΔK) of 7B04-T7451 aluminum alloy 30-mm-thick plate are shown in Fig.5. The result shows that the curves of fatigue crack growth rates can be divided into three regions obviously, and each region corresponds to a stage of fatigue respectively, including crack initiation, slow stable crack growth and rapid fracture. The intersecting point between elongation line of curve in Region Ⅰ and abscissa axis indicates the threshold value of fatigue crack, which is 5.5 MPa?m1/2 approximately. When ΔK reaches (13-14)MPa?m1/2, the fatigue crack develops into the second stage, and the rate of crack growth changes roughly linearly with the change in stress intensity fluctuation. The low rate of slope means that the step of crack propagation increases slowly with the increase of ΔK. When ΔK reaches 29 MPa?m1/2, the fatigue crack develops into the third stage. It can be known from the curves in Region Ⅲ that the rate of crack growth changes roughly linearly also, but the rate of slope is greater than that of Region Ⅱ. So the fatigue crack develops into the third stage, and small increase in the stress intensity amplitude leads to relatively large increase in crack growth rate since the material approaches the unstable fracture.
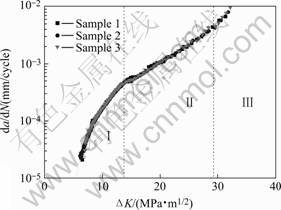
Fig.5 Curves of fatigue crack growth rate for samples
The Paris formula[17](as shown in equation 1) was used to analyze the results of fatigue crack developing rate.
da/dN=C(ΔK)m (1)
where N is the number of the fatigue cycle, C and m are material constants, and ΔK is the stress intensity factor range which is used to study the fatigue behaviors of cracked aluminum specimens. The results indicate that, the fatigue crack developing rate at the initiation stage is not much different from that at slow stable crack growth stage. But when the crack develops into the rapid fracture stage, the rate increases suddenly.
3.4 Fractographs of studied alloy under different stress conditions
The typical fractographs of the alloy under typical stress conditions are shown in Fig.6.
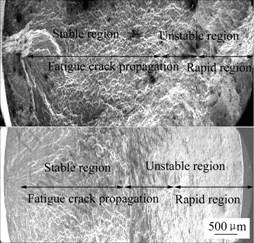
Fig.6 Fractographs of fatigue fracture samples at different stress amplitudes: (a) 285 MPa; (b) 400 MPa
It is shown that the fracture surfaces consist of three distinct regions, i.e. crack initiation region, fatigue crack propagation region and rapid fracture region. Nevertheless, the ductile striations in fatigue crack propagation region are the dominant features. In some zones the presence of large particles can be observed under the two stress amplitude conditions. These particles have a negative effect on the fatigue performance, accelerating the failure process, as their decohesion to the surround matrix generates microvoids that facilitate the crack propagation. The radial stripe near the crack initiation region is very obvious, and then when the crack propagation becomes faster the stripe is gradually faint, and finally the morphology characteristic of rapid fracture appears[18], the rapid fracture is obvious shear lip that looks dimmer than the fatigue crack propagation region. These are due to that the crack tip opening angle becomes larger with the length enlargement of crack, therefore ΔK increases under the similar stress amplitude condition, which leads to the increase of fatigue crack growth rate. The area of fatigue crack propagation region under lower stress amplitude is larger than the higher one, while the area of rapid fracture region is smaller (Figs.6(a) and (b)). For example, at stress amplitude of 285 MPa, the regions of unstable fatigue crack propagation and rapid fracture account for only 1/3 of the whole fracture surface, while 1/2 under the 400 MPa stress amplitude condition.
In Fig.7, the higher magnification SEM image reveals that the fatigue crack propagation regions are mostly covered by striations. This shows that the higher the level of stress amplitude is, the wider the separation of fatigue striations, which is coincident with the above results of the corresponding fatigue life tests.
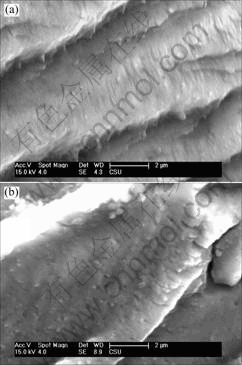
Fig.7 Fractographs of fatigue fracture samples at different stress amplitudes by high magnification: (a) 285 MPa; (b) 400 MPa
4 Conclusions
1) Large particles observed are probably some composite phases, and consist of aluminum, copper, silicon, iron and manganese which have a negative effect on the fatigue performance, accelerating the failure process.
2) The fracture surfaces consist of three distinct regions: crack initiation region, fatigue crack propagation region and rapid fracture region. The ductile striations in fatigue crack propagation region are the dominant features.
3) The endurance limit of the 7B04-T7451 alloy plate is not observed, the values of fatigue life are a little scattered under the same stress condition, and the higher the stress amplitude, the lower the fatigue life of the studied alloy.
4) At high cycle fatigue condition, the higher the stress amplitude, the wider the space between fatigue striations, the faster the rate of fatigue crack developing and going into the intermittent fracture area, and the larger the ratio of the intermittent fracture area to the whole fracture area.
References
[1] GAN Wen-ping, FAN Hong-tao, Xu Ke-qin, ZHOU Zhao-feng. Study progress of Al-Zn-Mg-Cu series high-strength aluminum alloys[J]. Aluminum Fabrication, 2003, 23(150): 6-12. (in Chinese)
[2] LUNMLEY R N, POLMEAR I J. The effect of long term creep exposure on the microstructure and properties of an underaged Al-Cu-Mg-Ag alloy[J]. Scripta Materialia, 2004, 50: 1227-1231.
[3] ENGDAH I T, HANSEN V, WARREN P J. Investigation of fine precipitates in Al-Zn-Mg alloys after various heat treatments[J]. Mater Sci Eng, 2002, A327: 59-64.
[4] HEINZ A, HASZLER A, KEIDEL C, MOLDENHAUER S, BENEDICTUS R, MILLER WS. Recent development in aluminum alloys for aerospace applications[J]. Meter Sci Eng A, 2000, 280(1): 102-107.
[5] WILLIAMS J C, STARKE J E. Progress in structural materials for aerospace systems[J]. Acta Mater, 2003, 51(19): 5775-5799.
[6] JIAN Hai-gen, JIANG Feng, XU Zhong-yan, et al. Study progress of high strength and tenacity Al-Zn-Mg-Cu aluminum alloy for aviation[J]. Hot Working Technology, 2006, 6: 66-71. (in Chinese)
[7] RU Ji-gang, YI Lin-na. Effect of different ageing treatment on corrosion properties of 7B04 alloy[J]. Light Alloy Fabrication Technology, 2004, 32(6): 45-47. (in Chinese)
[8] NING Ai-lin, ZENG Su-min. Effects of ageing system on microstructure and mechanical properties of 7B04 aluminum alloy[J]. The Chinese Journal of Nonferrous Metals, 2004, 14(6): 922-926. (in Chinese)
[9] WALLACE W, HOEPPNER DW, KANDACHAR PV. Aircraft corrosion: causes and case histories[J]. Agard A G, 1985, 278(1): 762-767.
[10] KOCH G H. Stress-corrosion cracking and hydrogen embrittlement. In: Fatigue and fracture[M]. ASM Handbook, 1996, 19: 483-506.
[11] LIFKA B W. SCC resistant aluminum alloy 7075-T73 performance in various environments[J]. Aluminum, 1977, 53(12): 750-752.
[12] RADHAKRISHNAN V M, BABURAMANI P S. An investigation of the effect of pre-straining on fatigue crack growth[J]. Mater Sci Eng, 1975, 17(2): 283-288.
[13] SCHIJVE J. The effect of pre-strain on fatigue crack growth and crack closure[J]. Eng Fract Mech, 1976, 8(4): 575-581.
[14] PENG Shu-zhong. Study on solution-ageing heat treatment process for high strength 7B04 aluminum alloy[J]. Aluminum Fabrication, 2004, 156(3): 49-54. (in Chinese)
[15] NING Ai-lin, ZENG Su-min. The effects of solution treatment on microstructure and mechanical properties of high-purity and high-strength aluminum[J]. Heat Treatment of Metals, 2004, 29(4): 13-16. (in Chinese)
[16] WILSON R N, PARTRIDGE P G. The nucleation and growth of precipitates in an aluminium 22.5% copper 21.2% magnesium alloy[J]. Acta Metallurgica, 1965, 13: 1321.
[17] CHU Wu-yang. Fracture toughness testing[M]. Beijing: Science Press, 1979: 68-69. (in Chinese)
[18] WU Lian-sheng, LIU Zheng-yi. Machinery and equipment failure analysis atlas[M]. Guangzhou: Guangdong Science and Technology Press, 1990, 10: 219. (in Chinese)
Foundation item: Project (2005DFA50550) supported by the Key International Science and Technology Cooperation Project of China
Corresponding author: JIANG Feng; Tel: +86-13787009528; E-mail: jfeng2@mail.csu.edu.cn
(Edited by CHEN Wei-ping)

