铁在冶金级硅低速定向凝固过程中的再分布
来源期刊:中国有色金属学报(英文版)2016年第3期
论文作者:甘传海 方明 张磊 邱实 李锦堂 姜大川 温书涛 谭毅 罗学涛
文章页码:859 - 864
关键词:定向凝固;冶金级硅;再分布;铁;晶界
Key words:directional solidification; metallurgical-grade silicon; redistribution; iron; grain boundary
摘 要:研究冶金级硅低速定向凝固过程中杂质铁的再分布。采用ICP-MS检测铁的浓度,绘制铁在固相、液相、晶界和晶体生长方向上的浓度示意图。铁浓度在固、液相中具有明显差异。依据质量守恒定理,计算得出溶质边界层约为4 mm,铁的有效分凝系数约为2.98×10⁻⁴。在低速凝固条件下,铁容易偏析聚集在晶界。在生长方向上,由于低速凝固,铁浓度在硅锭86%高度以下几乎恒定,不完全符合Scheil方程规律。讨论了对流对铁再分布的影响,对流“死区”对铁再分布具有重要影响。
Abstract: Redistribution of iron during directional solidification of metallurgical-grade silicon (MG-Si) was conducted at low growth rate. Concentrations of iron were examined by ICP-MS and figured in solid and liquid phases, at grain boundary and in growth direction. Concentrations are significantly different between solid and liquid phases. The thickness of the solute boundary layer is about 4 mm verified by mass balance law, and the effective distribution coefficient is 2.98×10⁻⁴. Iron element easily segregates at grain boundary at low growth rate. In growth direction, concentrations are almost constant until 86% ingot height, and they do not meet the Scheil equation completely, which is caused by the low growth rate. The effect of convection on the redistribution of iron was discussed in detail. Especially, the “dead zone” of convection plays an important role in the iron redistribution.
Trans. Nonferrous Met. Soc. China 26(2016) 859-864
Chuan-hai GAN1 , Ming FANG2,3, Lei ZHANG1,3, Shi QIU1, Jin-tang LI1, Da-chuan JIANG2,3, Shu-tao WEN2, Yi TAN2,3, Xue-tao LUO1
1. Fujian Key Laboratory of Advanced Materials, College of Materials, Xiamen University, Xiamen 361005, China;
2. School of Materials Science and Engineering, Dalian University of Technology, Dalian 116023, China;
3. Qingdao Longsun Silicon Technology Company Ltd., Qingdao 266200, China
Received 9 March 2015; accepted 6 January 2016
Abstract: Redistribution of iron during directional solidification of metallurgical-grade silicon (MG-Si) was conducted at low growth rate. Concentrations of iron were examined by ICP-MS and figured in solid and liquid phases, at grain boundary and in growth direction. Concentrations are significantly different between solid and liquid phases. The thickness of the solute boundary layer is about 4 mm verified by mass balance law, and the effective distribution coefficient is 2.98×10⁻⁴. Iron element easily segregates at grain boundary at low growth rate. In growth direction, concentrations are almost constant until 86% ingot height, and they do not meet the Scheil equation completely, which is caused by the low growth rate. The effect of convection on the redistribution of iron was discussed in detail. Especially, the “dead zone” of convection plays an important role in the iron redistribution.
Key words: directional solidification; metallurgical-grade silicon; redistribution; iron; grain boundary
1 Introduction
In order to meet the remarkable development of photovoltaic industry, cost-effective ways to manufacture multi-crystalline silicon must be applied. Because of the high purification requirement of solar cells, silicon refining is meaningful and important [1]. Nowadays, besides the chemical method, series of metallurgical techniques are applied. Directional solidification and zone melting are effective to remove metallic impurities [2,3]; slag refining and alloy solvent refining are effective to separate boron from silicon [4,5]; vacuum melting and electron beam melting do good jobs in removing phosphorus, aluminum and calcium [6,7]; nonmetals can also be removed by oxidation or electro-refining [8,9]. Whereas, some methods for purifying silicon are high cost.
Metallic impurities, especially transition metals, are detrimental to solar cells for they act as recombination center of the minority carrier [10]. What is worse, solar cells with the same total impurity contents can have widely different minority lifetime based on the impurities distribution [11]. Many literatures reported the redistribution of metallic impurities during directional solidification of MG-Si. YUGE et al [12] removed metallic impurities from molten silicon with electron beam heating, and the feedstock was supplied continuously at a constant mass to water cooled copper mold and solidified gradually in a directional manner. MARTORANO et al [2] studied the influence of solidification velocity on impurities segregation in directionally solidified silicon with vertical Bridgman furnace. TAN et al [13] researched the removal of aluminum and calcium in multi-crystalline silicon by vacuum induction melting and directional solidification, considering the influence of evaporation and segregation on impurities removal. AUTRUFFE et al [14] investigated the impact of growth rate on impurities segregation at grain boundaries. The results showed, for fast diffusion element, that the concentration difference of impurity between grain and grain boundary is obvious.
Iron is a representative impurity in multi-crystalline silicon, which is difficult to be removed. However, most of literatures only discussed the redistribution of average concentration along the growth direction. In the present work, we comprehensively investigate the redistribution of iron. Not only concentrations along growth directional are discussed, but also concentration difference between solid and liquid is compared. What is more, concentrations at grain boundary are investigated in detail by a relatively convenient method. The thickness of effective solute boundary layer is estimated, and the effect of natural convection on the iron redistribution is discussed.
2 Experimental
The configuration of a multi-heater directional solidification furnace (JS-450) is shown in Fig. 1. Quartz crucible was painted by Si3N4 coatings to prevent impurities from the crucible, with the outer sizes of 830 mm × 830 mm × 450 mm and the wall thickness of 20 mm. The crucible was supported by graphite blocks. At the top of crucible, a carbon fiber plate was fixed to protect silicon from contaminating by the thermal decomposition of graphite resistance heaters. Argon gas was imported through a graphite tube into the furnace to protect the silicon from being oxidized at high temperature. Thermocouple 1 (TC1) was installed near the surface of top heaters to measure the furnace chamber temperature, and thermocouple 2 (TC2) was installed through the directional solidification block to measure the temperature at the crucible bottom. A quartz rod was inserted from the furnace top into the crucible to detect the crystal growth rate during solidification. The furnace chamber pressure was maintained at about 6×10⁴Pa by adjusting the import and export of argon flow. The furnace wall was cooled by water and it was considered as a constant temperature boundary. Thermal field was controlled by two ways: 1) controlling the power of graphite resistance heaters; 2) adjusting the insulation cage upward or downward.
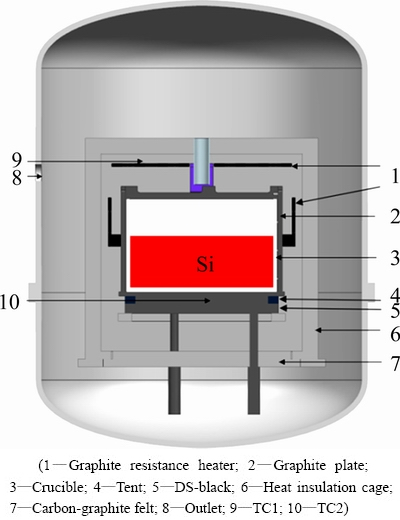
Fig. 1 Schematic configuration of directional solidification furnace
410 kg MG-Si was used to be conducted. Original average concentration of iron in feedstock was 657.94×10⁻⁶. The feedstock was loaded into the crucible and melted. During melting, insulation cage was closed entirely. The furnace chamber temperature was about 1823 K after 415 min. Temperature then decreased gradually to 1698 K. After this step, the furnace chamber temperature was controlled appropriately by a combination of resistance heaters and the insulation cage, and solidification was initiated. Finally, the temperatures at the top and bottom of the furnace chamber were about 1690 and 1267 K, respectively. Meanwhile, solidification ended. After annealing, the furnace was directly cooled to ambient temperature.
The growth rate was 2.67 μm/s. The ingot was cut into two halves symmetrically along the growth direction. The sketch map is shown in Fig. 2(a). Samples were taken out along red sample lines to be examined. Sample taken from sample line 2 represents concentration profile in the center of ingot, while sample taken from sample line 1 represents concentration profile away from the center. Near the sample line 2, a block was taken out as shown in Fig. 2(b). At 24% ingot height, a cubic sample, 1 cm3, was selected as shown in Fig. 2(c). This sample represents average concentration including inner-grain and grain boundary; near the cubic sample, the block was crashed and grain boundary was exposed in laminate or powder. Concentration in the laminate or powder sample closes to that at grain boundary. Then, the laminate or powder was taken out as shown in Fig. 2(d). All samples were detected by inductively couple plasma mass spectrometry (ICP-MS, Thermo Fisher, ICAP QC).
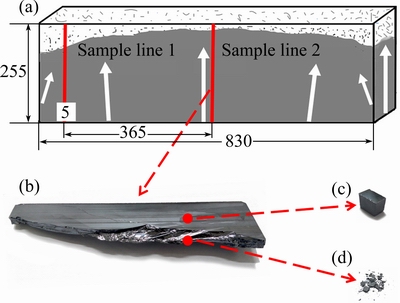
Fig. 2 Sketch map of ingot (Crystal growth directions are marked with white arrows and sample lines are marked by red lines) (a), block of ingot taken out (b), cubic sample taken out at 24% height of block (c) and laminate or powder taken out near cubic sample (d)
Compared with the secondary ion mass spectrometer (SIMS) method, this is a relatively convenient method.
3 Results and discussion
3.1 Redistribution of iron between solid and liquid phases during directional solidification
Impurities in silicon segregate from solid phase into liquid phase, which is caused by the chemical potential difference between solid and liquid phases. The impurities redistribution in the present experiment is unlikely to get an equilibrium state. Namely, it is in non-equilibrium state. Actual mixability of liquid silicon is characterized by effective distribution coefficient (Ke) [15], which is defined in the following equation:
 (1)
(1)
where K0, υ, δ and D are the equilibrium state distribution coefficient, the growth rate, the thickness of the solute boundary layer and the diffusion coefficient, respectively. δ is estimated as 4 mm [2]. The average crystal growth rate is 2.67 μm/s, which is regarded as low growth rate [16]. K0=8×10⁻⁶ [17], D=2.95×10⁻⁹ m2/s [18]. Only interaction between iron and silicon atom is assumed to exist. Relevant data above are substituted into Eq. (1), and Ke is obtained about 2.98×10⁻⁴. It is significantly larger than K0 with two orders of magnitude.
At the height of 5 mm (2% ingot height), a cubic sample was taken out from sample line 1 as shown in Fig. 2(a), and its concentration of iron is 0.21×10⁻⁶. As we know, effective distribution coefficient also equals the ratio of solid concentration (wS) to liquid concentration (wL) in the following equation:
 (2)
(2)
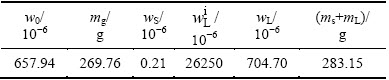
Therefore, wL is obtained about 704.70×10⁻⁶. According to the solid fraction, the liquid fraction, the 410 kg feedstock, concentration of solid and liquid phases and original concentration, the total mass of iron in solid (mS) and liquid (mL) phases is 283.15 g. The original mass (m0) in the feedstock is 269.76 g (it is calculated by original concentration and total mass in the feedstock). The two values shown in Table 1 are close, but not equal completely. However, regardless of the error, it still can be regarded as in accordance with mass balance law. This suggests that the parameters, such as thickness of the solute boundary layer we set and effective distribution coefficient, are appropriate and meaningful. Due to the large concentration difference between solid/liquid interface and molten bulk, impurities diffusion across the interface is relatively fast. The concentration at the interface meets the local equilibrium state soon [19]. Since solid concentration of iron at the interface  is 0.21×10⁻⁶, the liquid concentration of iron at the interface
  is 26250×10-6 calculated by equilibrium distribution coefficient. The results are listed in Table 1. Similar to the procedure discussed above, as crystal grows, iron is segregated from solid phase into liquid phase sequentially.
Table 1 Concentration and mass of iron at 2% ingot height
3.2 Effect of convection on segregation of iron at solid/liquid interface
Thermal field in the furnace is non-uniform for the special arrangement of multi-heater as shown in Fig. 1, causing density difference in the liquid. Consequently, natural convection occurs [20]. Convection enhances the impurities segregation. Segregation at solid-liquid interface consists of three regimes: initial transient, steady state and final transient [21]. However, the steady state may be not held. Peclet number can be used to tell whether convection has an influence on segregation or not. Peclet number Pe is defined in the following equation:
 (3)
(3)
When Pe 1, the effect of convection on segregation can be ignored; while Pe
 1, the influence of convection is effective and liquid mixes completely [21]. According to Eq. (3), Pe is about 2.71, and it is not far larger than 1. This means that the effect of convection on segregation cannot be ignored, but the effect is not obvious.
Liquid silicon is assumed to be Newtonian fluid, and furnace is assumed to be axially-symmetric. According to the Navier-Stokes equation:
 (4)
(4)
where ρ, v, t, p, μ and g are the liquid density of liquid silicon, the transportation velocity vector, the time, the acting force vector, the viscosity and the gravitational acceleration, respectively. Equation (4) is solved by software PROCAST. Then, numerical simulations of the convection at one moment during the solidification are shown in Fig. 3, from the perspective of three-dimension and two-dimension. From Fig. 3(b), we can find that the solid/liquid interface is convex. Convection flows anticlockwise at left half side and clockwise at the right half side. Solute boundary layer is created for the fluid flows across the solid/liquid interface, and there exists concentration gradient in the solute boundary layer. Here, mass transports only by diffusion [21]. Iron in the solute boundary layer is taken away from the interface, moving the upper liquid, then downward the crucible wall. Some iron stays at the periphery of liquid, and the rest is taken away along the boundary layer again, in the wake of convection. Therefore, iron segregates more adequately. In some cases, a crystal tip exists and breaks through the solute boundary layer. However, according to the Gibbs-Thomson theory [22], for the higher curvature holds higher temperature, the tip will be melted again. What is more, convection can wash the crystal tip, and segregation is enhanced.
The thermal field is variable, giving rise to asymmetric convection. Figure 3(b) indicates that the left convection is stronger than the right one at the moment. While it is possible that the right one is stronger than the left one next moment. This heterogeneous convection is also likely to erode the solute boundary layer, and iron is carried off and melted. From Figs. 3(a) and (b), we can see that convection in the center is weaker than that on the edge. The similar phenomenon is noticed by TREAMPA et al [23]. And they call it “dead zone”. This makes the concentration in the center higher than that on the edge for the lack of convection. However, it may be not obvious for concentration of sole impurity, for example, iron.
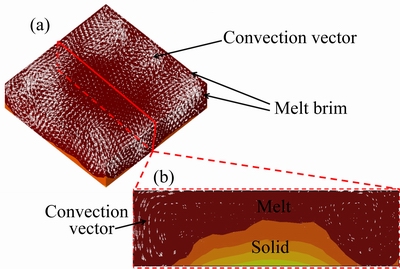
Fig. 3 Schematic of melt convection in view of three- dimensional space (a) and melt convection of cross-section of in view of two-dimensional space (b)
3.3 Concentration of iron at grain boundary
In order to clearly observe the morphology, the block was corroded with NaOH solution. Figure 4(a) shows a block with dimensions about 230 mm × 10 mm × 255 mm, longitudinally cut from the left side of silicon ingot. Columnar grains are thick, and some grains are almost straight. The diameter of some grains is even larger than 20 mm. Crystal growth direction is marked with white arrows, and white curve is the boundary between columnar grain and random grain. Figure 4(b) shows that the crystalline morphology is chaotic.
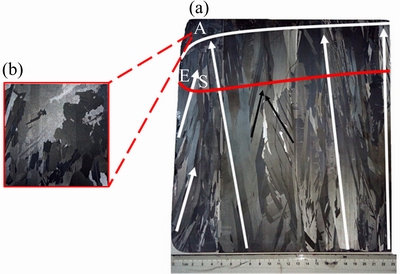
Fig. 4 Macro-morphology of block with dimensions of 230 mm × 10 mm × 255 mm (a) and enlarged image (b) of (a)
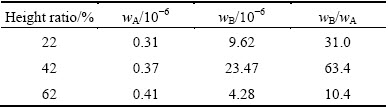
When the crystal grows, iron is rejected from solid phase into liquid phase. Although grains may be broken halfway for the variable interface, impurities segregate sequentially for convection. When two grains encounter as marked by the black arrows in Fig. 4(a), only the grain in preferred orientation is preserved [24]. The preserved grain pushes iron forward continuously, but there still exists residue at grain boundary. The average concentration of cubic sample (wA) and approximate grain boundary concentration of laminate or powder sample (wB) are shown in Table 2. wA tends to represent average concentration of iron including inner-grain and grain boundary, and wB tends to represent the concentration of iron at grain boundary. Table 2 shows that wA is less than wB. The maximum solid solubility of iron is 2×10⁻⁶ in solid silicon at 1600 K [25], and wB is larger than it. AUTRUFFE et al [14] added copper into silicon and analyzed it by secondary ion mass spectroscopy (SIMS) method, and they observed that the concentration of copper at grain boundary was much larger than that in inner-grain. They concluded that it was caused by the solid state diffusion after solidification. After solidification, temperature continuously decreases by furnace cooling, until room temperature. Iron atom is fast diffusion element and it diffuses by interstitial route [11], and in the present experiment, iron has enough time to diffuse at low crystal growth rate. Iron is rejected easily at grain boundary. Therefore, the iron concentrated at grain boundary is not mainly caused by solid state diffusion after solidification, but grain-boundary segregation during solidification. This suggests that concentrations of iron in the ingot are much heterogeneous at low growth rate. However, if the temperature gradient in the liquid is large enough or the crystal growth rate is higher, iron cannot be easily segregated from inner-grain into grain boundary [26]. Because the method we used to select sample is relatively rough, the true concentration at the grain boundary is much larger than that we detected. If the sample is closer to the grain boundary, the value is more precise. Compared with the SIMS detection method, this method we used is relatively convenient, and concentration difference between inner-grain and grain boundary is successfully analyzed.
Table 2 Concentration of iron in cubic sample and laminate or powder sample
3.4 Redistribution of iron in growth direction
Sampling locations are selected purposefully in sample lines 1 and 2, respectively, and the concentration profiles are shown in Fig. 5. It indicates that the concentration is almost constant from bottom to 86% ingot height for sample line 1 and to 90% for the sample line 2. The solid solubility of iron in silicon at melting temperature is about 0.5×10⁻⁶ [25]. Therefore, under 86% ingot height, average concentration of iron is less than the solid solubility. Under 86% ingot height, average concentrations of iron are 0.29×10⁻⁶ and 0.32×10⁻⁶ for sample lines 1 and 2, respectively. The detection error is 0.001×10⁻⁶ which suggests that the average concentration of iron in sample line 2 is larger than that in sample line 1, which may be caused by the “dead zone” of convection as discussed in Section 3.2.
However, from 86% ingot height to the top, concentration of iron in sample line 1 is larger than that in sample line 2. The solidifying interface denoted by the red curve is convex as shown in Fig. 4(a), and the periphery “E” and “S” are caused by lateral heat loss. Because of the convex interface, at the upper ingot, liquid silicon (including iron) is pushed from the center into the edge. Therefore, the concentration of iron at the periphery is larger than that in the center at the top of ingot.
Comparing the concentration of iron in sample lines 1 and 2 with Scheil equation in the following equation:
wS=w0Ke(1-fs)exp(Ke-1) (5)
We can find that under 50% ingot height, concentration of iron in sample line 1 is less than the corresponding value of Scheil equation in Fig. 5, but concentration of iron in sample line 2 is larger than the corresponding value of Scheil equation. From 50% to 86% ingot height, the values of Scheil equation are larger than those in sample lines 1 and 2. While from 86% to near 100% ingot height, concentrations in Scheil equation are less than that in sample line 1. What is more, according to the Scheil equation, concentrations increase gradually in growth direction and enrich sharply at the top. However, the experimental results are not in accordance with the Scheil equation completely. No matter for sample line 1 or sample line 2, concentrations of iron are almost constant under 86% ingot height. MARTORANO et al [16] observed similar result when the growth rate was low. They held the opinion that at low growth rate, diffusion time was sufficient, impurities transport to the top became more efficient with convection. In consequence, concentrations kept low and constant. Only when the accumulation of iron is enough, solid concentration of iron begins to increase. At the higher solidified fraction, thermal field is not large enough to segregate iron upward. Thus, concentration in sample line 1 is larger than the corresponding value of Scheil equation. Removal rate (R) of iron is defined as
 (6)
(6)
Compared the original concentration (w0=657.94×10⁻⁶) with average solid concentration (wS) of 0.31×10⁻⁶ in sample lines 1 and 2 (under 86% ingot height), the average removal rate is about 99.95%.
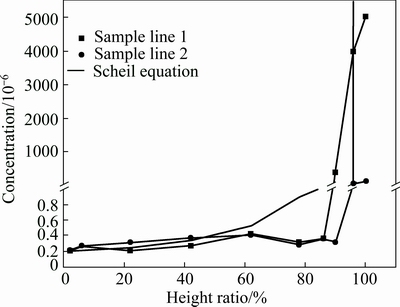
Fig. 5 Concentration profiles of iron along ingot height
4 Conclusions
1) Effective thickness of the solute boundary layer is about 4 mm, and the effective distribution coefficient is 2.98×10⁻⁴ during directional solidification.
2) Convection has an important influence on the redistribution of iron. Convection in the center is weaker than that on the edge.
3) Concentration of iron at grain boundary is much larger than that in inner grain.
4) The concentration of iron in growth direction is not in accordance with the Scheil equation completely. The removal rate of iron is about 99.95%.
Acknowledgments
The authors gratefully acknowledge Mr. Zhen-hai HOU for the helpful discussion.
References
[1] HOFSTETTER J, LELIEVRE J F, CANIZO C D, LUQUE A. Acceptable contamination levels in solar grade silicon: From feedstock to solar cell [J]. Materials Science and Engineering B, 2009, 159-160: 299-304.
[2] MARTORANO M A, NETO J B F, OLIVEIRA T S, TSUBAKI T O. Macrosegregation of impurities in directionally solidified silicon [J]. Metallurgical and Materials Transactions A, 2011, 42: 1870-1886.
[3] FEIGELSON R S. 50 years progress in crystal growth [M]. 1st ed. Amsterdam: Elsevier, 2004.
[4] WU Ji-jun, LI Yan-long, MA Wen-hui, WEI Kui-xian, YANG Bin, DAI Yong-nian. Boron removal in purifying metallurgical grade silicon by CaO-SiO2 slag refining [J]. Transactions of Nonferrous Metals Society of China, 2014, 24(4): 1231-1236.
[5] LI Jing-wei, GUO Zhan-cheng, TANG Hui-qing, WANG Zhi, SUN Shi-tong. Si purification by solidification of Al-Si melt with super gravity [J]. Transactions Nonferrous Metals Society of China, 2012, 22(4): 958-963.
[6] ZHENG S S, CHEN W H, CAI J, LI J T, CHEN C, LUO X T. Mass transfer of phosphorous in silicon melts under vacuum induction refining [J]. Metallurgical and Materials Transactions B, 2010, 41: 1269-1273.
[7] LIU T, DONG Z Y, ZHAO Y W, WANG J, CHEN T, XIE H, LI J, NI H J, HUO D X. Large scale purification of metallurgical silicon for solar cell by using electron bean melting [J]. Journal of Crystal Growth, 2012, 351: 19-22.
[8] WU Ji-jun, MA Wen-hui, LI Yan-long, YANG Bin, LIU Da-chun, DAI Yong-nian. Thermodynamic behavior and morphology of impurities in metallurgical grade silicon in process of O2 blowing [J]. Transactions of Nonferrous Metals Society of China, 2013, 23(1): 260-265.
[9] CAI J, LUO X T, LU C H, HAARBERG G M, LAURENT A, KONGSTEIN O E, WANG S L. Purification of metallurgical grade silicon by electrorefining in molten salts [J]. Transactions of Nonferrous Metals Society of China, 2012, 22(12): 3103-3107.
[10] OSINNIY V, BOMHOLT P, LARSEN A N, ENEBAKK E,  A K, TRONSTAD R, SAFIR Y. Factors limiting minority carrier lifetime in solar grade silicon produced by the metallurgical route [J]. Solar Energy Materials & Solar Cells, 2011, 95: 564-572.
[11] BUONASSISI T, ISTRATOV A A, MARCUS M A, LAI B, CAI Z H, HEALD S M, WEBER E R. Engineering metal-impurity nanodefects for low-cost solar cells [J]. Nature Materials, 2005, 4: 676-679.
[12] YUGE N, HANAZAWA K, KATO Y. Removal of metal impurities in molten silicon by directional solidification with electron bean heating [J]. Materials Transactions, 2004, 45: 850-857.
[13] TAN Y, REN S Q, SHI S, WEN S T, JIANG D C, DONG W, JI M, SUN S H. Removal of aluminum and calcium in multicrystalline silicon by vacuum induction melting and directional solidification [J]. Vacuum, 2014, 99: 272-276.
[14] AUTRUFFE A, VINES L, ARNBERG L, SABATINO M D. Impact of growth rate on impurities segregation at grain boundaries in silicon during Bridgman growth [J]. Journal of Crystal Growth, 2013, 372: 180-188.
[15] BURTON J A, PRIM R C, SLICHTER W P. The distribution of solute in crystal grown from the melt. Part I. Theoretical [J]. Journal of Chemistry Physics, 1953, 21: 1987-1991.
[16] MARTORANO M A, NETO J B F, OLIVEIRA T S, TSUBAKI T O. Refining of metallurgical silicon by directional solidification [J]. Materials Science and Engineering B, 2011, 176: 217-226.
[17] TRUMBORE F A. Solid solubilities of impurity elements in germanium and silicon [J]. The Bell System Technical Journal, 1960, 39: 205-233.
[18] TANG K, OVRELID E J, TRANELL G, TANGSTAD M. Critical assessment of the impurity diffusivities in solid and liquid silicon [J]. Journal of the Minerals Metals & Materials Society, 2009, 61: 49-55.
[19] TILLER W A, JACKSON K A, RUTTER J W, CHALMERS B. The redistribution of solute atoms during the solidification of metals [J]. Acta Materialia, 1953, 1: 428-437.
[20] LI Z Y, LIU L J, LIU X, ZHANG Y F, XIONG J F. Heat transfer in an industrial directional furnace with multi-heaters for silicon ingots [J]. Journal of Crystal Growth, 2014, 385: 9-15.
[21] FAVIER J J. Macrosegregation―I Unified analysis during non- steady state solidification [J]. Acta Materialia, 1981, 29: 197-204.
[22] FUJIWARA K, OBINATA Y, UJIHARA T, USAMI N, SAZAKI G, NAKAJIMA K. In-situ observations of melt growth behavior of Polycrystalline silicon [J]. Journal of Crystal Growth, 2004, 262: 124-129.
[23] TREAMPA M, REIMANN C, FRIEDICH J,  G. The influence of growth rate on the formation and avoidance of C and N related precipitates during directional solidification of multicrystalline silicon [J]. Journal of Crystal Growth, 2010, 312: 1517-1524.
[24] HARTMAN P. On the validity of the Donnay-Harker law [J]. Canadian Mineralogist, 1978, 16: 387-391.
[25] YOSHIKAWA T, MORITA K, KAWANISHI S, TANAKA T. Thermodynamics of impurity element in solid silicon [J]. Journal of Alloys and Compounds, 2010, 490: 31-41.
[26] SU Hai-jun, ZHANG Jun, LIU Lin, FU Heng-zhi. Preparation, microstructure and dislocation of solar-grade multicrystalline silicon by directional solidification from metallurgical-grade silicon [J]. Transactions of Nonferrous Metals Society of China, 2012, 22(10): 2548-2553.
甘传海1,方 明2,3,张 磊1,3,邱 实1,3,李锦堂1,姜大川2,3,温书涛2,谭 毅2,3,罗学涛1
1. 厦门大学 材料系 福建省特种先进材料重点实验室,厦门 361005;
2. 大连理工大学 材料科学与工程学院,大连 116023;
3. 青岛隆盛晶硅科技有限公司,青岛 266200
摘 要:研究冶金级硅低速定向凝固过程中杂质铁的再分布。采用ICP-MS检测铁的浓度,绘制铁在固相、液相、晶界和晶体生长方向上的浓度示意图。铁浓度在固、液相中具有明显差异。依据质量守恒定理,计算得出溶质边界层约为4 mm,铁的有效分凝系数约为2.98×10⁻⁴。在低速凝固条件下,铁容易偏析聚集在晶界。在生长方向上,由于低速凝固,铁浓度在硅锭86%高度以下几乎恒定,不完全符合Scheil方程规律。讨论了对流对铁再分布的影响,对流“死区”对铁再分布具有重要影响。
关键词:定向凝固;冶金级硅;再分布;铁;晶界
(Edited by Xiang-qun LI)
Foundation item: Projects (51334004, 51204143) supported by the National Natural Science Foundation of China; Project (2006L2003) supported by the Scientific Technological Innovation Platform of Fujian Province, China
Corresponding author: Xue-tao LUO; Tel: +86-592-2188503; E-mail: xuetao@xmu.edu.cn
DOI: 10.1016/S1003-6326(16)64177-8

