Cr������ʱЧ̬Cu-Cr-P�Ͻ�����֯�����ܵ�Ӱ��
��Դ�ڿ����й���ɫ����ѧ��(Ӣ�İ�)2021���1��
�������ߣ����� �ź��� ������ л����
����ҳ�룺232 - 242
�ؼ��ʣ�Cu-Cr-P�Ͻ�CrԪ�غ�������߶�������
Key words��Cu-Cr-P alloy; Cr content; multiscale precipitates
ժ Ҫ���о�Cr������ʱЧ̬Cu-Cr-P�Ͻ�����������ܵ�Ӱ�졣������֣�ʱЧ������Cu-Cr-P�Ͻ��д���3�ֳߴ��Cr�࣬���У�����Cr����Cu-Cr-P�Ͻ����Ҫǿ���ࣻ�� 5 nm��Cr��Ϊ���������ṹ���������ȫ����ǿ������Ϊλ���й����ƣ�ǿ��Ч��ԼΪ200 MPa��10~20 nm��Cr��Ϊ�����ǹ�������������ṹ����ǿ������ΪOrowanλ���ƹ����ƣ�ǿ��Ч��ԼΪ100 MPa��CrԪ�غ����ĸı�ʹ����������Cr�������������ߴ緢���仯����������Cu-Cr-P�Ͻ����ѧ���ܳ��ֳ������Ӻ��С�����ơ�Cu-0.36Cr-0.01P�Ͻ�980 ��C����2 h���ܴ�����95%������450 ��C����1 hʱЧ�������нϺõ��ۺ����ܣ�����ǿ��572 MPa�͵�����80.0% IACS��
Abstract: The role of Cr in affecting the precipitates and the properties of aged Cu-Cr-P alloys was investigated and discussed. The results show that there are mainly three sizes of Cr phase in aged Cu-Cr-P alloys, among them, the nano-sized Cr phase plays an important role in the strength of Cu-Cr-P alloys. The strengthening effect of Cr phase (less than 5 nm) with FCC structure completely coherent with the matrix is calculated to be about 200 MPa on the basis of dislocation cut-through mechanism. The strengthening effect of Cr phase (10-20 nm) with BCC structure incoherent with the matrix is calculated to be about 100 MPa on the basis of the Orowan dislocation bypass mechanism. The increase of Cr content changes the number and size of nano-sized Cr phase, which causes the mechanical properties of the Cu-Cr-P alloys to increase first and then decrease. The tensile strength of Cu-0.36Cr-0.01P alloy is 572 MPa and its electrical conductivity is 80% IACS after solid solution treatment at 980 ��C for 2 h followed by 95% cold rolling and then aging treatment at 450 ��C for 1 h.
Trans. Nonferrous Met. Soc. China 31(2021) 232-242
Jian WANG1,2, Hong-tao ZHANG1,2, Hua-dong FU1,2, Jian-xin XIE1,2
1. Beijing Laboratory of Metallic Materials and Processing for Modern Transportation, University of Science and Technology Beijing, Beijing 100083, China;
2. Key Laboratory for Advanced Materials Processing, Ministry of Education, University of Science and Technology Beijing, Beijing 100083, China
Received 15 March 2020; accepted 4 August 2020
Abstract: The role of Cr in affecting the precipitates and the properties of aged Cu-Cr-P alloys was investigated and discussed. The results show that there are mainly three sizes of Cr phase in aged Cu-Cr-P alloys, among them, the nano-sized Cr phase plays an important role in the strength of Cu-Cr-P alloys. The strengthening effect of Cr phase (less than 5 nm) with FCC structure completely coherent with the matrix is calculated to be about 200 MPa on the basis of dislocation cut-through mechanism. The strengthening effect of Cr phase (10-20 nm) with BCC structure incoherent with the matrix is calculated to be about 100 MPa on the basis of the Orowan dislocation bypass mechanism. The increase of Cr content changes the number and size of nano-sized Cr phase, which causes the mechanical properties of the Cu-Cr-P alloys to increase first and then decrease. The tensile strength of Cu-0.36Cr-0.01P alloy is 572 MPa and its electrical conductivity is 80% IACS after solid solution treatment at 980 ��C for 2 h followed by 95% cold rolling and then aging treatment at 450 ��C for 1 h.
Key words: Cu-Cr-P alloy; Cr content; multiscale precipitates
1 Introduction
Cu-Cr-Zr alloys are considered to be an ideal material for very large-scale integrated circuit lead frame, high-end electrode, nuclear reactor heat sink and new generation of high-speed rail contact wire, due to their high strength, high electrical conductivity, non-magnetic properties, good fatigue resistance and good thermal stability [1-3]. However, Zr element can be easily oxidized and burn during the preparation of the alloy, which makes it difficult to control the composition and the performance of the alloy accurately, and limits the large-scale production and the application of Cu-Cr-Zr alloys [4-6].
For this reason, researchers are working on finding new elements to replace Zr in Cu-Cr alloys, such as Fe, Ti, Ag and P [7-11]. Studies have shown that taking Fe or Ti as the third component can improve the strength of Cu-Cr alloys, but greatly decrease the electrical conductivity of the alloy [7,8]. Ag can simultaneously increase the strength and plasticity of the alloy, and it has little effect on the electrical conductivity of the alloy. However, Ag is a type of precious metal material, the production of Cu-Cr-Ag alloys can be costly [9], and the P element can inhibit the growth of Cr precipitates through the formation of Cr3P phase, which can hinder the dislocation motion, and improve the high temperature softening resistance of Cu-Cr-P alloys [10,11].
The common feature of the related work [7-11] is to study the effect of the third component content on the microstructure and properties of the alloy under the condition that the Cr content is constant. Usually, for Cu-Cr-X ternary alloys, the content of the third element, namely X, is very little, and its effect on the properties of alloy is indirect. Generally, the third component affects the properties of alloy indirectly by influencing the shape and number of Cr precipitates [8-13]. For example, Ti, Mg and Nb elements can restrain the growth of Cr precipitates by distributing on the surface of Cr phase during aging treatment [8,12,13]; Ag element can depress the chain precipitation of the Cr phase, which improves the strength of the alloy [9]. While, the content of Cr element can affect the properties of alloy directly, because most of Cu-Cr-X ternary alloys are aging- strengthened copper alloy, and the precipitated particles are mainly Cr phase. Cr can increase the strength and hardness of copper alloy, and decrease the conductivity. Therefore, it is worthwhile to investigate the influence of Cr content on microstructure and properties of Cu-Cr-P alloys.
In this work, the effect of Cr content on the microstructure and properties of the aged Cu-Cr-P alloys under the condition of certain P content was studied. And the experimental basis for developing high performance Cu-Cr-P alloys, which is comparable to Cu-Cr-Zr alloys, has been provided.
2 Experimental
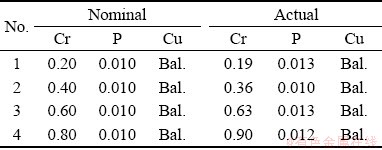
The raw materials were high purity electrolytic copper (99.99 wt.%), pure Cr (99.99 wt.%), and Cu-P master alloys with 14 wt.% P. The alloy ingots with diameter of 70 mm and height of 500 mm were obtained by melting in ZG-001 medium frequency induction vacuum furnace under argon atmosphere and casting in graphite mold. The nominal and actual compositions of the alloy are shown in Table 1. The content of P in Cu-Cr-P alloys are designed according to the previous study [7].
Table 1 Chemical compositions of Cu-Cr-P alloys (wt.%)
The oxide layer and defects on the surface of the ingot were removed. 20 mm-thick sample was cut from 20 mm away from the bottom of the ingot. Samples were solid solution treated at 980 ��C for 2 h in SGM.M10/14 box resistance furnace and water quenched. After removing the surface oxide layer, they were subjected to 95% deformation cold rolling by the two-roll mill, and then aged at 450 ��C for 1 h.
The electrical conductivity of the samples at room temperature (20 ��C) were measured by a Sigms2008 digital eddy current metal conductivity meter. The sample size was 20 mm �� 50 mm �� 1 mm. For each condition, the electrical conductivity was measured 5 times. The samples for mechanical properties testing were prepared according to GB/T 228.1��2010. A WDW-200D universal material testing machine was used to test the room temperature mechanical properties at a deformation rate of 1 mm/min. For each condition, three samples were measured and the ultimate tensile strength was calculated by the average value of three measurements. The Phenom ProX electron microscope was used to observe the microstructure and the etching solution was a solution of ferric nitrate hydrochloride in the ratio of 10 g Fe(NO3)3+ 50 mL HCl + 40 mL H2O. The size and volume fraction of the precipitation phases were counted by Image Pro software. TEM samples were prepared by the electrolytic double spray thinning method at -30 ��C, and the electrolyte was 70 vol.% methanol +30 vol.% nitric acid. The aging phases of the alloy were observed by TECNAI G2100 transmission electron microscope. X-ray diffraction (XRD) was measured by X'Pert Pro diffractometer, Cu K�� radiation (��=1.5406  ), the step size was about 0.016��, and the scanning speed was about 1 (��)/min.
3 Results and discussion
3.1 Effect of Cr content on micron Cr phase of aged Cu-Cr-P alloys
Figure 1 shows the microstructure of the aged Cu-Cr-P alloys with different Cr contents and the EDS results of the secondary phase. The EDS results of Fig. 1(c) show that the secondary phase is Cr phase. According to the figure, no obvious recrystallization occurred in the alloy matrix after aging treatment, and the fibrous structure, which was formed by cold-rolling deformation, is still maintained. It can be seen that as the content of Cr increases, the size and number of the Cr phase gradually increase.
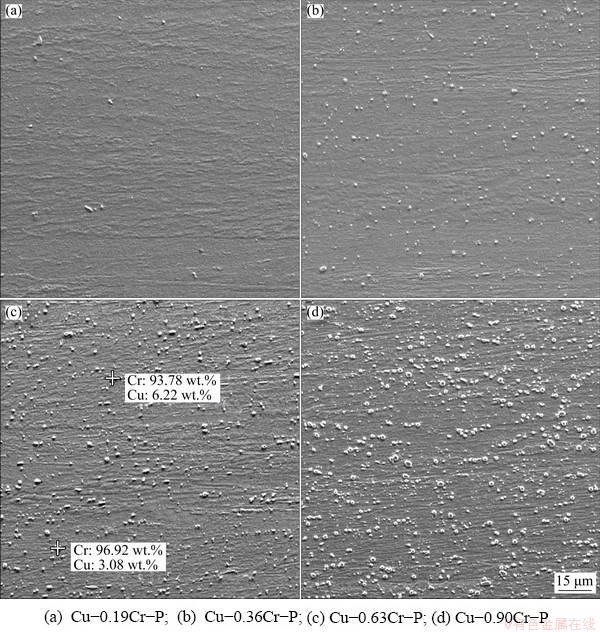
Fig. 1 Microstructures of aged Cu-Cr-P alloys with different Cr contents
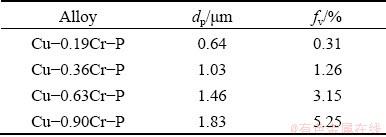
The average size (dp) and the volume fraction (fv) of the Cr phase in Fig. 1 are counted, and the results are shown in Table 2. The Cr precipitates after aging treatment in tested Cu-Cr-P alloys with different Cr contents are all in micron/ sub-micron size.
Table 2 Average size and volume fraction of Cr phase in aged alloys
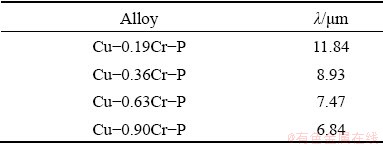
According to Orowan-Ashby strengthening mechanism [14], the distance between the particles is expressed by l, which can be calculated by Eq. (1), and the calculation results of the distance between Cr phases in the aged Cu-Cr-P alloys with different Cr contents are listed in Table 3. The results show that the distance between Cr phases is much greater than 1 ��m in the aged Cu-Cr-P alloys. In metal matrix composites, if the distance between the precipitates is greater than 1 ��m, the effect of precipitates on the mechanical properties of the alloy can be very little [15]. Therefore, the influence of micro/sub-micron Cr phases on the strength properties of Cu-Cr-P alloys could be negligible.
 (1)
(1)
Table 3 Calculation results of distance between Cr phases in aged alloys
3.2 Effect of Cr content on nano-scale Cr phase of aged Cu-Cr-P alloys
The size and number of precipitates in the precipitation strengthening copper-based alloy directly affect the mechanical properties of the alloy. From Figs. 2 and 3, the nano-sized precipitates in the Cu-Cr-P alloys are mainly within the typical scales of 10-20 nm and less than 5 nm.
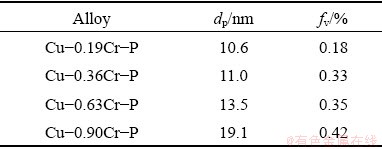
Figure 2 shows the TEM images, HRTEM image and fast Fourier transform (FFT) pattern of precipitates with size of 10-20 nm in Cu-Cr-P alloys with different Cr contents. The spherical and elliptic precipitates appeared in the alloy matrix after aging treatment, and the size and number of precipitates increased with the increase of Cr content. The size and the volume fraction of the precipitates with size of 10-20 nm were counted, and the results are shown in Table 4. Figure 2(e) also shows the HRTEM images and FFT patterns of the precipitate in Cu-0.36Cr-P alloys, and the calibration results show that these precipitates are Cr phase, with a body-centered cubic structure.
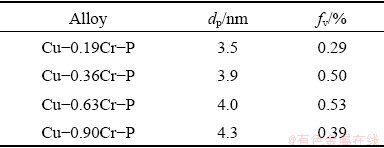
Further observation of the alloy reveals that there are large number of precipitates with size less than 5 nm in the alloy. The TEM images, HRTEM image, FFT patterns and EDS results of precipitates with size less than 5 nm in Cu-Cr-P alloys with different Cr contents are shown in Fig. 3. The volume fraction of the precipitates with the size less than 5 nm in the four kinds of alloys are counted, and the results are shown in Table 5. The results show that with the increase of Cr content, the volume fraction of the precipitate with size less than 5 nm firstly increases and then decreases.
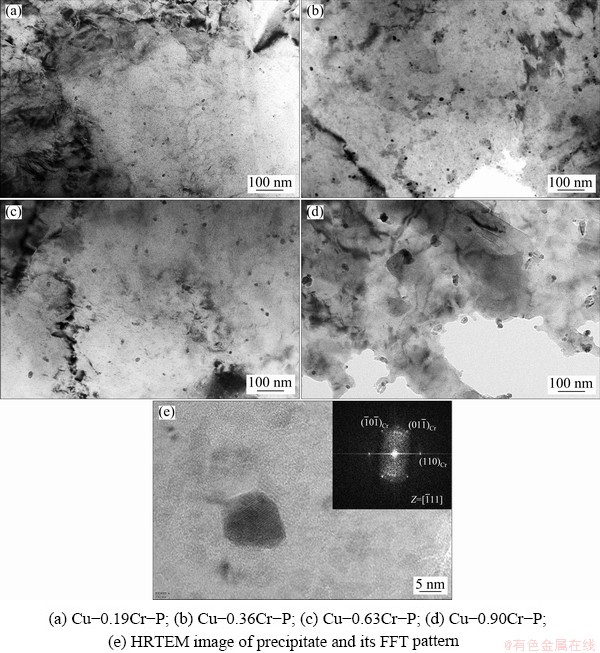
Fig. 2 TEM images showing Cr phase with size 10-20 nm in aged Cu-Cr-P alloys with different Cr contents

Fig. 3 TEM images showing Cr phase with size less than 5 nm of Cu-Cr-P alloys with different Cr contents
Table 4 Average size and volume fraction of Cr phase with size of 10-20 nm
Figures 3(e) and (f) show the HRTEM images, FFT patterns and EDS results of precipitates with size less than 5 nm. It can be seen from Fig. 3(e) that the precipitates with size less than 5 nm mainly exhibit the two different morphologies of contrast: one is spherical contrast (P1), and the other one is coffee-bean-like contrast (P2). Combined with the EDS result, it can be considered that the precipitates of both contrasts are Cr phases. According to the Ref. [16], the SAED patterns of fully coherent Cr phases with three major zone axis of [011]Cu, [001]Cu and [112]Cu show that no diffraction spots other than those from the matrix are visible. And the FFT patterns of P1 and P2 show that there are no other spots except the matrix, which indicates that the two contrast precipitates are both metastable face-centered cubic Cr phases and completely coherent with the matrix.
The nano-sized precipitations interact with dislocations to increase the strength of the alloy. Generally speaking, there are two interaction modes between dislocation and precipitates. When the size of precipitate is small and coherent with the matrix, dislocations can pass through the precipitates; when the size of the precipitates is large and maintains coherent relationship with matrix, dislocations can bypass the precipitates [17].
Table 5 Average size and volume fraction of Cr phases with size less than 5 nm
The Cr phases with the size of 10-20 nm are non-coherent with the matrix, and the strengthening effect can be calculated by the Orowan-Ashby mechanism [14] as
 (2)
(2)
where M is the Taylor factor, G is the shear modulus, b is the magnitude of Burgers vector, and �� is the Poisson ratio. Referring to the relevant literature [18], for Cu alloy, M=3.06, G=44GPa, b=0.255 nm and ��=0.303.
The Cr phases with size less than 5 nm are coherent with the Cu matrix, and the coherent strengthening calculation method is used to evaluate the strengthening effect, as [19-23]
 (3)
(3)
where �� is the function of the mismatch between the face-centered cubic Cr phase and the matrix, r is the average radius of the precipitate, F is the dislocation tension of the precipitated phase. In Cu alloy, the coefficient x is 2.6, usually [23].
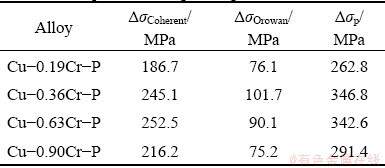
The statistical results of Tables 4 and 5 are taken into Eqs. (2) and (3) for calculation, respectively. Then, the yield stress increments of the two sizes Cr phases are obtained, as list in Table 6. In this work, the total yield stress increment (����p) resulting from precipitation strengthening is calculated by the sum of two strengthening methods. It can be seen that with the increase of Cr content, the strengthening effect of nano-sized Cr phase increases at first and then decreases.
Table 6 Precipitation strengthening calculation results
3.3 Effect of Cr content on dislocation density of aged Cu-Cr-P alloys
The dislocation density in Cu alloy affects the strength and electrical conductivity of the material. Usually, the dislocation density is calculated by the Williamson-Hall method [24]. Assuming that all internal microscopic strains are caused by dislocations, the dislocation density (��) can be obtained from Eq. (4):
 (4)
(4)
where D is the average sub-grain size, �� is the micro-strain, which are obtained by XRD experiment.
The micro-strain, ��, can be calculated by the slope of ��cos �� versus 4sin ��, induced in an alloy in accordance to the Williamson-Hall��s equation [24]:
 (5)
(5)
where �� is the full width at half maximum (FWHM) of diffraction peaks, �� is the radiation wavelength, k is a constant, �� is the Bragg angle.
The XRD patterns and micro-strain �� of four kinds of Cu-Cr-P alloys are shown in Fig. 4.
The yield stress increment (����d) generated by dislocation strengthening can be calculated by the Bailey-Hirsch [25] equation:
 (6)
(6)
where ��=0.2 (face-centered cubic material).
Combined with the average sub-grain size in Table 7, the yield stress increment (����GB) generated by grain boundary strengthening can be obtained by the Hall-Petch equation [26,27]:
 (7)
(7)
where KP-H is the Hall-Petch coefficient, and KP-H=0.14 for the Cu alloy.
The calculation results of the dislocation density and the yield stress increment generated by dislocation strengthening and grain boundary strengthening are shown in Table 7. The results show that the change of Cr content has little effect on the dislocation density in the aged Cu-Cr-P alloys.
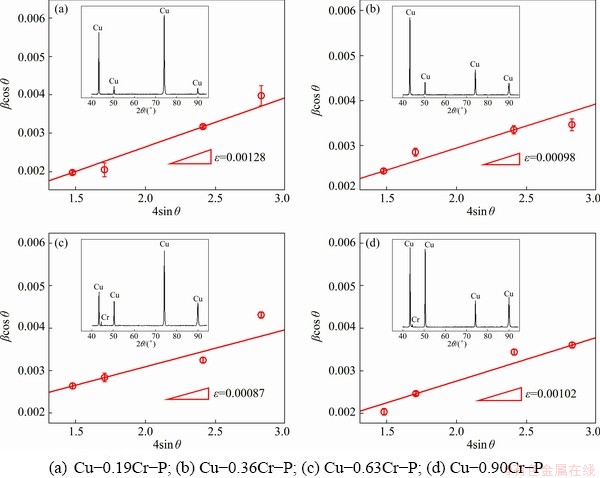
Fig. 4 Micro-strains and XRD diffraction patterns of Cu-Cr-P alloys with different Cr contents
Table 7 Calculation results of micro-strain, average sub-grain size, dislocation density, dislocation strengthening and grain boundary strengthening

3.4 Effect of Cr content on properties of aged Cu-Cr-P alloys
Figure 5 shows the change of tensile strength, electrical conductivity and stress-strain curves of Cu-Cr-P alloys with different Cr contents after aging treatment. It can be seen that as the content of Cr increases, the tensile strength of the alloy firstly increases and then decreases, while the electrical conductivity decreases gradually. Cu-0.19Cr-P alloy has a good electrical conductivity of 82.3% IACS. The tensile strength of Cu-0.36Cr-P alloy is significantly improved, which is 572 MPa, and the electrical conductivity decreases slightly to 80.0% IACS. The electrical conductivity and tensile strength of Cu-0.63Cr-P alloy are both decreased, which are 79.1% IACS and 563 MPa, respectively. The electrical conductivity of Cu-0.90Cr-P alloy dose not decrease significantly, but its tensile strength decreases to 516 MPa. In addition, the yield strengths of the four kinds of Cu-Cr-P alloys are 445 MPa (0.19 Cr), 539 MPa (0.36 Cr), 528 MPa (0.63 Cr), and 471 MPa (0.90 Cr), respectively.
The yield strength of polycrystalline materials can be expressed as [28]
��total=��0+����p+����GB+����d+����s (8)
where ��0 is a constant with the value of 40 MPa for copper alloys [29]. ����p, ����GB, ����d and ����s represent the yield stress increments produced by the precipitation strengthening, the grain boundary strengthening, the dislocation strengthening and the solid solution strengthening, respectively. Among them, the solid solution strengthening effect generated only by Cr atoms is not obvious and can be ignored [30], while ����p, ����d and ����GB have been obtained in Sections 3.2 and 3.3.
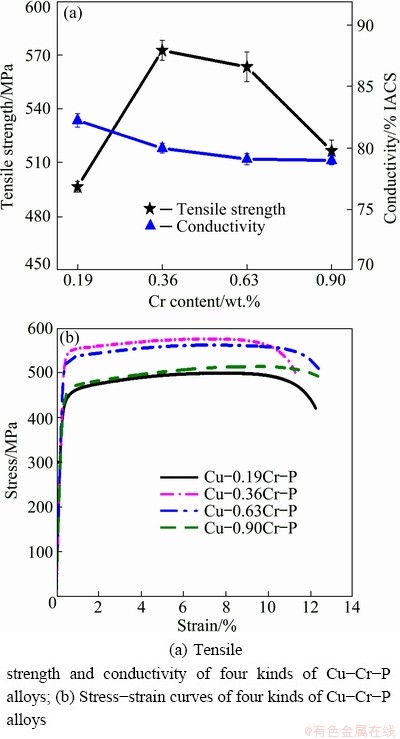
Fig. 5 Properties and stress-strain curves of Cu-Cr-P alloys with different Cr contents after aging
The calculation results of ����p, ����d and ����GB are taken into Eq. (8), and the theoretical yield strengths (��total) of the Cu-Cr-P alloys with four different Cr contents are obtained, which are compared with the experimental yield strengths (��exp), as shown in Fig. 6. In this work, the yield stress increment caused by precipitation strengthening is the greatest, followed by grain boundary strengthening, while the yield stress increment caused by dislocation strengthening is little, and the solution strengthening can be ignored. Therefore, the main strengthening mode of Cu-Cr-P alloys with different Cr contents is precipitation strengthening. As shown in Section 3.2, with the increase of Cr content, the precipitation strengthening effect of the Cr phase with size less than 5 nm and the Cr phase with size 10-20 nm increases first and then decreases, which leads to the tensile strength of Cu-Cr-P alloys increasing first and then decreasing with the increase of Cr content.
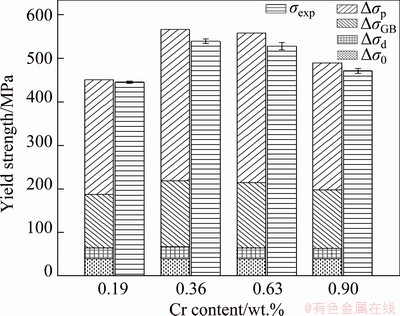
Fig. 6 Comparison of theoretical and experimental yield strength values
The factors affecting conductivity can be expressed by the Matthiessen��s rule [31]:
��alloy=��0+��imp+��def+��int+��pho (9)
where ��alloy is the resistance of Cu-Cr-P alloys, while ��0, ��imp, ��def, ��int and ��pho are the resistance of the copper matrix and the resistances generated by solute atoms, grain boundaries, dislocations and phonons scattering, respectively.
Phonon scattering is mainly caused by thermal vibration, which is greatly affected by temperature. The conductivity values measured in this work are all at room temperature, so the influence of phonons scattering can be neglected. When the grain size is equivalent to the electron mean free path inside the grain interior, the effect of the grain boundary scattering on the resistivity cannot be ignored [31]. Generally, the effect of grain boundary scattering on the resistivity of the alloy is considered in the polycrystalline film material. When the dislocation density reaches the order of 1017-1018m-2, the electrical conductivity of the alloy will be significantly affected [31]. After aging at 450 ��C for 1 h, the dislocation densities of four kinds of Cu-Cr-P alloys are all on the order of 1013m-2, much lower than that of 1017-1018m-2. Therefore, the effect of grain boundary and the dislocation density on the conductivity of Cu-Cr-P alloys are not considered. Solute atoms dissolved in Cu matrix will lead to lattice distortion, and the distorted lattice structure will scatter electrons greatly. Therefore, the solute atoms remaining in Cu matrix after aging is the main reason that affects the electrical conductivity of Cu-Cr-P alloys.
Although the aging treatment can decompose the supersaturated solid solution and promote the precipitation of Cr atoms from the matrix, there are still some Cr atoms remaining in the matrix, and this part of Cr atoms are the main cause of the decrease in the electrical conductivity of the alloy. Combined with the experimental results of the electrical conductivity in Section 3.4, we believe that the increase of Cr content in the Cu-Cr-P alloys can increase the residual Cr atoms in the alloy matrix after aging, which can lead to the decrease of the electrical conductivity of the alloy.
3.5 Comparison of effect of third component on properties of Cu-Cr alloys
Figure 7 compares the tensile strength and electrical conductivity of Cu-0.36Cr-0.01P alloy with six types of Cu-Cr-X alloys with Fe [7], Ti [8], Ag [9,26], Mg [12], Nb [13], Zr [32-34] and other alloy elements as the third component mentioned in the literatures. The Cu-Cr-X alloys that are used for comparison, are similar in processing technology without severe plastic deformation or low temperature rolling. According to Fig. 7, Cu-Cr-Ag and Cu-Cr-Nb alloys have good electrical conductivities; while Cu-Cr-Fe and Cu-Cr-Ti alloys have high tensile strengths. In general, Cu-Cr-Zr alloys have excellent comprehensive performances. The electrical conductivity of Cu-0.6Cr-0.3Zr alloy reaches 80.7% IACS and the tensile strength reaches 589 MPa. Cu-0.36Cr-0.01P alloy has the same tensile strength and electrical conductivity as Cu-0.6Cr-0.3Zr alloy with the experimental conditions, and can avoid the preparation problems and unstable properties caused by Zr element, so effectively reduce the production cost and facilitate industrial production.
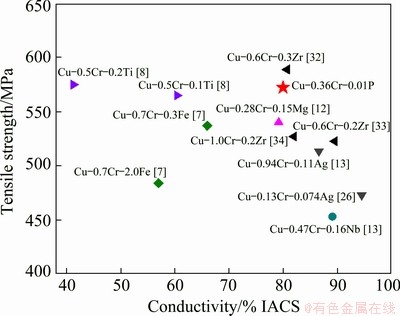
Fig. 7 Comparison of tensile strength and electrical conductivity of Cu-Cr-X alloys
4 Conclusions
(1) Three scales of Cr phases were found in aged Cu-Cr-P alloys are micro/sub-micron Cr phases showed neglected influence, BCC Cr phase with the size of 10-20 nm strengthened the alloys via the Orowan mechanism, FCC Cr phase with the size less than 5 nm strengthened the alloys by the coherency strengthening.
(2) For Cu-Cr-P alloys, the content of Cr should be controlled within a proper range to get suitable strength and electrical conductivity. When P content was about 0.01 wt.%, Cr content should be within 0.36-0.63 wt.%.
(3) The tensile strength and electrical conductivity of Cu-0.36Cr-0.01P alloy were 572 MPa and 80% IACS respectively after solid solution at 980 ��C for 2 h followed by 95% cold rolling then aging treatment at 450 ��C for 1 h, and it could be comparable to the properties of Cu-0.6Cr-0.3Zr alloy.
Acknowledgments
The authors are grateful for the financial supports from National Key R&D Program of China (2016YFB0301303), Beijing Nova Program, China (Z191100001119125), and the National Natural Science Foundation of China (51974028, U1602271).
References
[1] PAN Zhen-ya, CHEN Jiang-biao, LI Jin-fu. Microstructure and properties of rare earth-containing Cu-Cr-Zr alloy [J]. Transactions of Nonferrous Metals Society of China, 2015, 25(4): 1206-1214.
[2] SUN L X, TAO N R, LU K. A high strength and high electrical conductivity bulk CuCrZr alloy with nanotwins [J]. Scripta Materialia, 2015, 99: 73-76.
[3] FU Hua-dong, XU Sheng, LI Wei, Xie jian-xin, ZHAO Hong-bin, PAN Zhi-jun. Effect of rolling and aging processes on microstructure and properties of Cu-Cr-Zr alloy [J]. Materials Science and Engineering A, 2017, 700: 107-115.
[4] LIU Qiang, ZHANG Xiang, GE Yan, WANG Jin, CUI Jian-zhong. Effect of processing and heat treatment on behavior of Cu-Cr-Zr alloys to railway contact wire [J]. Metallurgical and Materials Transactions A, 2006, 37(11): 3233-3238.
[5] KERMAJANI M, RAYGAN Sh, HANAYI K, GHAFFARI H. Influence of thermomechanical treatment on microstructure and properties of electroslag remelted Cu-Cr-Zr alloy [J]. Materials & Design, 2013, 51: 688-694.
[6] LIN G B, WANG Z D, ZHANG M K, ZHANG H, ZHAO M. Heat treatment method for making high strength and conductivity Cu-Cr-Zr alloy [J]. Materials Science and Technology, 2011, 27(5): 966-969.
[7] GUO F A, XIANG C J, YANG C X, CAO C X, MU S G, TANG Y Q. Study of rare earth elements on the physical and mechanical properties of a Cu-Fe-P-Cr alloy [J]. Materials Science and Engineering B, 2008, 147(1): 1-6.
[8] ZHANG Peng-chao, JIE Jin-chuan, GAO Yuan, WANG Tong-min, LI Ting-ju. Effect of Ti element on microstructure and properties of Cu-Cr alloy [J]. Materials Science Forum, 2015, 817: 307-311.
[9] XU Sheng, FU Hua-dong, WANG Yin-tao, XIE Jian-xin. Effect of Ag addition on the microstructure and mechanical properties of Cu-Cr alloy [J]. Materials Science and Engineering A, 2018, 726: 208-214.
[10] LUO C P, DAHMEN U, WITCOMB M J, WESTMACOTT K H. Precipitation in dilute Cu-Cr alloys: The effects of phosphorus impurities and aging procedure [J]. Scripta Metallurgica, 1992, 26(4): 649-654.
[11] GAO N, TIAINEN T, JI Y, LAAKSO L. Control of microstructures and properties of a phosphorus-containing Cu-0.6Wt.%Cr alloy through precipitation treatment [J]. Journal of Materials Engineering and Performance, 2000, 9(6): 623-629.
[12] ZHAO Zi-qian, XIAO Zhu, LI Zhou, MA Mu-zhi, DAI Jie. Effect of magnesium on microstructure and properties of Cu-Cr alloy [J]. Journal of Alloys and Compounds, 2018, 752: 191-197.
[13] GUO Xiao-li, XIAO Zhu, QIU Wen-ting, LI Zhou, ZHAO Zi-qian, WANG Xu, JIANG Yan-bin. Microstructure and properties of Cu-Cr-Nb alloy with high strength, high electrical conductivity and good softening resistance performance at elevated temperature [J]. Materials Science and Engineering A, 2019, 749: 281-290.
[14] MABUCHI M, HIGASHI K. Strengthening mechanisms of Mg-Si alloys [J]. Acta Materialia, 1996, 44(11): 4611-4618.
[15] AIKIN R M, HRISTODOULOU L. The role of equiaxed particles on the yield stress of composites [J]. Scripta Metallurgica et Materialia,1991, 25(1): 9-14.
[16] PENG Li-jun, XIE Hao-feng, HUANG Guo-jie, XU Gao-lei, YIN Xiang-qian, FENG Xue, MI Xu-jun, YANG Zhen. The phase transformation and strengthening of a Cu-0.71wt%Cr alloy [J]. Journal of Alloys and Compounds, 2017, 708: 1096-1102.
[17] CORREIA J B, DAVIES H A, SELLARS C M. Strengthening in rapidly solidified age hardened Cu-Cr and Cu-Cr-Zr alloys [J]. Acta Materialia, 1997, 45(1): 177-190.
[18] WU Ya-ke, LI Ya, LU Jun-yong, TAN Sai, JIANG Feng, SUN Jun. Correlations between microstructures and properties of Cu-Ni-Si-Cr alloy [J]. Materials Science and Engineering A, 2018, 731: 403-412.
[19] NABARRO F R N, MURA T. Dislocations in solids: Dislocations in metallurgy [J]. Journal of Applied Mechanics, 1981, 48(2): 451-452
[20] ARDELL A J. Precipitation hardening [J]. Metallurgical Transactions A, 1985, 16(12): 2131-2165.
[21] GEROLD V, HARBERKORN H. On the critical resolved shear stress of solid solutions containing coherent precipitates [J]. Physica Status Solid, 1966, 16(2): 675-684.
[22] HANSEN N. Polycrystalline strengthening [J]. Metallurgical Transactions A, 1985, 16(12): 2167-2190.
[23] DING Z Y, JIA S G, NING X M, SONG K X, LIU P. Aging properties of high-strength and high-conductivity Cu-Cr-Zr alloy [J]. The Chinese Journal of Nonferrous Metals, 2017, 27(12): 2420-2425. (in Chinese)
[24] WILLIAMSON G K, SMALLMAN R E. Dislocation densities in some annealed and cold-worked metals from measurements on the X-ray Debye-Scherrer spectrum [J]. Philosophical Magazine, 1956, 1(1): 34-46.
[25] MARC A M, CHAWLA K K. Mechanical behavior of materials [J]. Aircraft Engineering and Aerospace Technology, 2008, 81(2): 83-85.
[26] HALL E O. The deformation and ageing of mild steel: III Discussion of results [J]. Proceedings of the Physical Society (Section B), 1951, 64(9): 747.
[27] ZHAO Zhi-lei, XIAO Zhu, LI Zhou, QIU Wen-ting, JIANG Hong-yun, LEI Qian, LIU Ze-ru, JIANG Yan-bin, ZHANG Sang-jian. Microstructure and properties of a Cu-Ni-Si-Co-Cr alloy with high strength and high conductivity [J]. Materials Science and Engineering A, 2019, 759: 396-403.
[28] CHAKRABARTI D J, LAUGHLIN D E. The Cr-Cu (chromium-copper) system [J]. Bulletin of Alloy Phase Diagrams, 1984, 5(1): 59-68.
[29] LIU Yue, LI Zhou, JIANG Ye-xin, ZHANG Yang��ZHOU Zhe-yuan. The microstructure evolution and properties of a Cu-Cr-Ag alloy during thermal-mechanical treatment [J]. Journal of Materials Research, 2017, 32(7): 1324-1332.
[30] LIU Ping, KANG Bu-xi, CAO Xing-guo, HUANG Jin-liang, GU Hai-cheng. Coherent strengthening of aging precipitation in rapidly solidified Cu-Cr alloy [J]. Acta Metallurgica Sinica, 1999, 35(6): 561-564.
[31] TIAN Liang, ANDERSON I, RIEDEMANN T, RUSSELL A. Modeling the electrical resistivity of deformation processed metal�Cmetal composites [J]. Acta Materialia, 2014, 77: 151-161.
[32] WANG Wei, LI Ren-geng, ZOU Cun-lei, CHEN Zong-ning, WEN Wen, WANG Tong-min, YIN Guo-mao. Effect of direct current pulses on mechanical and electrical properties of aged Cu�CCr�CZr alloys [J]. Materials & Design, 2016, 92: 135-142.
[33] HE Ming, LI Xian-liang, CAO Zhong-quan, DONG Shu-lin, LIU Tie, WANG Qiang. Effect of heat treatment on the microstructure and properties of Cu-0.6Cr-0.2Zr alloy induction coil in electromagnetic steel-teeming system [J]. Vacuum, 2017, 146: 130-135.
[34] ZHANG B, ZHANG Z G, LI W. Effects of thermo- mechanical treatment on microstructure and properties of Cu-Cr-Zr alloys [J]. Phys Procedia, 2013, 50: 55-60.
�� ��1,2���ź���1,2��������1,2��л����1,2
1. �����Ƽ���ѧ �ִ���ͨ����������ӹ���������ʵ���ң����� 100083��
2. �����Ƽ���ѧ �����Ƚ��Ʊ������������ص�ʵ���ң����� 100083
ժ Ҫ���о�Cr������ʱЧ̬Cu-Cr-P�Ͻ�����������ܵ�Ӱ�졣������֣�ʱЧ������Cu-Cr-P�Ͻ��д���3�ֳߴ��Cr�࣬���У�����Cr����Cu-Cr-P�Ͻ����Ҫǿ���ࣻ�� 5 nm��Cr��Ϊ���������ṹ���������ȫ����ǿ������Ϊλ���й����ƣ�ǿ��Ч��ԼΪ200 MPa��10~20 nm��Cr��Ϊ�����ǹ�������������ṹ����ǿ������ΪOrowanλ���ƹ����ƣ�ǿ��Ч��ԼΪ100 MPa��CrԪ�غ����ĸı�ʹ����������Cr�������������ߴ緢���仯����������Cu-Cr-P�Ͻ����ѧ���ܳ��ֳ������Ӻ��С�����ơ�Cu-0.36Cr-0.01P�Ͻ�980 ��C����2 h���ܴ�����95%������450 ��C����1 hʱЧ�������нϺõ��ۺ����ܣ�����ǿ��572 MPa�͵�����80.0% IACS��
�ؼ��ʣ�Cu-Cr-P�Ͻ�CrԪ�غ�������߶�������
(Edited by Xiang-qun LI)
Corresponding author: Hua-dong FU; Tel: +86-10-62332253; E-mail: hdfu@ustb.edu.cn
DOI: 10.1016/S1003-6326(20)65490-5
1003-6326/ 2021 The Nonferrous Metals Society of China. Published by Elsevier B.V. & Science Press

