Understanding pollution dynamics in large-scale peer-to-peer IPTV system
来源期刊:中南大学学报(英文版)2012年第8期
论文作者:王海舟 陈兴蜀 王文贤 郝正鸿
文章页码:2203 - 2217
Key words:peer-to-peer technology; internet protocol television; active measurement; distributed crawler; pollution attack; PPLive
Abstract: With the great commercial success of several IPTV (internet protocal television) applications, PPLive has received more and more attention from both industry and academia. At present, PPLive system is one of the most popular instances of IPTV applications which attract a large number of users across the globe; however, the dramatic rise in popularity makes it more likely to become a vulnerable target. The main contribution of this work is twofold. Firstly, a dedicated distributed crawler system was proposed and its crawling performance was analyzed, which was used to evaluate the impact of pollution attack in P2P live streaming system. The measurement results reveal that the crawler system with distributed architecture could capture PPLive overlay snapshots with more efficient way than previous crawlers. To the best of our knowledge, our study work is the first to employ distributed architecture idea to design crawler system and discuss the crawling performance of capturing accurate overlay snapshots for P2P live streaming system. Secondly, a feasible and effective pollution architecture was proposed to deploy content pollution attack in a real-world P2P live streaming system called PPLive, and deeply evaluate the impact of pollution attack from following five aspects: dynamic evolution of participating users, user lifetime characteristics, user connectivity-performance, dynamic evolution of uploading polluted chunks and dynamic evolution of pollution ratio. Specifically, the experiment results show that a single polluter is capable of compromising all the system and its destructiveness is severe.
J. Cent. South Univ. (2012) 19: 2203-2217
DOI: 10.1007/s11771-012-1265-1![]()
WANG Hai-zhou(王海舟), CHEN Xing-shu(陈兴蜀), WANG Wen-xian(王文贤), HAO Zheng-hong(郝正鸿)
Network and Trusted Computing Institute, College of Computer Science, Sichuan University,Chengdu 610065, China
? Central South University Press and Springer-Verlag Berlin Heidelberg 2012
Abstract: With the great commercial success of several IPTV (internet protocal television) applications, PPLive has received more and more attention from both industry and academia. At present, PPLive system is one of the most popular instances of IPTV applications which attract a large number of users across the globe; however, the dramatic rise in popularity makes it more likely to become a vulnerable target. The main contribution of this work is twofold. Firstly, a dedicated distributed crawler system was proposed and its crawling performance was analyzed, which was used to evaluate the impact of pollution attack in P2P live streaming system. The measurement results reveal that the crawler system with distributed architecture could capture PPLive overlay snapshots with more efficient way than previous crawlers. To the best of our knowledge, our study work is the first to employ distributed architecture idea to design crawler system and discuss the crawling performance of capturing accurate overlay snapshots for P2P live streaming system. Secondly, a feasible and effective pollution architecture was proposed to deploy content pollution attack in a real-world P2P live streaming system called PPLive, and deeply evaluate the impact of pollution attack from following five aspects: dynamic evolution of participating users, user lifetime characteristics, user connectivity-performance, dynamic evolution of uploading polluted chunks and dynamic evolution of pollution ratio. Specifically, the experiment results show that a single polluter is capable of compromising all the system and its destructiveness is severe.
Key words: peer-to-peer technology; internet protocol television; active measurement; distributed crawler; pollution attack; PPLive
1 Introduction
With the growing maturity of P2P technology, a wide variety of distributed applications which have been emerged become more and more popular recently, including file-sharing systems, audio-based VOIP systems, and video-based IPTV (internet protocol television) systems. IPTV technology has been restricted by low broadband penetration in the past; however, the rapid and large-scale popularization of broadband technology makes it possible to become the next disruptive IP communication technology, which will greatly revolutionize people’s lives and entertainment.
Recently, there have been several applications using the data-driven mesh-pull architectures which gained great success commercially, including CoolStreaming, PPLive, PPStream, QQLive, and UUSee. PPLive system is one of the most popular instances of IPTV applications, which was reported that more than 2×10⁷ online viewers joined the PPLive network during the Chinese New Year 2010. As early as August 2005, there have been over 5×10⁶ simultaneous viewers attracted by the popular Chinese entertainment show “Super girls”, which hits the highest record in this industry field [1]. What’s more, during the Chinese New Year 2006, HEI et al [2] obtained a result that the peak number of simultaneous viewers approached 2×10⁷ from 14 PPLive channels which broadcast the event in the experiment. As data-driven mesh-pull architecture plays such an important role towards the commercial success of P2P live streaming system, it is critical to understand the system architecture of those large-scale P2P streaming systems comprehensively and then study various security threats with which they confront.
Because of rapidly increasing popularity of PPLive, the possibility of suffering potential security threats from various fields tends to increase. Some pollution schemes have been put into practice in P2P file sharing systems [3-4]. P2P file sharing systems are prone to be attacked because of the decentralized and non-authenticated nature. A malicious attacker may confuse targeted resources first criticizing the resources useless or tortious, and then publish a large number of polluted resources attracting some naive users to download. Those naive users who cannot distinguish the polluted resources from pureness will also forward the resources to other unsuspecting users. In this way, the polluted resources spread through the global P2P file sharing systems eventually. These malicious techniques used in P2P file sharing systems could also be applied to P2P live streaming systems [5].
While undertaking detailed measurement study about this IPTV system, we were confronted with a few challenges owing to its commercial nature. First of all, PPLive is a proprietary protocol, which means that there are scarcely source codes or official documents published, and we have to develop the dedicated crawler to harvest peers and evaluate the impact of pollution in this live streaming system by analyzing packet traces and decoding the protocol. Secondly, with the software developer safety consciousness enhanced and the client software version updated periodically, encrypt technology has been applied in communication protocol partly to guard the critical contents of PPLive system. To solve this problem, we used reverse engineering method to decompile the target application and decrypt the critical algorithm by analyzing the original assembly instructions. Finally, it is difficult for crawler to probe all the peers due to the NAT (network address translation) problem and network congestion, which does not respond to our requests at all. Tracker servers and each ordinary peer maintain a list of peers watching the given channel; naturally, the number of peers which servers own far exceeds the latter. As proved to be feasible [2], we can harvest almost all the peers’ accurate information from tracker servers and partner peers depending on appropriate measurement intervals.
2 Related work
There have been several studies about pollution attack deployed in P2P file sharing systems. LIANG et al [3] undertook a measurement study on content pollution in a very popular P2P file sharing system called KaZaA, which showed that the pollution was pervasive for recent popular songs and up to 50% versions were polluted. The authors also described some anti-pollution mechanisms to guard against these attacks. LIANG et al [6] discovered that both structured and unstructured P2P file sharing systems were highly vulnerable to the index poisoning attack. CHRISTEN et al [7] carried out a measurement study of impact on content availability in the four most popular P2P file sharing networks suffering from pollution and poisoning. The results showed that the injection of a small number of decoys could seriously impact the users’ perception of content availability.
HARIDASAN and RENESSE [8] discussed different attacks to which multicast streaming systems were vulnerable, including forgery, DoS, membership and omission attacks. The authors also proposed and evaluated an intrusion-tolerant P2P live streaming system called secure-stream to guard against these attacks. WANG et al [9] investigated the DoS attacks in P2P streaming and proposed ripple-stream to safeguard the system from such an attack. CONNER et al [10] presented a framework, named Oversight, for preventing both selfishness and DoS attacks in P2P streaming system. Their simulations showed that the Oversight protocol was effective for reducing the number of requests granted to attackers and thus preventing DoS attacks. However, none of the above studies considered the content pollution attacks in P2P live video streaming.
YANG et al [11] presented the first system model capturing the effects of content pollution in P2P live streaming systems and demonstrated that the most crucial factor in content pollution was not the number of polluters but the access bandwidth and the degree of participating peers. BORGES et al [12] evaluated the impact of pollution attack in P2P live streaming and presented two reputation systems to avoid content polluted dissemination and isolate malicious peers. Further measurement studies were undertaken in Ref. [13], where the authors proposed a decentralized reputation system to fight attacks in P2P live streaming networks which is simpler and could also be much more effective than previously proposed mechanisms. LIN et al [14] presented a simulation system named SPoIM to study the impact of pollution attack under various network settings and configurations. HU et al [15] proposed a joint pollution detection and polluter identification system to defend pollution attacks in P2P live streaming and the simulation results showed that the proposed system can effectively resist pollution attacks while minimizing the user’s computation overhead. However, the above studies about content pollution weren’t deployed in a real P2P live streaming.
DHUNGEL et al [5] firstly carried out an experiment in a real system and the results showed that the video playback quality could be significantly affected by content pollution. Moreover, the authors proposed some solutions to defend the pollution. However, their research work only focused on the evolution of participating users and the chunk download/upload rate during pollution attack period. And the further measurement works for the live streaming system under pollution attack have not been conducted. Their measurement work was significantly extended to evaluate the impact of pollution attack in P2P live streaming.
Our work is different from previous works: 1) A detailed distributed crawler system architecture was presented and its crawling performance was analyzed, which can be used to evaluate the impact of pollution attack in P2P live streaming; 2) A feasible and effective pollution architecture was proposed to deploy content pollution attack in a real-world P2P live streaming system; 3) The impact of pollution attack in P2P live streaming was deeply evaluated from the following five aspects: dynamic evolution of participating users, user lifetime characteristics, user connectivity-performance, dynamic evolution of uploading polluted chunks and dynamic evolution of pollution ratio.
3 Overview of PPLive
Before undertaking the pollution measurement for PPLive, we describe its basic architecture briefly at first, including two major application level protocols: peer discovery protocol based gossip-like mechanism and video distribution protocol. The knowledge of those two protocols is the foundation to develop the distributed crawler system and undertake pollution attack. It is a challenging task for us because there are scarcely source codes or official documents published. Furthermore, some encrypt technologies have been applied in communication protocol partly to guard the critical contents for some new PPLive client versions, which makes us use reverse engineering method to study this system. To the best of our knowledge, most of existing measurement studies for PPLive are based on older unencrypted proprietary protocol by analyzing packet traces [16-18], while our current research work is the first to undertake measurement studies for new encrypted protocol PPLive version. The following description aims at a better understanding of the mechanisms used by such a large-scale P2P live streaming system, despite their use of proprietary unpublished protocols.
3.1 Peer discovery protocol
Figure 1 shows the procedure that an ordinary peer joins the PPLive network to harvest peers: 1) The local peer requests the latest channel file from channel-list servers and updates it immediately after lunching the PPLive client; the list of channel includes channel name, channel GUID (globally unique identifier) which is the most important identification of signal communication among peers, channel descriptions and so on; 2) After the local peer selects one channel to watch, the client registers itself to the tracker servers and sends out multiple query messages to the servers, generally five, to retrieve a small set of peers that are watching the same channel; 3) Upon receiving the initial list of peers, the local peer uses this seed peer list to harvest additional lists by periodically probing active peers which maintain a list of peers.
After harvesting enough peers, the client tries to connect the active ones to exchange video chunks, achieving playback of the appointed channel eventually. To deal with the churn of peers, the local peer needs to actively seek new peers from its existing partners to update peer lists. At the same time, it also re-broadcasts its current peer lists to its partner peers.
3.2 Video distribution protocol
As shown in Fig. 2, the process of PPLive video- chunks distribution is as follows:
Step 1: After accomplishing the update of the channel file and the discovery of peers, local PPLive client requests multiple buffer-maps from chunk- distributed servers and other partner peers. The chunk- distributed servers take charge of dividing origin video into a large number of media chunks for propagation. Buffer-map indicates the video content cached by peers currently and the playback process implicitly.
In more detail, each buffer map includes the offset, the length of the buffer-map, and a string of zeroes and ones indicating which chunks are available [19]. Similar to the update mechanism of peer-list in peer discovery protocol, local peer also exchanges the buffer-map with chunk-distributed servers and partner peers to ensure its content fresh.
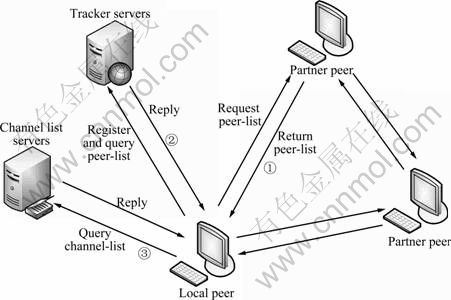
Fig. 1 Peer discovery protocol used in PPLive
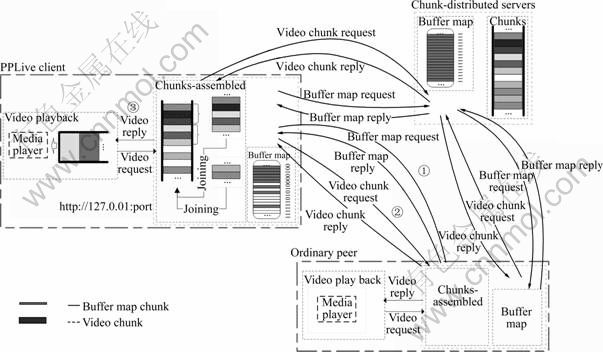
Fig. 2 Video distribution protocol used in PPLive
Step 2: Upon receiving a buffer-map, local peer grasps the offset and the string of zeroes and ones so as to request high priority chunks continuously using certain scheduling algorithms. In particular, three typical principles need to be followed: First of all, the chunks that will be played right now should be given high priority; this principle is the significant foundation of the remainder; Secondly, the chunks which are rare in the P2P live streaming system should be also given high priority, which means that priority and amount of chunks present inverse relationship; In the end, the selection of the first chunk is prone to be random naturally because a peer needs to request the initial chunks as soon as possible when it just joins the P2P live streaming network and has no chunks to upload. Besides that, the download speed of rare chunks tends to be slower, and the cached chunks should be also uploaded to other partner peers who are watching the same channel simultaneously.
Step 3: After harvesting sufficient chunks, the client assembles the chunks in regular sequence into some larger media blocks and buffers them in memory in the form of streaming file. As new chunk continually arrive at the client, it continually adds chunks data to the streaming file. Once the length of buffered contiguous streaming file exceeds the threshold value, the PPLive client launches a local media player (such as Windows media player, Real player), and buffers the received video using its immanent buffering mechanisms. The media player makes HTTP request to the PPLive client which is regarded as a local video streaming server tentatively for video content. When it has cached enough video content, the playback starts immediately.
4 Measurement methodology
A distributed crawler system was proposed to harvest overlay snapshots of PPLive overlay network and evaluate the impact of pollution attack in this P2P live streaming system, which continuously tracks the participating peers simultaneously being online during our measurement period. Our measurement methodology based on active crawler was not the first attempt to measure the global view of the P2P overlay network, which had been conducted in measurement studies for P2P file sharing systems. SAROIU et al [20] were the first to undertake a topology measurement study in two popular peer-to-peer file sharing systems by active crawling method, namely GNUTELLA and NAPSTER. Subsequently, RIPEANU et al [21] developed a distributed crawling strategy to reduce the crawling time of gathering the topology snapshots of GNUTELLA network. Undertaking measurement studies on proprietary P2P file sharing system is a great challenge for researchers. LIANG et al [22] deployed active crawling to reveal in-depth understanding of the overlay structure and dynamics of KaZaA, which is a proprietary protocol that encrypts its signaling messages. However, above research works did not verify the accuracy of their captured snapshots. STUTZBACH et al [23-24] described fundamental challenges in capturing accurate snapshots, presented a detailed characterization of P2P overlay topologies and their dynamics, and demonstrated that inaccurate snapshots can lead to erroneous conclusions.
There are also a number of measurement studies based on active crawler deployed in P2P streaming systems. HEI et al [2] developed a dedicated user crawler and conducted an active and passive measurement studies for PPLive. Their research work mainly focused on user behaviors and traffic profiles at packet, connection and application levels. The result of crawling a popular channel with about 1 200 simultaneous users showed that their crawler can find 95% of peers within 5 s; therefore, the authors set the fixed crawling duration within a round to 15 s ignoring the channel size, which is a serious weakness because the crawler might not obtain the entire population within 15 s for some very popular channels. For example, in our experiment, the distributed crawler spent about 38 s in tracking a very popular channel with 6 000 online users. Another significant research work based on active crawler was presented by VU et al [18, 25]. The authors conducted active measurements on the overlay characteristics of the PPLive system and derived mathematical models for the distributions of channel population size and session length. The channel GUID was fed as an only input argument to the crawler [25]; however, our knowledge of reverse analysis for PPLive channel play-link (each channel has a unique play-link) revealed that different PPLive channels only have part of common tracker servers. That is to say, the input arguments provided to crawler without tracker servers probably affect the accuracy of measurement results. Furthermore, their crawler had to spend 3-8 min in collecting single topology snapshot. It was a very long time compared with the result in Ref. [2] and ours, which would affect accuracy of topology snapshots seriously because of the high dynamic nature of overlay topologies [21] and probably led to erroneous conclusions [23]. LI et al [26] developed an active crawler to capture topology snapshot of PPLive overlay and characterized its degree distribution, clustering coefficient, network diameter, characteristic path length, connectivity matrix and reciprocity coefficient; however, the authors still did not use distributed architecture idea to design their crawler system and improve its crawling performance. The measurement results revealed that their crawler had to spend almost 8 min in tracking a popular channel with about 5 500 simultaneous users.
The dedicated distributed crawler system for PPLive developed by us is obviously different from previous crawlers [2, 25-26] in that: 1) Our crawler stops depending on channel size and interval of sending peer-list request instead of setting fixed crawling duration. 2) We used reverse engineering method to study PPLive channel play-link which is a string of encrypted text beginning with “synacast://” and extracted channel GUID, tracker servers, channel name and other important information from it. Therefore, our crawler accepted PPLive channel play-link as the input argument instead of single channel GUID. 3) The distributed crawler system architecture idea that inspired by the one proposed in Ref. [24] is to achieve a high degree of concurrency since the accuracy of capturing overlay snapshots depends on the crawling speed. The measurement results revealed that our crawler could track a very popular channel with about 6 000 simultaneous users within 40 s.
4.1 Distributed crawler system architecture
From the knowledge of the measurement studies for P2P file sharing system presented in Refs. [24-25], the accuracy of captured overlay snapshots depends on the crawling speed because of the high dynamic nature of P2P overlay network. Therefore, we developed a fast and efficient distributed crawler system, which could capture significantly more accurate snapshots of the PPLive overlay network than previous crawlers [2, 25-26]. In our experiment, the distributed crawler system was deployed on six PCs with two 2.60 GHz Pentium(R) CPUs and 1 GB memory at Sichuan University of China with 10/100 Mbps ethernet network access. The detailed distributed crawler system architecture is plotted in Fig. 3.
4.1.1 Crawler controller
Crawler controller accepts the PPLive channel play-link as input argument of crawling startup, and then extracts channel GUID and tracker servers by using reverse engineering method. The channel GUID is a crucial portion to construct query messages for retrieving peer-list from tracker servers or partner peers. At the beginning of crawling, the crawler controller implements Step 2 of Fig. 1 to retrieve the initial set of peers from tracker servers and then coordinates among multiple independent crawler hosts. In more detail, the crawler controller assigns part of the initial peers to each crawler host and waits for the crawling results from them by using asynchronous communications. Each crawler host then probes these seed peers to harvest additional peer lists and reports crawling results to crawler controller. The distributed crawler system uses adaptive scheduling algorithm to ensure that each crawler host remain busy, which is of crucial importance for making full use of the heterogeneous processing capabilities of various crawler hosts.
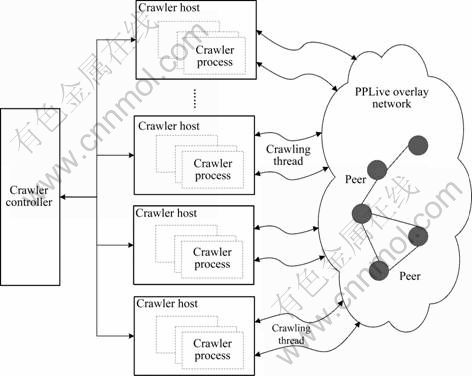
Fig. 3 Distributed crawler system architecture
4.1.2 Crawler host
After receiving seed peers from crawler controller, each crawler host implements Step 3 of Fig. 1 to harvest peer-list in parallel. Upon accomplishing the mission for tracing seed peers, the crawler host then reports crawling results to crawler controller and waits for new missions. Crawler hosts are independent crawlers to explore different parts of single channel overlay network. Additionally, to achieve a high degree of concurrency, each crawler process creates multiple crawling threads that can independently harvest peer lists from PPLive overlay network.
4.2 Overlay snapshots crawling algorithm
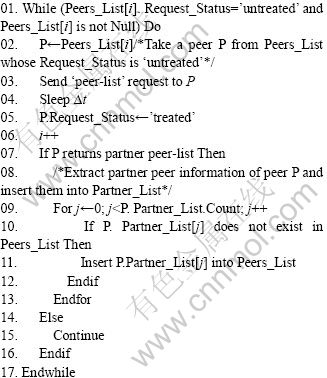
At the beginning of actual crawling, the crawler initializes an empty linked list named Peers_List first, which is used to save peer information that has been harvested. The Peers_List has four fields including peer IP address, peer TCP port, peer UDP port and request status. The partner peers of one peer are stored with another linked list, namely Partner_List. Subsequently, the crawler extracts tracker servers information from given channel play-link and inserts them into Peers_List in regular sequence. The crawling algorithm for PPLive overlay snapshots is described as follows:
Algorithm 1: PPLive overlay snapshots crawling algorithm
Input: PPLive channel Play-Link
Output: snapshots of given channel overlay network
Initialization: Peers_List←nil; Partner_List←nil; i←0; Peers_List←Tracker_Servers
The detailed crawling algorithm procedure is plotted in Fig. 4. From Fig. 4, it can be observed that there are various elements of PPLive overlay network, specifically, peer A is the crawler node, peer B and peer C are tracker servers, and the rest of peers are ordinary peers. In the initial round, the tracker servers B and C can be extracted by decrypting the channel play-link with reverse engineering method.
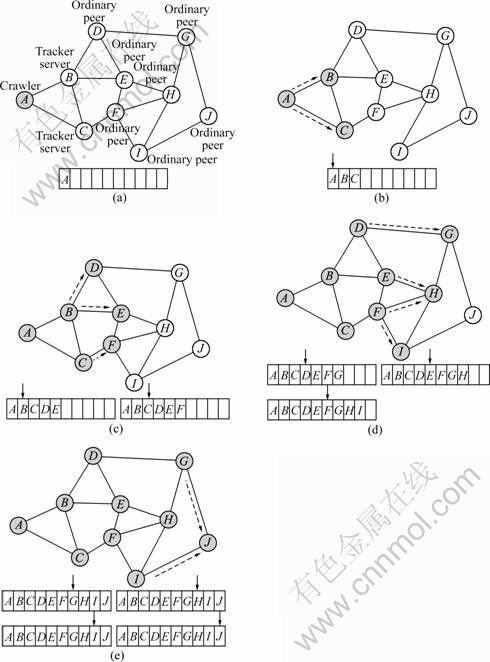
Fig. 4 Peer crawling algorithm: (a) Various elements of PPLvie overplay; (b) Initial round; (c) First round; (d) Second round; (e) Third round
In the first round, the crawler retrieves the initial set of peers from two tracker servers B and C, and inserts them to Peers_List. The initial peers return from tracker server B including peers C, D, and E. Naturally, the crawler just inserts peers D and E into Peers_List because peer C has existed in this linked list. Subsequently, the crawler changes status of peer B as treated. Similarly, the peers B and F returned from tracker server C are inserted into Peers_List in regular sequence; in the meantime, the peer C is marked as treated-peer.
The last two rounds also follow the above crawling principles, which include: 1) Only the non-repeated peers gained from partner peer are inserted into Peers_List, respectively; 2) The peers that have been accessed are marked as treated-peer and no longer requested; 3) When the peer requested by crawler currently is the last one of Peers_List and partner peers returned from this peer have already existed in Peers_List, the process of crawling stops. As shown in Fig. 4(e), the peer J is at the tail of Peers_List and none of the peers G and I is new peer; therefore, the crawling is over.
Our crawling algorithm is significantly different from previous research work [2, 25]. The measurement results reveal that our crawler is much better than those in speed and efficiency of capturing accurate PPLive overlay snapshots.
4.3 Crawler performance evaluation
To present the crawling performance in speed and efficiency of capturing PPLive overlay snapshots, we showed several definitions to evaluate the completeness of crawling results and efficiency of crawler. Due to the mismatch between the arrival and departure lags [2], the peer number of crawling results may overestimate the real active peers. In addition, it is a challenge for crawler to probe all the peers due to the NAT problem and network congestion, which may not respond to peer-list requests at all. As proved to be feasible [2], we can harvest almost the information of all the peers from tracker servers and partner peers depending on appropriate measurement intervals. The notations are listed in Table 1. From the above crawling algorithm proposed, we can know that:
![]() (1)
(1)
The completeness of crawling results ρ is defined as
![]() (2)
(2)
It is impossible for us to obtain the precise number of peers in channel κ overlay network, because just only the PPLive providers can know this information by their own platform. However, we can obtain this approximate number by setting appropriate measurement intervals in our experiment. With the method of curve fitting, we discovered a certain quadratic functional relationship between Δt and Tκ as follows:
![]() (3)
(3)
Consequently, we defined the efficiency of crawler system as
![]() (4)
(4)
That is, the efficiency of a crawler will increase with the reduction of Δt. Therefore, we implemented a comparative experiment by respectively setting Δt as 0, 1, 3, 5 and 10 ms to choose a suitable parameter. We presented how the number of the participating users evolves for a very popular channel with the different intervals of sending peer-list request, as shown in Fig. 5.
Table 1 Notations
From the experiment results shown in Fig. 5, it can be observed that: 1) If Δt=0 ms, the process of crawling stops within 10 s, however, the crawler could only harvest about 2 000 peers which had a large deviation compared with the real value; 2) As the value of Δt increased, the overall crawling time also grew; 3) When Δt=1 ms or Δt=2 ms, the crawling time of two situations were both about 38 s, but the later reached faster convergence rate than the former; 4) As for Δt=10 ms, the process of crawling lasted about 94 s, which was too long to capture accurate overlay snapshots. Consequently, it can be concluded that Δt=2 ms is the most valuable interval of sending peer-list request to archive more accurate and complete crawling with relatively shorter period.
5 Pollution mechanism
5.1 Principle of pollution attack
In a P2P network, each peer has similar status in sharing resource that uploads the data and at the same time downloads them, which differs from the client- server model where communication is usually to and from a central server. In P2P file sharing system, the polluted files or chunks can be discarded owing to the perfect integrity verification mechanism. For example, in the BitTorrent protocol, the file is divided into pieces with typically 256 kB, which is further divided into blocks, preventing the polluted block propagating by checking the hash value of one entire piece [27]. Unfortunately, in the PPLive live streaming, there is no corresponding effective identification mechanism to ensure the polluted chunks detected so that the polluted content received by an naive peer affects itself, hence the peer forwards cached chunks to other unsuspecting users, and eventually, the polluted resource can maliciously spread through the P2P network.
In particular, a PPLive polluter registers itself in the given channel and retrieves all the peers that are watching the same channel. After trying to connect the active peers which are probed periodically, the polluter then broadcasts an especial buffer-map indicating a great quantity of chunks available to all the partner peers. Upon receiving chunks request, the attacker sends the polluted chunks which will be assembled in regular sequence into streaming file by PPLive client with other chunks receiving from ordinary peers instead of the natural ones to the victims, which can potentially affect the quality of the playback depending on the amount of the polluted data.
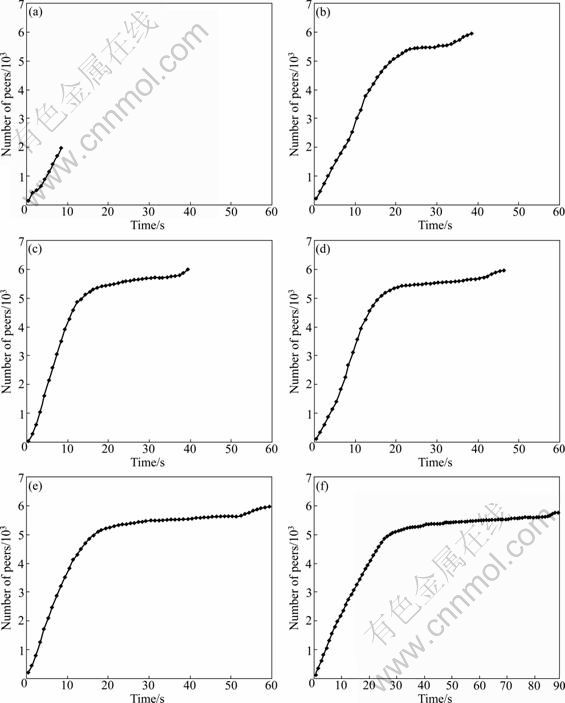
Fig. 5 Crawling results with different request intervals: (a) Δt=0 ms; (b) Δt=1 ms; (c) Δt=2 ms; (d) Δt=3 ms; (e) Δt=5 ms; (f) Δt= 10 ms
5.2 System architecture of pollution attack
The detailed pollution architecture of PPLive is described in Fig. 6. The progress of pollution diffusion is divided into the following four stages:
Step 1: The PPLive polluter requests the latest list of channels comprising channel GUID. In this experiment, we choose a very popular channel named “Doraemon” with the bit rate of 381 kbps and a chunk size of 1 024 bytes, attracting over 4 000 distinct users simultaneously being online at some peak times during our measurement period. The polluter is located at Sichuan University of China with 10/100 Mbps ethernet network access.
Step 2: As for the selected channel, the polluter registers in the peer-list servers to get the initial list of peers and then obtain as many peers as possible in the same channel network, which is similar to the work process of normal PPLive client. While doing the pollution experiment, we deploy a dedicated crawler of PPLive developed by us to collect the number of simultaneous viewers periodically watching the same channel whose sampling frequency is 60 s, which is also located at Sichuan University with the same ethernet network environment.
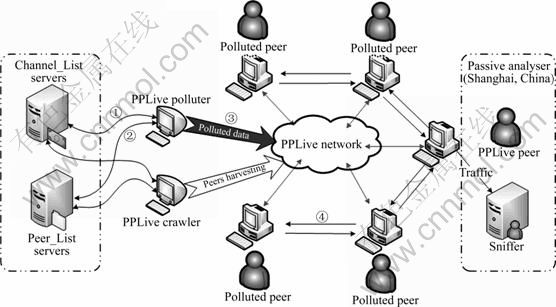
Fig. 6 Pollution architecture of PPLive
Step 3: After harvesting enough peers, the polluter will try to connect the active ones to broadcast a special buffer-map indicating a great number of video chunks available for the channel. As a result, the naive peers start to request the chunks from polluter. Upon receiving chunks request, the polluter sends the polluted chunks to the victims, which will be assembled in regular sequence into streaming file by PPLive client with other chunks receiving from ordinary peers instead of the natural ones. The polluter will also retrieve new peers from peer-list servers and its partner peers to update peers list periodically as normal PPLive client, over 5 min period.
Step 4: After harvesting sufficient video chunks, the victim peer will assemble the polluted chunks and normal ones in regular sequence into larger media blocks without any identification mechanism and then forward cached chunks to other unsuspecting users puerilely. At last, the polluted video chunks spread in the PPLive network rapidly and degrade the performance of the playback significantly.
To investigate the proceedings of the propagation, we deploy a packet sniffer to collect the polluted packets flowing through the peer located in Shanghai, China. The polluted chunks can be distinguished from the clean chunks easily because of the unique binary content constructed by us. Our experiment results revealed that the peer located in Shanghai had received polluted chunks about 46 s after the start of pollution attack.
6 Measurement results
The dynamic evolution of participating users and lifetime characteristics of peers during experiment periods were firstly described to show that the destructiveness of the pollution attack is severe. Then, the probable reasons why the number of peers is not below 500 during the pollution attack periods was presented by analyzing the connectivity-performance of users. The dynamic evolution of polluted chunks uploaded by polluter was investigated and an important measurement metric was proposed to study the effect of pollution attack.
6.1 Dynamic evolution of participating users
A popular channel named “Doraemon” was chosen for the experiment because this channel has a clear diurnal trend of the evolution of peers viewing channel, as shown in Fig. 7. By this way, we could make the result of the experiment prone to be more accurate. Figure 7 shows that the curves of the number of peers are very similar during the two measurement days. We also observe similar trends in other measurement days.
To understand the destructive effect of pollution attack for the service of playback, we present how the number of participating users evolves for the popular channel at pollution day and ordinary day, as shown in Fig. 8. We can firstly observe that curves of the number of peers are quite different for the two measurement days. Before the pollution attack launched, there are more than 3 000 users in this channel, however, during the attack period the number of viewers reduces to about 500 rapidly. It begins to appear a sharp decrease in the number of users about 5 min after the pollution attack launched at 19:00 which continues until 20:30. About 15 min later, the number of participating users decreases by about 53.5%; furthermore, about 67.5% decrease occurs 30 min later. We also carried out pollution experiments on other popular channels and obtained very similar pollution results.
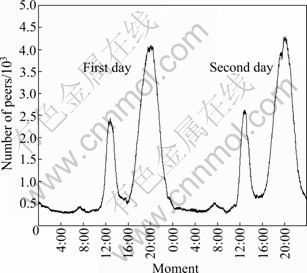
Fig. 7 Evolution of number of simultaneous users during two normal days
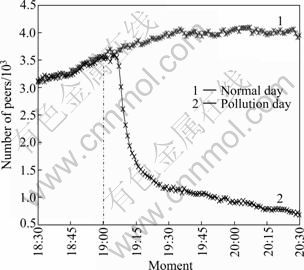
Fig. 8 Evolution of number of simultaneous users over normal day and experiment day
6.2 User lifetime characteristics
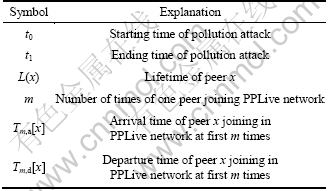
To present the destructive impact of pollution attack for the user behaviors of watching program from another side, we propose a concept of lifetime of a peer and show the great difference of the lifetime distribution between ordinary day and pollution day. In particular, the lifetime means the persistent period between the arrival and the contiguous departure of the peer over the PPLive network. The notations are listed in Table 2.
Table 2 Notations
In general, the lifetime of a peer watching some channels is mainly affected by following factors: channel popularity, viewing habits of users, network bandwidth, and quality of playback which is the most influential factor. Because the playback delay performance becomes unacceptable for a streaming service, it is very likely for the viewers to switch the channel. So, the effect of pollution attack approximately can be evaluated by the difference of the lifetime distribution.
Owing to the channel popularity and the habits of viewers, some peers may join the channel again after last departure during pollution period even though the quality of playback is too bad to watch, which will be defined as two different arrival and departure events. According to the three cases of arriving and leaving the channel, the lifetime of the peer x is defined, as shown in Fig. 9. The function L(x) can be defined as
 (5)
(5)
According to Eq. (5), 1) if a peer x arrives and leaves the channel during the pollution attack periods, then the lifetime of peer x (L(x)) is tm, d[x]-tm, a[x]; 2) If a peer x arrives at the pollution periods, leaves after it and the duration in the channel is not more than pollution periods, then the lifetime equals tm, d[x]-tm, a[x]; 3) If the previous two conditions are the same as the second case and the duration in the channel is much longer than pollution period, then the lifetime equals t1-t0.
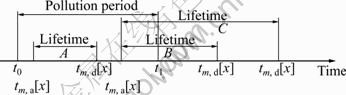
Fig. 9 Lifetime of peer x
We collect user information of arrival and departure employing the dedicated crawler of PPLive developed by us. Our measurement result shows that 16 105 distinct peers join the channel during the ordinary day and 15 912 distinct peers during the pollution attack periods. Furthermore, peer lifetime varies from very small values up to pollution time 90 min. Especially, there is also two peers remained in the channel throughout the pollution attack period. It can be inferred that those peers are chunk-distributed servers which will never leave the PPLive network. The peer lifetime distribution in Fig. 10 suggests that the continuous watching behaviors of viewers are affected seriously by pollution attack, and most of viewers prefer to stay shorter with the terrible service of playback. Our statistical result shows that 93.4% of peers have lifetimes shorter than 20 min at the pollution day; however, the number is only 68.8% at the ordinary day.
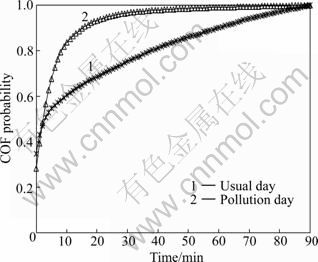
Fig. 10 Peer lifetime distributions for normal day and pollution day
6.3 User connectivity-performance
The dynamic change frequency of arrival and departure for peers could represent the stability of the PPLive network structure. By analyzing the rate of change of peers, it is able to quantify the stability of the system and know the impact of pollution attack in more detail.
Define a peer p with a three-tuple {ip_addr, tcp_port, udp_port}, where a peer is identified by a combination of IP address and TCP/UDP service port number. The period Δ is defined as sampling interval; t is the observation time; Cκ, t is the set of peers harvested by crawler at the time of t for channel κ.
![]() (6)
(6)
![]() (7)
(7)
where Rl(t) is the set of peers which leave between t and t+Δ, and Ra(t) is the set of peers which arrive between t and t+Δ.
We record the arrival event when the crawler finds a new peer joining in the experimental channel and the departure event when one old peer disappears for two sampling interval. We set the sampling interval Δ=60 s typically, which is proved to be able to reflect the connection dynamics well.
The number of peer arrivals and departures in minutes in the ordinary day is plotted in Fig. 11. It is shown that the evolution of arrival rate is similar to that of departure rate and the curve of evolution is quite smooth. The peer arrival and departure rate for the pollution day in Fig. 12 shows that there is a peak with departure rate occurring during experiment period, which means that a large number of peers leave the channel simultaneously due to pollution attacks. Especially, it begins to appear a sharp increase in the number of peer departure about 6 min after the pollution attack started at 19:00. At about 19:08, there appears a big peak, which indicates that nearly 600 peers leave the polluted channel simultaneously in a minute. After that, the number of peer departure reduces gradually but is always higher than arrival one until the end of pollution attack. It can be concluded that pollution attack affects the stability of the PPLive network structure significantly, which causes a large number of viewers to leave the channel due to the unacceptable streaming service.
By analyzing the rate of change of peers, we find the probable reasons why the number of peers is always not below 500 during the pollution attack periods as follows: 1) The pollution attack will not impact the rate of peer arrival associated with the daily watching habits of viewers, consequently, the order of magnitude of the peer arrival and departure is close about 20 min after the pollution attack launched; 2) Owing to the popularity and attraction of the channel, some stubborn and naive viewers rejoin the channel network constantly during the pollution attack periods although the quality of playback is too bad to watch.
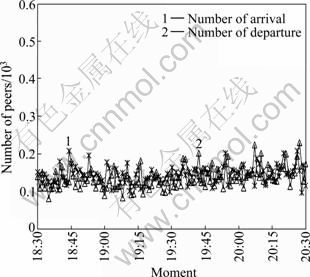
Fig. 11 Arrival/departure rate during ordinary day
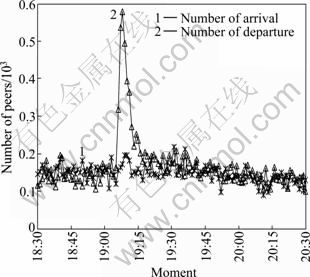
Fig. 12 Arrival/departure rate during pollution attack day
6.4 Dynamic evolution of polluted chunks and pollution ratio
During the period of pollution attack, the polluter broadcasts an especial buffer-map indicating a great quantity of chunks available to all the partner peers. Upon receiving chunks request, the polluter sends the polluted chunks to the victims, which will be assembled in regular sequence into streaming file with other chunks receiving from ordinary peers. To investigate the proceedings of the propagation for polluted chunks, we deployed a packet sniffer to collect the polluted packets flowing through the peer located in Shanghai, China. The experiment result showed that the peer located in Shanghai received polluted chunks about 46 s after the start of pollution attack. Furthermore, the quality of the playback was affected severely rapidly and the screen of PPLive client displayed to be frozen or black. As the amount of polluted data uploaded into PPLive overlay network can potentially affect the quality of the playback, we investigated the dynamic evolution of polluted chunks uploaded by polluter.
The number of polluted chunks uploaded by polluter in every minute is plotted in Fig. 13. It can be observed that consecutive spikes appear with a period of about 4 min on this curve. This suggests that the polluted video chunks provided by polluter in 2 min are sufficient for victims to be assembled into streaming file. However, the streaming file cannot be parsed by media player because of bogus chunks; hence, the victims will try to seek for fresh chunks data within a period of time. It also can be observed that it begins to appear a fast increase in the number of polluted chunks at the beginning of pollution attack. The peak appears at the 8th minute after the pollution attack launched, namely, uploading 131 990 chunks in 1 min. After that, the number of polluted chunks decreases slowly with a periodic trend. Consequently, the total amount of polluted chunks uploaded by the polluter is more than 6.5×10⁶ during pollution attack periods, which means that about 6.29 GB of bogus data spread into PPLive overlay network in 90 min. it can be found that the maximum rate of uploading data is less than 3 Mb/s, yet the polluter tries to broadcast an especial buffer-map to attract all the active partner peers. That means, in this experiment, the access bandwidth of polluter is not the most influential factor for faster progress of content pollution.
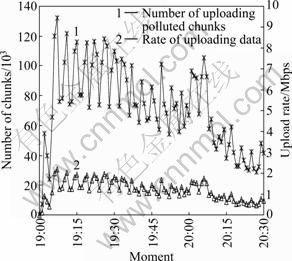
Fig. 13 Evolution of number of polluted chunks
Learning from the experiment result, we have observed that the destructiveness of the pollution attack is severe and a single polluter is capable of compromising all the system. To investigate how many percent of pollution data there are in PPLive overlay network which can lead to such serious consequences, an important metric was defined to study the impact of the pollution attack, namely “Pollution ratio”, the ratio of the number of polluted chunks to the number of overall chunks in the entire overlay network. This measurement metric indicates how effective the pollution attack is.
Let nt denote the total number of peers in entire overlay network at the time of t, which is the observation time. The period Δt is defined as the interval of two contiguous observation times. Denote m for the number of the polluters. In our experiment, just one polluter application was deployed since the most crucial factor in content pollution was not the number of polluters but the access bandwidth and the degree of participating peers [11]. Denote Rc for the bit rate of channel c; the target channel of pollution attack is named “Doraemon” with the bit rate of 381 kbps. Denote Pi, c for the number of bits for the need of peer i under smooth playback of channel c. We can get the overall chunks in the entire network at time of t roughly from the total number of Pi, c for all peers. Denote μj(t) for the number of polluted chunks uploaded by the j-th polluter at the time of t. Let k denote the number of bytes for a single polluted chunk. Consequently, the ratio of the number of polluted chunks to the number of overall chunks in the entire network is given as
 (8)
(8)
The evolution of pollution ratio during pollution period is shown in Fig. 14. It can be firstly observed that it begins to appear a sharp increase in the number of pollution ratio after the pollution attack starting at 19:00. About 6 min later, the value of pollution ratio reaches 1.18%; after that, that value is always in the range of 1.34%-4.08% during the rest time of pollution attack. It can be concluded that a small quantity of pollution data can cause the unacceptable streaming service and affect the entire overlay network significantly.

Fig. 14 Evolution of pollution ratio
7 Conclusion and future work
1) The destructiveness of the pollution attack is severe and a single polluter is capable of compromising all the system. Before the pollution attack launches, there are more than 3 000 users in this channel, however, the number of viewers reduces to about 500 rapidly during the attack period. That is because the video playback quality could be significantly affected by content pollution and most of viewers have to leave the channel overlay finally.
2) In order to present the destructive impact of pollution attack from another side, a concept of lifetime of a peer is proposed. The experiment results show that the continuous watching behaviors of viewers are affected seriously by pollution attack, and most of viewers prefer to stay shorter with the terrible service of playback.
3) The pollution attack will not impact the rate of peer arrival associated with the daily watching habits of viewers; consequently, the order of magnitude of the peer arrival and departure is close about 20 min after the pollution attack launches. Owing to the popularity and attraction of the channel, some stubborn and naive viewers rejoin the channel network constantly during the pollution attack periods although the quality of playback is too bad to watch. The above two points are probably the main reason why the number of peers is always not below 500 during the pollution attack periods.
4) The investigation for the dynamic evolution of polluted chunks uploaded by polluter reveals that the access bandwidth of polluter is not the most influential factor for faster progress of content pollution and a small quantity of pollution data can cause the unacceptable streaming service and affect the entire overlay network significantly. To provide and evaluate the effective and flexible mechanism of reducing content pollution dissemination and to defend this attack in P2P live streaming are left for our future work.
References
[1] ZHANG X Y, LIU J C, LI B, YUM Y S P. DONet/cool streaming: A data-driven overlay network for peer-to-peer live media streaming [C]// Proceedings of 24th Annual Joint Conference of the IEEE Computer and Communications Societies. Miami, FL, USA: IEEE Press, 2005: 2102-2111.
[2] HEI X J, LIANG C, LIANG J, LIU Y, ROSS K W. A measurement study of a large-scale P2P IPTV system [J]. IEEE Transactions on Multimedia, 2007, 9(8): 1672-1687.
[3] LIANG J, KUMAR R, XI Y J, ROSS K W. Pollution in P2P file sharing systems [C]// Proceedings of 24th Annual Joint Conference of the IEEE Computer and Communications Societies. Miami, FL, USA: IEEE Press, 2005: 1174-1185.
[4] LIANG J, NAOUMOV N, ROSS K W. Efficient blacklisting and pollution-level estimation in P2P file-sharing systems [C]// Proceedings of AINTEC’05. Bangkok, Thailand: Springer Press, 2005: 1-21.
[5] DHUNGEL P, HEI X J, ROSS K W. The pollution attack in P2P live video streaming: Measurement results and defenses [C]// Proceedings of the 2007 Workshop on Peer-to-Peer Streaming and IP-TV. Kyoto, Japan: ACM Press, 2007: 323-328.
[6] LIANG J, NAOUMOV N, ROSS K W. The index poisoning attack in P2P file-sharing systems [C]// Proceedings of the IEEE INFOCOM’06. Barcelona, Spain: IEEE Press, 2006: 1-12.
[7] CHRISTIN N, WEIGEND A S, CHUANG J. Content availability, pollution and poisoning in file sharing peer-to-peer networks [C]// Proceedings of the ACM Conference on Electronic Commerce 2005. Vancouver, Canada: ACM Press, 2005: 68-77.
[8] HARIDASAN M, VAN RENESSE R V. Defense against intrusion in a live streaming multicast system [C]// Proceedings of the sixth IEEE International Conference on Peer-to-Peer Computing. Cambridge, UK: IEEE Press, 2006: 185-192.
[9] WANG Wen-jie, XIONG Yong-qiang, ZHANG Qian. Ripple-stream: Safeguarding P2P streaming against DoS attacks [C]// Proceedings of 2006 IEEE International Conference on Multimedia and Expo. Toronto, Ontario, Canada: IEEE Press, 2006: 1417-1420.
[10] CONNER W, NAHRSTEDT K, GUPTA I. Preventing DoS attacks in peer-to-peer media streaming systems [C]// Proceedings of Thirteenth Annual Multimedia Computing and Networking (MMCN’06). San Jose, California, USA, 2006: 155-168.
[11] YANG Si-rui, JIN Hai, LI Bo, LIAO Xiao-fei, YAO Hong, TU Xu-ping. The content pollution in peer-to-peer live streaming systems: Analysis and implications [C]// Proceedings of 37th International Conference on Parallel Processing. Portland, USA: IEEE Press, 2008: 652-659.
[12] BORGES A, ALMEIDA J, CAMPOS S. Fighting pollution in P2P live streaming systems [C]// Proceedings of 2008 IEEE International Conference on Multimedia and Expo. Hannover, Germany: IEEE Press, 2008: 481-484.
[13] VIEIRA A B, CAMPOS S, ALMEIDA J. Fighting attacks in P2P live streaming. simpler is better [C]// Proceedings of IEEE INFOCOM Workshops 2009. Rio de Janeiro, Brazil: IEEE Press, 2009: 1-2.
[14] LIN E, DE CASTRO D M N, WANG Mea, AYCOCK J. SPoIM: A close look at pollution attacks in P2P live streaming [C]// Proceedings of 2010 18th International Quality of Service. Beijing, China: IEEE Press, 2010: 1-9.
[15] HU B, ZHAO H V. Joint pollution detection and attacker identification in peer-to-peer live streaming [C]// Proceedings of 2010 IEEE International Conference on Acoustics Speech and Signal Processing. Dallas, Texas, USA: IEEE Press, 2010: 2318-2321.
[16] ALI S, MATHUR A, ZHANG H. Measurement of commercial peer-to-peer live video streaming [C]// Proceedings of the 1st Workshop on Recent Advances in Peer-to-Peer Streaming. Waterloo, Canada, 2006.
[17] HEI X J, LIANG C, LIANG J, LIU Y, ROSS K W. Insights into PPLive A measurement study of a LargeScale P2P IPTV system [C]// Proceedings of Workshop on Internet Protocol TV (IPTV) Services over World Wide Web in Conjunction with WWW2006. Edinburgh, Scotland, 2006.
[18] VU L, GUPTA I, LIANG J, NAHRSTEDT K. Measurement and modeling of a large-scale overlay for multimedia streaming [C]// Proceedings of the 4th International Conference on Heterogeneous Networking for Quality, Reliability, Security and Robustness & Workshops, QSHINE’07. New York: ACM Press, 2007.
[19] HEI X J, LIU Y, ROSS K W. Inferring network-wide quality in P2P live streaming systems [J]. IEEE Journal on Selected Areas in Communications, 2007, 25(10): 1640-1654.
[20] SAROIU S, GUMMADI P K, GRIBBLE S D. A measurement study of peer-to-peer file sharing systems [C]// Proceedings of the Multimedia Computing and Networking 2002 (MMCN 2002). San Jose, California, USA, 2002: 156-170.
[21] RIPEANU M, FOSTER I, IAMNITCHI A. Mapping the gnutella network: properties of large-scale peer-to-peer systems and implications for system design [J]. IEEE Internet Computing Journal, 2002, 6(1): 50-57.
[22] LIANG J, KUMAR R, ROSS K W. The fast track overlay: A measurement study [J]. Computer Networks, 2006, 50(6): 842-858.
[23] STUTZBACH D, REJAIE R, SEN S. Characterizing unstructured overlay topologies in modern P2P file-sharing systems [C]// Proceedings of the 5th ACM SIGCOMM Conference on Internet Measurement. Berkeley, CA, USA, 2005: 49-62.
[24] STUTZBACH D, REJAIE R. Capturing accurate snapshots of the gnutella network [C]// Proceedings of Global Internet Symposium. Miami, FL, USA, 2005: 127-132.
[25] VU L, GUPTA I, NAHRSTEDT K, LIANG Jin. Understanding overlay characteristics of a large-scale peer-to-peer IPTV system [J]. ACM Transactions on Multimedia Computing, Communications and Applications, 2009, 6(4): 2010-2035.
[26] LI Chun-xi, LI Juan, QING Ye, CHEN Yi-shuan, CHEN Chang-jia. Measurement based P2P streaming media system topology analysis [C]// Proceeding of 2009 WASE International Conference on Information Engineering (ICIE 2009). Taiyuan, China: IEEE Press, 2009: 290-293.
[27] DHUNGEL P, WU Di, SCHONHORST B, ROSS K W. A measurement study of attacks on BitTorrent lechers [C]// Proceedings of the 7th International Workshop Conference on Peer-to-Peer Systems (IPTPS’08). Tampa Bay, Florida, USA: ACM Press, 2008: 1-5.
(Edited by DENG Lü-xiang)
Foundation item: Project(2007CB311106) supported by National Basic Research Program of China; Project(242-2009A82) supported by National Information Security Special Plan Program of China
Received date: 2011-06-08; Accepted date: 2011-10-25
Corresponding author: CHEN Xing-shu, Professor, PhD; Tel: +86-13981857689; E-mail: chenxsh@scu.edu.cn

