Numerical method and model for calculating thermal storage time for an annular tube with phase change material
��Դ�ڿ������ϴ�ѧѧ��(Ӣ�İ�)2017���1��
�������ߣ��콨�� ������ ������ ����
����ҳ�룺217 - 226
Key words��natural convection; energy storage; modeling; heat transfer; mass transfer
Abstract: For calculating the thermal storage time for an annular tube with phase change material (PCM), a novel method is proposed. The method is suitable for either low-temperature PCM or high-temperature PCM whose initial temperature is near the melting point. The deviation fit is smaller than 8% when the time is below 2��104 s. Comparison between the predictions and the reported experimental data of thermal storage time at same conditions is investigated and good agreements have been got. Based on this method, the performance of the thermal storage unit and the role of natural convection are also investigated. Results show a linear relation between the maximum amount of stored heat and thermal storage time, and their ratio increases with the height of the thermal storage unit. As the thickness of the cavity increases, natural convection plays an increasingly important role in promoting the melting behavior of paraffin. When the thickness of the cavity is small, natural convection restrains the melting behavior of paraffin.
J. Cent. South Univ. (2017) 24: 217-226
DOI: 10.1007/s11771-017-3422-z

LIU Fan-han(������)1, 2, XU Jian-xin(�콨��)1, 3, WANG Hui-tao(������)2, WANG Hua(����)1, 2
1. State Key Laboratory of Complex Nonferrous Metal Resources Clean Utilization, Kunming University of
Science and Technology, Kunming 650093, China;
2. Faculty of Metallurgical and Energy Engineering, Kunming University of Science and Technology,
Kunming 650093, China;
3. Quality Development Institure, Kunming University of Science and Technology, Kunming 650093, China
 Central South University Press and Springer-Verlag Berlin Heidelberg 2017
Abstract: For calculating the thermal storage time for an annular tube with phase change material (PCM), a novel method is proposed. The method is suitable for either low-temperature PCM or high-temperature PCM whose initial temperature is near the melting point. The deviation fit is smaller than 8% when the time is below 2��104 s. Comparison between the predictions and the reported experimental data of thermal storage time at same conditions is investigated and good agreements have been got. Based on this method, the performance of the thermal storage unit and the role of natural convection are also investigated. Results show a linear relation between the maximum amount of stored heat and thermal storage time, and their ratio increases with the height of the thermal storage unit. As the thickness of the cavity increases, natural convection plays an increasingly important role in promoting the melting behavior of paraffin. When the thickness of the cavity is small, natural convection restrains the melting behavior of paraffin.
Key words: natural convection; energy storage; modeling; heat transfer; mass transfer
1 Introduction
The imminent energy shortage and the high cost of energy have been scientific concerns for quite some time. The focal problem is the need to store excess energy that would otherwise be wasted and that could effectively improve energy utilization efficiency. There are mainly three thermal storage modes: sensible heat accumulation, latent heat accumulation, and thermochemical energy storage. The advantages of latent heat accumulation include a large volumetric density of heat accumulation, temperature stabilization, and easy control over the heat accumulation process. Therefore, latent heat accumulation is one of the heat accumulation technologies with the most potential, and so it has drawn much attention from many researchers [1-8].
The process of phase change is described by a particular kind of boundary value problem for partial differential equations, where the phase boundary can move with time. The question of predicting the behavior of phase change systems is difficult to resolve due to phase change systems inherent nonlinear nature at moving interfaces, for which the displacement rate is controlled by latent heat lost or absorbed at the boundary [9]. With the development of computer technology, numerical solutions are being quickly explored, and this vigorously pushes to the fore the question of phase change studies and progress. Numerical techniques can be broadly divided into weak numerical solutions and strong numerical solutions. Weak numerical solutions are much simpler than strong numerical solutions, yet are reasonably accurate. The enthalpy method and equivalent heat capacity method are two widely used techniques for weak numerical solutions. The enthalpy method can deal with both mushy and isothermal phase change problems, but the temperature may oscillate with time at a typical grid point (more detail in Section 3.1). The equivalent heat capacity method generates results. The equivalent heat capacity method generates results without oscillations, but it has difficulty in handling cases where the phase change temperature range is small [10]. To overcome these drawbacks, CAO and FAGHRI [11] proposed an improved equivalent heat capacity method, the temperature transforming model, wherein the enthalpy-based energy equation is converted into a nonlinear equation with a single dependent variable. The main difficulty of this method is to keep velocity at zero in the solid phase. Currently, there are three widely used schemes for solid velocity correction: the switch-off method [12], the variable viscosity method [13], and the source term method [14, 15].
The low thermal conductivity of the available phase change material (PCM) requires the development of efficient heat exchangers. Many researchers have explored different conductivity enhancement techniques involving use of fins [16-18], porous matrix [19], or heat pipe [20, 21]. Many authors model this kind of exchanger as a concentric annular PCM storage, and it seems to be the common option. These authors suggest classification of concentric annular systems into two main categories: one in which PCM storage is vertically positioned and the heat transfer fluid (HTF) is injected from the top or bottom [22, 23] and one in which PCM storage is oriented horizontally [24-26]. Many researchers attempt to simplify studies on this subject by ignoring natural convection. However, it has been proved that natural convection is one of the major factors that affect the phase transition processes of solid-liquid PCMs [27] and that it plays an important role in heat transfer inside a PCM, especially during the charging period, based on experiments [16, 28, 29] and numerical solutions [30-33].
WANG [34] investigated the role of natural convection in the melting process of PCM. He pointed out that conduction is the major mechanism of heat transfer through PCM in the early stages of melting and that as the melting process continues, natural convection gradually becomes the main mechanism in the heat transfer. LONGEON et al [29] built an experimental loop that facilitates storage and recovery of energy in an annular PCM heat exchanger placed vertically. The HTF can be injected from both extremities. The flow inside the liquid PCM was solved with a computational fluid dynamics software code to explain the experimental phenomena. Longeon recommended top injection for charge and bottom one for discharge. BERGMAN et al [20] performed experimental and numerical investigations of melting and solidification involving a heat pipe acting in conjunction with metal foils. He found that the melting (solidification) rates associated with the heat pipe foil configuration are approximately 300% (900%) higher than those of a bare copper rod of the same physical dimensions as the heat pipe based on melting (solidification) time. A similar work was conducted by LORENTE et al [35], but a different derivation process was used. The results in Ref. [35] indicate that theoretical analysis of the PCM melting process with natural convection in concentric annular PCM storages, depend on numerical simulations, might be sufficient to predict the duration of the entire phase change process. However, because we are interested not only in obtaining the duration, some comparisons of experimental data were performed.
Inspired and motivated by WANG [34], LONGEON et al [29], SHARIFI et al [20], and LORENTE et al [35], we investigate the change rules of thermal storage time and to present an analysis of the role of natural convection and numerical simulations of the entire process. A new prediction method for thermal storage time is proposed for validating the thermal storage time predicted by theory, which lays a theoretical foundation for further research into phase change heat transfer.
2 Experiments setup
The reliability of numerical simulation is verified by experiments in Ref. [34]. The entire system includes a thermal storage unit, a temperature measuring system, a circulating water system, and a heating system. The experimental system and distribution of the thermocouples in the thermal storage unit are shown in Fig. 1. The thermal storage unit is an annular PCM storage constituted of two concentric tubes. The water circulates inside the inner tube while the paraffin fills up the annular space. The physical properties of paraffin are listed in Table 1.
The thermal storage unit is vertically positioned and circulating water is injected from the bottom. The thermal storage unit is made of plexiglass, with an outer diameter of 90 mm and a thickness 5 mm. Heat preservation materials are used to cover the thermal storage unit to reduce heat loss. The unit��s upper and bottom facets have 3 mm thickness. A few small holes are made in the upper and bottom facets of the unit so that the thermocouple bracket can be positioned accurately. Considering that the thermal expansion and contraction or deformation of the bracket materials may lead to an error in thermocouple positioning, we use two heatproof nickel chrome and nickel silicon thermocouple lines with diameters of 0.2 mm intertwined to build the bracket. The brackets are wrapped with insulating material. A galvanized pipe through the thermal storage unit, it forms the inner wall surface of the unit. The inner-wall temperature can be changed by adjusting the temperature of the circulating water. The temperature adjustment range is 50-100 ��C. Hot water is provided by a thermostatic water tank in the experiment. The water is pumped into the test section by a pump with a velocity of about 2 m/s. In the thermostatic water tank, the he inner wall has constant temperature during the melting process.
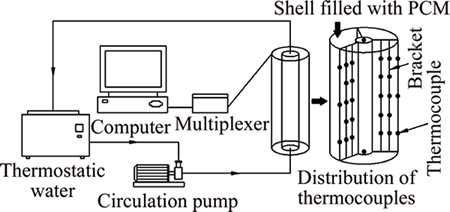
Fig. 1 Experimental system and installation of thermocouples in thermal storage unit
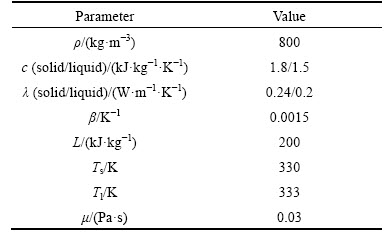
Table 1 Physical parameters of paraffin
We use copper-constantan thermocouples to measure the temperature distribution of paraffin. A total of 39 thermocouples are arranged in the paraffin. There are three symmetric measuring faces in the circumferential direction around the thermal storage unit, with 13 thermocouples installed in each face. To measure the water temperature, the thermocouples are arranged in the upper and lower ends of the galvanized pipe. The temperature difference between the two thermocouples is less than 1 ��C and use the resulting average temperature as the temperature of the inner tube. The thermocouples follow the bracket across the thermal storage unit and connected to a multiplexer Keithley, which can be programmed for control, to collect data every 15 min.
The experimental process has four steps: injecting paraffin, subsequent solidification with cooling, initializing temperature field, and melting. In the injection phase, paraffin is implanted into the tank four times so as to avoid deformation of the plexiglass and formation of air bubbles. Because paraffin has a relatively high melting point, the water temperature of a thermostatic water tank should be set around its melting point and heated to decrease the undercooling degree. The whole process takes about 6 h. After initialization of the temperature field, data are collected at intervals of 15 min. Repeated experiments precondition the re- establishment of the temperature field. This requires about 10 h. The collected data show a slight difference among the temperatures of three measuring points, which are of good symmetry. The mean of corresponding points is taken as the final measuring value to generate the temperature field of paraffin melting.
3 Simulation research
3.1 Numerical model
The melting process inside the thermal storage unit is conducted using commercial computational fluid dynamics software Fluent 6.3. To account for the physics of the timewise evolution of the flow at the phase boundary in fixed-grid methods, the well-known enthalpy-porosity model [36, 37] is employed. The greatest advantage of that method is that it does not need direct tracing of the position of phase boundary. A characteristic quantity represents the liquid proportion of the control volume by use of the liquid fraction. The liquid fractions are obtained from the enthalpy balance, and the position of phase boundary change is indirectly traced by the liquid fraction. For the mathematical description of a melting process, the following assumptions are made:
1) The thermophysical properties of the PCM are constant.
2) The Boussinesq approximation is valid; that is, the density changes caused by pressure are neglected, and the density changes that result from temperature are considered. Liquid density variations arise only in the buoyancy source term but are otherwise neglected.
3) Viscous dissipation is negligible.
4) The liquid is Newtonian and incompressible.
The thermal response of the PCM is governed by the following continuity, momentum, and energy equations.
Continuity equation:
 (1)
(1)
Momentum equation:

 (2)
(2)

 (3)
(3)

 (4)
(4)
The Buoyancy effect is included in the Sz when the gravity is along the negative z-axis. The source terms are introduced by VOLLER and PRAKASH [37]. They are defined as follows:
 (5)
(5)
 (6)
(6)
 (7)
(7)
 in the liquid zone (f =1); it tends to infinity in the solid zone (f=0). Am has a large value in order to ensure a smooth transition between the solid and liquid regions, and it can be considered as porous media permeability. �� is a small value to prevent division by zero when f=0. In this work, Am=108 kg/(m3��s) and ��=0.0001 are used [25].
Energy equation:

 (8)
(8)
In these relations, u, v, and w are the velocity components in the x, y, and z directions, respectively; �� is the PCM��s density; c is the specific heat capacity; P is the pressure; �� is the dynamics viscosity of PCM; keff is the effective thermal conductivity; g is the acceleration due to gravity; T is the temperature; T0 is the reference temperature; �� is the thermal expansion coefficient; L is the latent heat of fusion; and f is the volume fraction of liquid. Therefore, the liquid fraction can be defined as
 (9)
(9)
where Tl is the liquidus temperature and Ts is the solidus temperature.
The thermal storage unit mesh model is created in business preprocessor software Gambit 2.3. It is also used for labeling the boundary conditions and determining the computational domain for the mesh model. The mesh model and experimental model share the same effective size, with inner diameter of 26 mm, outer diameter of 80 mm, and height of 120 mm. The mesh evaluation of maximum cell squish, maximum cell skewness, and maximum aspect ratio are 2.15977��10-1, 4.18080��10-1, and 1.01261��10-1, respectively, as shown in Fluent 6.3. A grid independence test is carried out by analyzing the effect of grid number on the thermal storage time. The change of result is little when the grid number increases from 11420 to 65016, as shown in Fig. 2. The model with 11420 computational elements is applied, which is considered sufficient for the needs of operation speed and accuracy.
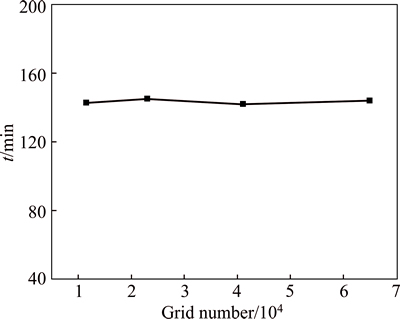
Fig. 2 Result of grid independence test
Under the experimental conditions of this study, the temperature drop of HTF can be neglected. The initial temperature of the paraffin is set to 293 K. Thus, the temperature of the heat transfer tube can be regarded as 343 K, and the outer wall of the thermal storage unit is heat insulated. Gravity may be set based on whether the phase transition region considers natural convection. The finite volume method is used to discretize the governing equations. The SIMPLE algorithm is used to couple continuity and momentum equations, the second-order upwind difference scheme for the momentum and energy equations, and the PRESTO scheme for the pressure equation. The under-relaxation factors of pressure, momentum, and energy are 0.3, 0.4, and 0.8, respectively. Convergence criteria are set at 10�C3 for momentum and 10�C6 for continuity and energy to ensure the convergence of equations. The time step is set to 1 s and is found reliable for the simulation.
3.2 Numerical results
The most average initialized temperature field group among the repeated experiments [34] is selected and compared with the temperature field in the melting process of paraffin in the simulation, as shown in Fig. 3 and Fig. 5. Preheat must be simulated in order to create a suitable initial temperature field. The comparison shows little discrepancy and validates the simulation. Affected by heat dissipation, the temperature of the outer-wall area in the temperature field is lower than the temperature of simulation.
The melting process without regard for natural convection is shown in Fig. 4(a). The phase boundary in the melting process of paraffin is vertical, which means that there is no heat transfer in the vertical direction. Because paraffin has a low heat transfer coefficient, its melting rate decreases with increasing thermal storage time, which makes the moving rate of the phase boundary slower. The melting process with natural convection is shown in Fig. 4(b). The temperature difference causes density differences in the liquid paraffin in the process of melting. At high temperatures, the density of liquid paraffin is lower than at low temperature. The liquid paraffin at high temperature accumulated in the upper portion of the heat storage unit, under the influence of natural convection, leading to the upper part of the paraffin melting quickly, so that the phase boundary is clearly deflected. The obtained phase boundary matches that in the reference literature [31, 38], and the angle between the horizontal and the phase boundary became gradually smaller as the melting process continues.
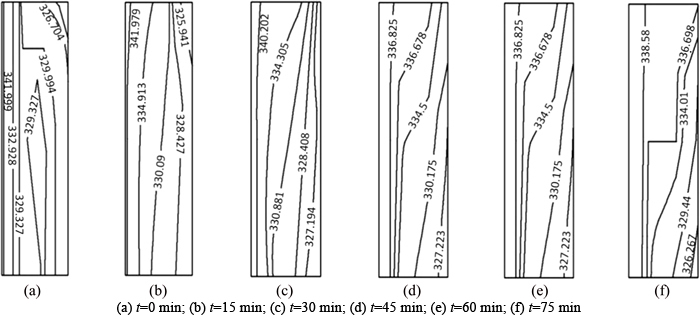
Fig. 3 Experimental temperature field (K) [34]:
The fluid moves inside the liquid paraffin as shown as Fig. 5. At the initial melting stage, a little paraffin is melted, and heat transfer is realized mainly by heat conduction. With increasing liquid paraffin, naturalconvection gradually became the main mechanism of the heat transfer and dramatically accelerated the melting behavior of paraffin [18, 39]. The temperature of liquid paraffin close to the heat transfer tube is higher and thus the liquid paraffin flowed up. The liquid paraffin close to the outer wall flowed down, so it form a convective vortex. At the late melting stage, most of the paraffin is melted, and there may be more convection vortex at different heights. The vortex area has good isothermal properties, so the temperature has a layered distribution in vertical direction. This causes a dead zone wherein the paraffin is difficult to melt at the bottom of the thermal storage unit. Temperature and flow fields have good synergies, which together determine the shape of the phase boundary.
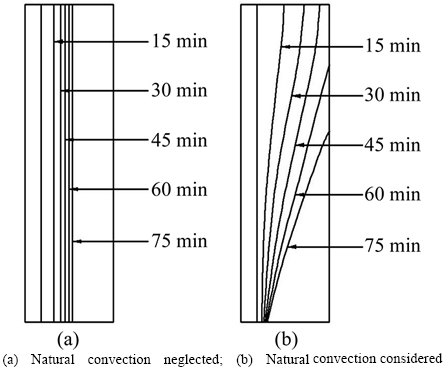
Fig. 4 Phase boundary change with time in melting process of paraffin:
Phase boundary movement includes horizontal expansion and vertical expansion. The phase boundary is classified into vertical and horizontal directions in Ref. [35]. There are two possibilities for making the paraffin melt completely. When the height of the heat storage unit is small, the phase boundary reaches the bottom first. When the heat storage unit is large, the phase boundary reaches the outer wall first. When the height is critical height, the phase boundary reaches both the bottom and the outer wall at the same time, as shown in Fig. 6. Thus, the height of thermal storage unit is a critical factor for distinguishing two possibilities. If the inner and outer diameters of the thermal storage unit are fixed, when the height is less than the critical height, the phase boundary reaches the bottom first. The phase boundary needs to move a longer distance to accomplish regeneration with increasing height while an increase in the strength of natural convection does not make regeneration faster. The thermal storage time increases significantly with increasing height. When the height is more than the critical height, the phase boundary reaches the outer wall first. The phase boundary needs to move the same distance to accomplish regeneration, and natural convection intensity increases with increasing height (according to the definition of the Grashof number). The thermal storage time decreases slightly with increasing height under the influence of natural convection, as shown in Fig. 7.
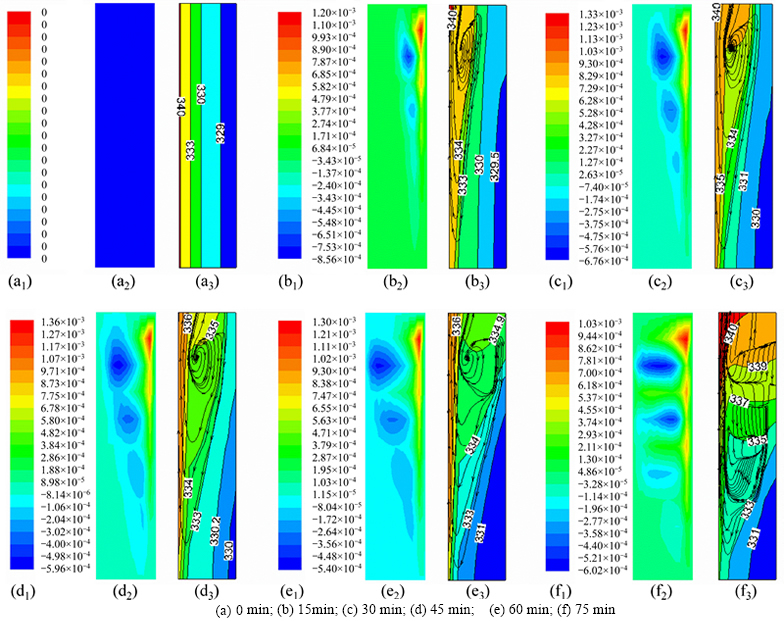
Fig. 5 Velocity field in z direction (m/s) (a1, b1, c1, d1, e1, f1), temperature field (K), and flow trajectories (a2, b2, c2, d2, e2, f2):
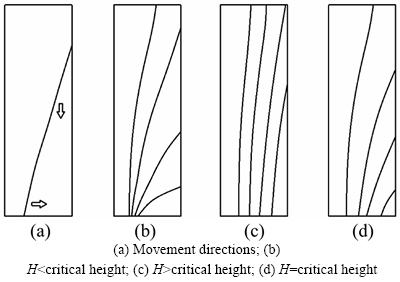
Fig. 6 Phase boundary movement:
4 Theoretical research
4.1 Theoretical model
To simplify the thermal storage unit model, suppose that:
1) Paraffin is isotropic; that is, there is neither temperature gradient nor heat transfer in the concentric- circle direction.
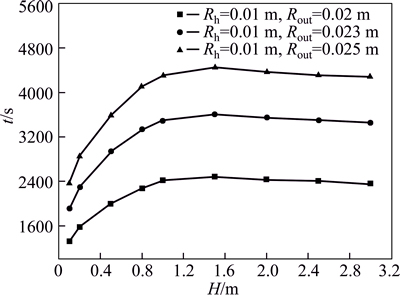
Fig. 7 Relationship between heat accumulation time and height
2) Natural convection is neglected��that is, there is no heat transfer in the vertical direction (see conclusion of Fig. 4).
3) There is no chemical reaction in the melting process of paraffin, which means there is no inner heat producer in the melting process.
4) Density ��, specific heat capacity c, and thermal conductivity �� of paraffin are assumed to be constant. The phase transformation temperature range of paraffin is within Ts�CTl. Paraffin within this range is a solid-liquid mixture. It is solid when the temperature is lower than Ts, and it is liquid when the temperature is higher than Tl. The model is further simplified, as shown in Fig. 8.
5) Paraffin is regarded as a crystal. Let Tl be the phase change temperature. If the temperature of paraffin reaches Tl, it is regarded as liquid.
6) The initial temperature of paraffin is Tl and paraffin is at the critical state of starting to absorb latent heat; that is, sensible heat in the melting process of paraffin can be neglected in the calculation.
7) The melting process of paraffin is considered a quasi-stable process.
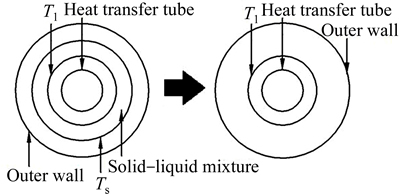
Fig. 8 Schematic diagram of model simplification
Under the foregoing assumptions, the 3D model can be transformed into a 2D model:
 (10)
(10)
With mathematical description of the liquid phase zone in the melting process of paraffin given as
 (11)
(11)
the boundary condition of heat transfer tube is:
 (12)
(12)
and heat transfer differential equation at the phase boundary is:
 (13)
(13)
According to the foregoing assumptions, there is no heat transfer from the phase boundary to the solid phase zone, and the boundary condition of the phase boundary is
 (14)
(14)
 (15)
(15)
Based on foregoing Eqs. (11), (12), and (15), the following equation can be obtained as
 (16)
(16)
Substitute Eq. (16) into Eq. (14) yields:
 (17)
(17)
Obtain the integral of Eq. (17) and substitute it into the initial conditions of t=0, Rp=Rh:
 (18)
(18)
In these relations, t is the time, Rh is the heat transfer tube radius, Rp is the phase boundary radius, a is the thermal diffusivity, and �� is the thermal conductivity.
Add a modified coefficient:

 (19)
(19)
where a is the error correction coefficient; a = 1.02 is used.
The difference between 3D and 2D models lies in the influence of natural convection on paraffin. It can be found that different sizes of heat storage units will lead to changes in the movement of the phase boundary. Size has a great influence on the heat storage time, and the influence of natural convection intensity is not significant (see conclusion of Fig. 7). The thickness of the thermal storage cavity (the difference between inner and outer diameters) and the height are defined as the characteristic length. By fitting them with the outcome of the numerical simulation, a correlation between the thermal storage time and characteristic lengths can be acquired.

 (20)
(20)
where b, m, and n are coefficients. b1=0.062, m1=0.267, and n1=-0.7 are used as H
Figrue 9 presents a comparison of the thermal storage time acquired by numerical simulation and the fitting curve. Overall, the outcome of numerical simulation is higher than that of the fitting curve. With increasing thermal storage time, the error of fitting-curve correlation increases. Within 2��104 s, the error reduces to below 8%, which verifies the reliability of the fitting curve.
4.2 Model validation
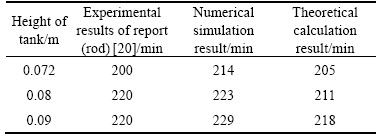
When neglecting the process of sensible thermal storage, the theoretical model is suitable for either low-temperature PCM or high-temperature PCM whose initial temperature is near the melting point. The process substitutes the parameters of previous reports [20, 29] into Eq. (20) to further demonstrate its reliability (The unit kJ needs to be converted to J.); the parameters are listed in Table 2. Several authors mention that the PCM physical data given by suppliers are of uncertain accuracy. Therefore, the differential scanning calorimetry curves are measured in Ref. [29]. The results obtained depend on the heat-up velocity, which corresponds to the latent heat of fusion, which is the same in all cases (250 kJ/kg). By using parameters of the paper, the result of theoretical calculation and numerical simulation is 6154 s and 6213 s respectively, and the PCM is already close to complete melting in the experiment, with 6000 s left. Table 3 presents a comparison of the thermal storage time acquired by experiment [20], numerical simulation and theoretical calculation, and the results and the change tendency agree well with the experiments.
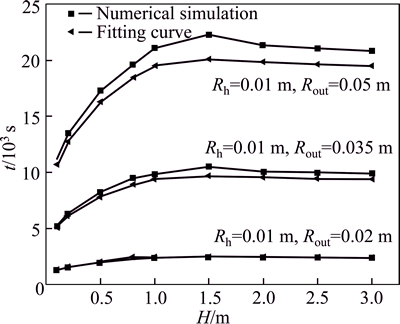
Fig. 9 A comparison of heat accumulation time acquired by numerical simulation and fitting curve
Table 2 Parameters of previous reports
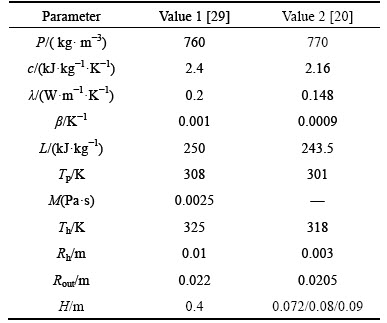
Table 3 Comparison between experimental, simulated and calculated results
4.3 Natural convection and performance study
Figure 10 shows a relationship between the height and thermal storage time of thermal storage units with or without natural convection. In the melting process of paraffin, different thicknesses of thermal storage cavity make the thermal storage time different under the effect of natural convection. With increasing thickness, natural convection clearly accelerates the melting of paraffin. When the thickness of the cavity is small, natural convection restrains the melting behavior of paraffin. Without considering natural convection, height change has no impact on the thermal storage time. In considering natural convection, the thermal storage time first increases and then decreases with increasing height.
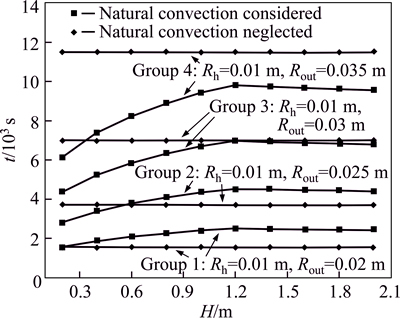
Fig. 10 Relationship between heat accumulation time and height of thermal storage unit with or without natural convection
Heat accumulation capacity and thermal storage time are two key indicators of the comprehensive performance of a thermal storage unit. Compare with latent heat accumulation capacity, sensible heat accumulation capacity is smaller, and it can be neglected. Therefore, the heat accumulation capacity of the unit can be expressed as
 (21)
(21)
When the size of the heat transfer tube is Rh=0.01 m, for different thermal storage times, the relationship of heat accumulation capacity and height is presented in Fig. 11. We determine the value of Rp through t, Rh, andH. Then, we calculate the heat accumulation capacity. According to the curves, a higher thermal storage unit resulted in a larger heat accumulation capacity in the same amount of time. At the critical height, there is an inflection point on the curves, which indicates that performance is improved if the height of the thermal storage unit is greater than the critical height.
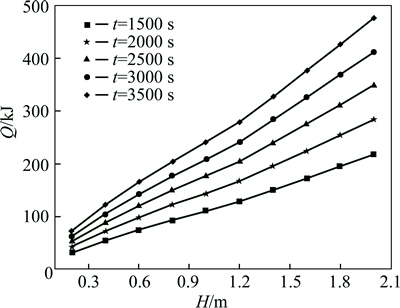
Fig. 11 Relationship between heat accumulation capacity and height
For different heights of heat accumulation units, the relationship of heat accumulation capacity and heat accumulation time is shown in Fig. 12. This relationship is linear. The ratio of heat accumulation capacity to heat accumulation time increases as the height increases with k0.5=0.0396, k1=0.0658, k1.5=0.0959, and k2=0.130. Therefore, several small series-connected heat accumulation units have better performance than one large heat accumulation unit of the same height.
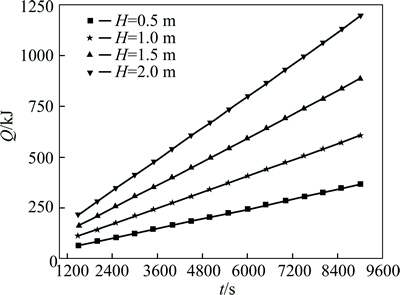
Fig. 12 Relationship between heat accumulation capacity and thermal storage time with correlation coefficient of 0.99
5 Conclusions
The melting process in an annular tube with PCM is explored both numerically and theoretically. A novel method for predicting the thermal storage time of an annular tube thermal storage unit is proposed on the basis of the assumptions provided. The method is validated experimentally in an annular enclosure bounded from inside by a heated tube used in other recent reports. By using the method in this study, the performance of the thermal storage unit and the role of natural convection are also investigated. The investigation revealed effects not predicted by experiment and simulation approaches in the previous reports.
However, for many engineering applications, it might be useful to sacrifice some accuracy for speed and simplicity. The method can be used to deal with complicated phase change heat transfer problems. Complex heat and mass transfer mechanisms in the phase change process can be clarified using this method. This numerical simulation technique and analytical method can be applied to investigate the heat and mass transfer processes of other phase change devices as well.
References
[1] TYAGI V V, KAUSHIK S C, TYAGI S K, AKIYAMA T. Development of phase change materials based microencapsulated technology for buildings: A review [J]. Renewable & Sustainable Energy Reviews, 2011, 15(2): 1373-1391.
[2] KENISARIN M M. High-temperature phase change materials for thermal energy storage [J]. Renewable & Sustainable Energy Reviews, 2010, 14(3): 955-970.
[3] ZHANG Xue-lai, YU Shu-xuan, YU Mei, LIN Yuan-pei. Experimental research on condensing heat recovery using phase change material [J]. Applied Thermal Engineering, 2011, 31: 3736-3740.
[4] FENG Guo-hui, CHEN Qi-zhen, HUANG Kai-liang, NIU Run-ping, WANG Lin. Cool storage time of phase change wallboard room in summer [J]. Journal of Central South University of Technology, 2009, 16(12): 75-79.
[5] ZHAO Fang, CHEN Zhen-qian, SHI Ming-heng. Numerical study on freezing-thawing phase change heat transfer in biological tissue embedded with two cryoprobes [J]. Journal of Central South University of Technology, 2009, 16(2): 326-331.
[6] AADMI M, KARKRI M, HAMMOUTI M E. Heat transfer characteristics of thermal energy storage of a composite phase change materials: Numerical and experimental investigations [J]. Energy, 2014, 72(7): 381-392.
[7] HUANG Kai-liang, FENG Guo-hui, ZHANG Jian-shun. Experimental and numerical study on phase change material floor in solar water heating system with a new design [J]. Solar Energy, 2014, 105: 126-138.
[8] SUN Xiao-qin, ZHANG Quan, MEDINA M A, KYOUNG O L. Energy and economic analysis of a building enclosure outfitted with a phase change material board (PCMB) [J]. Energy Conversion & Management, 2014, 83: 73-78.
[9] DUTIL Y, ROUSSE D R, SALAH N B, LASSUE S, ZALEWSKI L. A review on phase-change materials: Mathematical modeling and simulations [J]. Renewable & Sustainable Energy Reviews, 2011, 15(1): 112-130.
[10] MA Zhan-hua, ZHANG Yu-wen. Solid velocity correction schemes for a temperature transforming model for convection phase change [J]. International Journal of Numerical Methods for Heat & Fluid Flow, 2006, 16(2): 204-225.
[11] CAO Y, FAGHRI A. A numerical analysis of phase-change problems including natural convection [J]. Journal of Heat Transfer, 1990, 112, 3(3): 812-816.
[12] VOLLER V R, CROSS M, MARKATOS N C. An enthalpy method for convection/diffusion phase change [J]. International Journal for Numerical Methods in Engineering, 1987, 24(1): 271-284.
[13] GARTLING D K. Finite element analysis of convective heat transfer problems with change of phase [C]// Conference on Numerical Methods in Laminar and Turbulent Flow, Swansea, UK: NMLTF, 1978.
[14] BINET B, LACROIX M. Melting from heat sources flush mounted on a conducting vertical wall [J]. International Journal of Numerical Methods for Heat & Fluid Flow, 2000, 10(3): 286-307.
[15] VOLLER V R. An overview of numerical methods for solving phase change problems [J]. Advances in Numerical Heat Transfer, 1997, 1(9): 341-380.
[16] KOZAK Y, ROZENFELD T, ZISKIND G. Close-contact melting in vertical annular enclosures with a non-isothermal base: Theoretical modeling and application to thermal storage [J]. International Journal of Heat & Mass Transfer, 2014, 72(3): 114-127.
[17] AGYENIM F, EAMES P, SMYTH M. Experimental study on the melting and solidification behaviour of a medium temperature phase change storage material (Erythritol) system augmented with fins to power a LiBr/H2O absorption cooling system [J]. Renewable Energy, 2011, 36(1): 108-117.
[18] LIU Chang, GROULX D. Experimental study of the phase change heat transfer inside a horizontal cylindrical latent heat energy storage system [J]. International Journal of Thermal Sciences, 2014, 82: 100-110.
[19] MESALHY O, LAFDI K, ELGAFY A, BOWMAN K. Numerical study for enhancing the thermal conductivity of phase change material (PCM) storage using high thermal conductivity porous matrix [J]. Energy Conversion & Management, 2005, 46(6): 847-867.
[20] SHARIFI N, BERGMAN T L, ALLEN M J, FAGHRI A. Melting and solidification enhancement using a combined heat pipe, foil approach [J]. International Journal of Heat & Mass Transfer, 2014, 78: 930-941.
[21] ALLEN M J, SHARIFI N, FAGHRI A, BERGMAN T L. Effect of inclination angle during melting and solidification of a phase change material using a combined heat pipe-metal foam or foil configuration [J]. International Journal of Heat & Mass Transfer, 2015, 80: 767-780.
[22] SARI A, KAYGUSUZ K. Thermal performance of palmitic acid as a phase change energy storage material [J]. Energy Conversion & Management, 2002, 43(6): 863-876.
[23] TRP A. An experimental and numerical investigation of heat transfer during technical grade paraffin melting and solidification in a shell- and-tube latent thermal energy storage unit [J]. Solar Energy, 2005, 79(6): 648-660.
[24] ANISUR M R, KIBRIA M A, MAHFUZ M H, SAIDUR R, MESTSELAAR I H S C. Cooling of air using heptadecane phase change material in shell and tube arrangement: Analytical and experimental study [J]. Energy & Buildings, 2014, 85: 98-106.
[25] LIU Zhen-yu, YAO Yuan-peng, WU Hui-ying. Numerical modeling for solid�Cliquid phase change phenomena in porous media: Shell-and-tube type latent heat thermal energy storage [J]. Applied Energy, 2013, 112: 1222-1232.
[26] LAFDI K, MESALHY O, ELGAFY A. Graphite foams infiltrated with phase change materials as alternative materials for space and terrestrial thermal energy storage applications [J]. Carbon, 2008, 46(1): 159-168.
[27] SUN Xiao-qin, ZHANG Quan, MEDINA M A, KYOUNG O L. Experimental observations on the heat transfer enhancement caused by natural convection during melting of solid�Cliquid phase change materials (PCMs) [J]. Applied Energy, 2015.
[28] TAN F L, HOSSEINIZADEH S F, KHODADADI J M, FAN L. Experimental and computational study of constrained melting of phase change materials (PCM) inside a spherical capsule [J]. International Journal of Heat & Mass Transfer, 2009, 52: 3464-3472.
[29] LONGEON M, SOUPART A, BRUCH A. Experimental and numerical study of annular PCM storage in the presence of natural convection [J]. Applied Energy, 2013, 112(4): 175-184.
[30] KHILLARKAR D B, GONG Z X, MUJUMDAR A S. Melting of a phase change material in concentric horizontal annuli of arbitrary cross-section [J]. Applied Thermal Engineering, 2000, 20(10): 893-912.
[31] MAHDAOUI M, KOUSKSOU T, BLANCHER S, MSSAD A A, RHAFIKI T E, MOUQALLID M. A numerical analysis of solid�Cliquid phase change heat transfer around a horizontal cylinder [J]. Applied Mathematical Modelling, 2014, 38(3): 1101-1110.
[32] HOSSEINIZADEH S F, DARZI A A R, TAN F L. Numerical investigations of unconstrained melting of nano-enhanced phase change material (Nepcm) inside a spherical container [J]. International Journal of Thermal Sciences, 2012, 51(4): 77-83.
[33] ZHUO Cong-shan, ZHONG Cheng-wen. LES-based filter-matrix lattice Boltzmann model for simulating turbulent natural convection in a square cavity [J]. International Journal of Heat & Fluid Flow, 2013, 42(4): 10-22.
[34] WANG Jun. Regenerative experimental and theoretical study of the melting wax [D]. Xi��an: Xi��an Jiaotong University, 2002. (in Chinese)
[35] LORENTE S, BEJAN A, NIU J L. Phase change heat storage in an enclosure with vertical pipe in the center [J]. International Journal of Heat & Mass Transfer, 2014, 72(3): 329-335.
[36] BRENT A D, VOLLER V R, REID K J. Enthalpy-porosity technique for modeling convection-diffusion phase change: Application to the melting of a pure metal [J]. Numerical Heat Transfer Applications, 1988, 13(3): 297-318.
[37] VOLLER V R, PRAKASH C. A fixed grid numerical modelling methodology for convection-diffusion mushy region phase-change problems [J]. International Journal of Heat & Mass Transfer, 1987, 30(87): 1709-1719.
[38] SHOKOUHMAND H, KAMKARI B. Experimental investigation on melting heat transfer characteristics of lauric acid in a rectangular thermal storage unit [J]. Experimental Thermal & Fluid Science, 2013, 50(6): 201-212.
[39] PAL D, JOSHI Y K. Melting in a side heated tall enclosure by a uniformly dissipating heat source [J]. International Journal of Heat & Mass Transfer, 2000, 44(2): 375-387.
(Edited by DENG L��-xiang)
Cite this article as: LIU Fan-han, XU Jian-xin, WANG Hui-tao, WANG Hua. Numerical method and model for calculating thermal storage time for an annular tube with phase change material [J]. Journal of Central South University, 2017, 24(1): 217-226. DOI: 10.1007/s11771-017-3422-z.
Foundation item: Projects(51666006, 51406071, 51174105, 51366005) supported by the National Natural Science Foundation of China; Project(2014CB460605) supported by the National Basic Research Program of China
Received date: 2015-10-15; Accepted date: 2016-03-14
Corresponding author: XU Jian-xin, PhD; Tel: +86-871-65153405; E-mail: xujianxina@163.com

