��¶�ڼ��ձȺ�ˮ�е�2219-T42��6061-T6���Ͻ�����ʼ�ֲ���ʴ��Ϊ�ıȽ�
��Դ�ڿ����й���ɫ����ѧ��(Ӣ�İ�)2019���1��
�������ߣ�Gloria ACOSTA Lucien VELEVA Juan Luis LOPEZ D. A. LOPEZ-SAURI
����ҳ�룺34 - 42
�ؼ��ʣ����Ͻ𣻸�ʴ���绯ѧ�����������仯�����������ˮ
Key words��aluminum alloy; corrosion; electrochemical noise; intermetallic particles; seawater
ժ Ҫ����6061-T6��2219-T42���Ͻ���Ʒ��¶�ڼ��ձȺ�ˮ��90 d������·��λ�IJ�����Ϊ�绯ѧ����(EN)�����������ͱȽϺϽ����ij�ʼ��ʴ��Ϊ�����ù������ܶ�(PSD)��Ƶ�ʵĹ�ϵͼ���е绯ѧ����������PSDͼ��ָ���µļ�С���������ź�ˮ�����Ͻ��ʴ�Ľ��У������Է��������ͷš���·��λ�IJ������¸�ʴ������Ѻ��γ��йء�PSDͼ��ָ���µı仯���Ʊ�����AA2219-T42���Ͻ�ĸ�ʴ������һ�������ķ���̬���̣��䶯��ѧ��Ϊ�ܷ��β����˶�(fBm)���ƣ�AA6061-T6���Ͻ�ĸ�ʴ��������Ҫ���ֳ���̬�����־��Ե����ԣ��������ڷ��θ�˹����(fGn)�Ĺ��ס����Ͻ�¶�ں�ˮ�к����ɨ��羵-X��������(SEM-EDX)���������ֺϽ��ϴ��ڸ���Cu��Fe��������ֲ��IJ����Խ����仯���������AA2219-T42�Ͻ���Mg��Al�������ܽⷢ����S��(Al2CuMg)��
Abstract: Aluminum alloy samples, 6061-T6 and 2219-T42, were exposed to Caribbean seawater for 90 d. The fluctuations of open circuit potential, considered as electrochemical noise (EN), were used to characterize and compare initial pitting events, which appeared on their surfaces. EN analysis was carried out using the power spectral density (PSD) vs frequency. The decrease of the b exponent in PSD graphs indicated a release of spontaneous energy with the progress of pit formation in seawater. The fluctuations were associated with the breakdown and formation of new corrosion layers. The values of �� exponent in PSD graphs suggest that corrosion process of AA2219-T42 alloy occurs as a persistent non-stationary process, the dynamics of which is controlled by fractional Brownian motion (fBm), while on AA6061-T6 alloy the corrosion process was dominated by stationary and weakly persistent features, with the contribution of fractional Gaussian noise (fGn). After the exposure in seawater, SEM-EDX analysis revealed insoluble intermetallic particles on the alloys, rich in Cu or Fe and irregularly distributed. The preferential dissolution of Mg and Al occurs from the S-phase (Al2CuMg) of AA2219-T42 alloy.
Trans. Nonferrous Met. Soc. China 29(2019) 34-42
Gloria ACOSTA1, Lucien VELEVA1, Juan Luis LOPEZ1, D. A. LOPEZ-SAURI2
1. Applied Physics Department, Research Center for Advanced Studies (CINVESTAV), Unidad Merida, km 6 Carr. Antigua a Progreso, AP 73 Cordemex, 97310 Merida, Yucatan, Mexico;
2. TecnolOgico Nacional de Mexico, Instituto TecnolOgico de Merida, Departamento de Quimica y Bioquimica, Av. TecnolOgico km 4.5 S/N, 97118 Merida, Yucatan, Mexico
Received 6 April 2018; accepted 30 October 2018
Abstract: Aluminum alloy samples, 6061-T6 and 2219-T42, were exposed to Caribbean seawater for 90 d. The fluctuations of open circuit potential, considered as electrochemical noise (EN), were used to characterize and compare initial pitting events, which appeared on their surfaces. EN analysis was carried out using the power spectral density (PSD) vs frequency. The decrease of the ��exponent in PSD graphs indicated a release of spontaneous energy with the progress of pit formation in seawater. The fluctuations were associated with the breakdown and formation of new corrosion layers. The values of �� exponent in PSD graphs suggest that corrosion process of AA2219-T42 alloy occurs as a persistent non-stationary process, the dynamics of which is controlled by fractional Brownian motion (fBm), while on AA6061-T6 alloy the corrosion process was dominated by stationary and weakly persistent features, with the contribution of fractional Gaussian noise (fGn). After the exposure in seawater, SEM-EDX analysis revealed insoluble intermetallic particles on the alloys, rich in Cu or Fe and irregularly distributed. The preferential dissolution of Mg and Al occurs from the S-phase (Al2CuMg) of AA2219-T42 alloy.
Key words: aluminum alloy; corrosion; electrochemical noise; intermetallic particles; seawater
1 Introduction
Aluminum alloys (AA) series 2xxx and 6xxx are very popular as materials for application in industry, for example, in vehicles, aircraft and machine parts and computers, as well in seawater structures (e.g. ships and liquid cargo containers). The light mass, high electrical and thermal conductivities are the main advantages of these alloys. They present a good corrosion resistance in many environments having neutral pH, owing to the formation of a protective passive Al2O3 oxide film on their surfaces, which is insoluble in water [1-4]. However, the chloride ions may promote their pitting corrosion [5-8], stress corrosion cracking [9] and inter- granular corrosion [10]. The susceptibility to corrosion of aluminum alloys in the form of pitting, when they are exposed to an aggressive environment, is a consequence of galvanic cells formed in the boundary regions between a metal matrix and second phase intermetallic particles [5]. These particles present cathodic activity, when containing Cu and Fe, since they are nobler elements with respect to aluminum matrix. The anodic particles contain more active elements, such as Mg. The process becomes more localized owing to the presence of different intermetallic phases, as reported in Refs. [11-18]. Two types of intermetallic particles precipitated in the 2xxx alloys [15] and specifically in AA2219-T42 alloy [11] have been identified as cathodic and anodic. The cathodic particles are rich in copper, like ��-phase (Al2Cu) and Al�CCu�CFe�CMn, and they have less negative corrosion potential than the alloy matrix [3]. Contact with active anodic particles, i.e. S-phase (Al2CuMg), promotes peripherical pitting around them [19]. On the other hand, the anodic particles can suffer selective Mg and Al dissolution, observed as pitting corrosion [14]. Thus, due to the formation of local galvanic cells between the intermetallic particles and Al matrix, AA2219 alloy presents poor corrosion resistance in chloride medium [16]. In AA6061-T6 alloy, the precipitated particles have been classified into two main groups, according to their electrochemical behavior relative to the aluminum matrix: active anodic (rich in Mg, Si and Al), with Mg preferential dissolution, and cathodic (rich in Fe, Si and Cr) [18].
Seawater is a destructive medium for metals owing to its high salinity (35%, density of 1.023 g/cm3 at 25 ��C) and is capable of producing severe damage in a short time. It is a very complex electrolyte with many factors affecting the corrosion behavior of any metal or alloy, such as salinity, pH, oxygen content, temperature, specific contaminants and flow velocity.
The detection and characterization of the initial events of pitting corrosion and the changes observed on a metal surface are of great interest. Monitoring the open circuit potential (OCP) of a metal, called as free corrosion potential (��corr), is a direct and non-intrusive electrochemical method which enables the progress of the corrosion process and changes on the metal surface to be detected. OCP evaluation can provide an idea of the metal behavior during its exposure to aggressive environments. ��corr fluctuations are classified as electro- chemical noise (EN) when they are phenomena of low frequency (<10 Hz) and low amplitude. EN analysis would help to describe the fluctuating behavior of a totally random signal in respect of time [20,21]. EN analysis would help to describe the fluctuating behavior of a totally random signal in respect of time, which could be attributed to the variety of macroscopic and microscopic stochastic events in corrosion systems [20,21]. IVERSON [22] employed EN measure- ments for the identification and interpretation of the corrosion process evolution in metal and alloys. The spontaneous EN could provide important information on the activities taking place simultaneously at metal/ electrolyte corroding interface [23]. For example, EN has been applied to characterizing the localized corrosion of AA7A60 alloy in 3.5% NaCl solution [24] and the corrosion process of AZ91D magnesium alloy in neutral NaCl solution [25].
The typical procedure to analyze EN is to transform the data in the frequency domain to acquire power spectral density (PSD) [26,27]. PSD plots could be estimated by utilizing standard algorithms, such as fast Fourier transform (FFT) or maximum entropy method (MEM) [28]. PSD method is an appropriate method to identify long-term persistence in data and to perceive the energy changes in a system. The plots display the power per unit frequency with respect to the frequency on logarithmic scale [29]. According to Mandelbrot and Ness [30], the relation S(f) would be written as 1/f �� in the frequency domain, where S(f) is the corresponding square amplitude; �� is calculated by estimating the negative slope of the line relating lg S(f) to lg f. In agreement with EKE et al [31], PSD allows the distinction between series with fractional Gaussian noise (fGn) and fractional Brownian motion (fBm): �� exponents from -1 to 1 correspond to fGn, and fBm is considered when the exponents �� are from 1 to 3. Thus, the exponent value is correlated with persistent processes in series over time [32]: fGn as a stationary process and the fBm as non-stationary [33].
In our past research, the multifractal detrended method and PSD analysis of corrosion potential were used to characterize the initial stages of copper patina formation [34] and pure aluminum corrosion in sea- water [35].
The focus of this research is to extend the information on surface changes, due to the initial stages of localized corrosion of two aluminum alloys, 2219-T42 and AA6061-T6, exposed to Caribbean seawater over 90 d. The OCP fluctuations were considered as EN and transformed in the frequency domain to obtain PSD plots, in order to gain information on the dynamics of spontaneous release of energy during the corrosion process. The results have been supported by SEM-EDX analysis of alloy surfaces. A qualitative correlation between EN-PSD data and surface analysis was recognized.
2 Experimental
2.1 Characterization of AA2219-T42 and AA6061-T6
Table 1 presents the chemical composition of 2219- T42 and 6061-T6 aluminum alloys (California Metal and Supply Inc.). Specimens of 1 cm2 were cleaned with ethanol and immersed in 50 mL of Caribbean seawater at 20 ��C for 1, 2, 3, 5, 10, 15, 30 and 90 d, respectively.
Figure 1 shows SEM images of AA6061-T6 and AA2219-T42 surfaces. EDX elemental analysis of the observed intermetallic particles is revealed in Table 2. For AA6061-T6, zone A is rich in Al and Fe, in the presence of Si and Mn, and traces of Cr. These could be considered as second phases [15,18]: Al3Fe, Mg2Si, Al-Si-Mn-Fe and Al-Mg-Si. For AA2219-T42, zones B and C are rich in Al and Cu, Mn and Mg at low content, probably acting as the cathodic ��-phase (Al2Cu) and anodic S-phase (Al2CuMg) [11,14,15,19].
Table 1 Chemical compositions of 2219-T42 and 6061-T6 aluminum alloys (mass fraction, %)
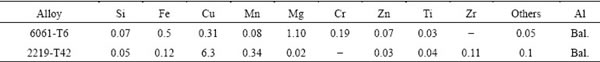
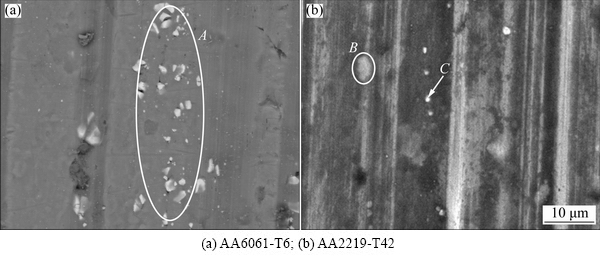
Fig. 1 SEM images of intermetallic particles on surface of reference aluminum alloy samples
Table 2 EDX analysis results of intermetallic particles in zones A, B and C of Fig. 1 observed on surface of reference aluminum alloys samples
2.2 Seawater chemistry
The Caribbean seawater was collected from Telchac port (Yucatan Peninsula of Mexico, 21��7�� N, 89��25�� W, marine station of CINVESTAV-Merida), at 10 km from the coast and 10 m in depth. The seawater contained total salinity of 3.7%, pH 7.69, 1.1��10-6 of dissolved oxygen and 20 ��C of registered temperature at that depth. Specific sea pollutants were 2.61 ��mol/L silicates, 1.75 ��mol/L ammonium, 1.84 ��mol/L nitrates, 0.28 ��mol/L phosphates and 0.04 ��mol/L nitrites.
2.3 Surface analysis
The samples, withdrawn at different exposure time in seawater, were dried and analyzed by SEM-EDX microscopy (Phillips-XL-30 and ESEM-JEOL JSM- 7600F). The samples were chemically cleaned in 1.42 g/mL HNO3 solution at 25 ��C for 5 min, in agreement with ASTM G1-90 [36], to remove the formed corrosion layers and to obtain images of alloy surface changes after immersion with a SEM-EDX microscopy. The analysis of the formed surface layers and the precipitates of detached particles was carried out with X-ray diffraction (XRD) equipment (Siemens D-5000, using grazing beam geometry, 34 kV, 25 mA, 3�� angle and radiation Cu K��). With DIFRACT AT software the spectra were treated for the identification of the crystalline phases.
2.4 Electrochemical corrosion test
The registration of free corrosion potential (��corr) fluctuations of the alloy samples (working electrodes), considered as EN because of their signal amplitude, was achieved in an electrochemical cell. The recording time of ��corr was 13000 s, with a sampling period of 0.05 s (using 216 data), at each time of exposure of both alloy samples in seawater. The registration of ��corr was performed with a potentiostat/galvanostat Series G750 (Gamry Instruments, Inc., software PHE 200). Calomel electrode (��=0.244 V (vs SCE, Hg2+/Hg2Cl2)) was used as a reference electrode. The curves of ��corr values vs time were plotted and the spectral analysis was achieved to obtain the amplitude spectrum by fast Fourier transform (FFT) and to graph PSD. The PSD as a function of low frequency was analyzed on logarithmic scale (10-3-10-1 Hz). The above procedures allowed the slopes of the amplitude spectrum to ascertain, as well as the corrosion mechanism taking place on aluminum alloy surfaces exposed to seawater.
3 Results and discussion
3.1 SEM-EDX characterization of surface layers
To understand corrosion potential changes over time, more detailed information was provided by SEM-EDX analysis of both alloy surfaces. Figures 2 and 3 present SEM images of the layers formed on AA6061-T6 and AA2219-T42 surfaces, respectively, after exposure for 15, 30 and 90 d to Caribbean seawater. Their EDX analysis results are shown in Tables 3 and 4. The morphologies of both alloy surfaces reveal clearly that after 15 d of exposure to seawater, as a consequence of chloride ions aggressive attack, deeper micro-cracks and more significant pitting corrosion are observable on AA2219-T42 surface (Fig. 3(a)), compared with that on AA6061-T6 surface (Fig. 2(a)). On AA6061-T6 surface (Fig. 2(a), Table 3), zone A probably corresponds to amorphous alumina (Al2O3) and/or Al(OH)3. However, at 30 d of exposure, the AA6061-T6 shows more cracked surface (Fig. 2(b)), while on the surface of AA2219-T42 it seems that cumulus of amorphous aluminum products were formed in the initially cracked areas (Fig. 3(b), Table 4).

Fig. 2 SEM images of layers formed on AA6061-T6 surface after exposure to Caribbean seawater for different time

Fig. 3 SEM images of layers formed on AA2219-T42 surface after exposure to Caribbean seawater for different time
Table 3 EDX analysis results of layers formed on AA6061-T6 surface after exposure to Caribbean seawater for different time

Table 4 EDX analysis results of layers formed on AA2219-T42 surface after exposure to Caribbean seawater for different time

However, at a later time (90 d) the surface layer is more compact on AA6061-T6 (Fig. 2(c)), while that on AA2219-T42 (Fig. 3(c)) is very porous. Flakes rich in Ca, C and O elements and low in Al element, deposited on the AA6061-T6 surface (Fig. 2(c), Table 3) could be attributed to several CaCO3 compounds, originated from seawater. These flakes were able to act as additional cover layer to protect the surface. However, their adhesion is not good, and once growing over the time they detached giving precipitates. XRD analysis revealed the presence of CaCO3 (calcite), CaAl5O7 and AlCl3��6H2O compounds.
The larger pits on AA2219-T42 surface probably nucleated on the anodic particles of the S-phase (Al2CuMg) (Fig. 3(a), Table 4), referred in the experimental part of this study. After 90 d exposure to Caribbean seawater, during the anodic reaction on S-phase and the local pH increase at the cathodic particles (Al2Cu) [37,38], it seems that Al content goes down (Figs. 3(b) and (c), Table 4) as a consequence of chemical dissolution of the natural airborne-formed Al oxide layer (AlCl3��6H2O participate).
Figure 4 SEM images of both alloy surfaces after their chemical cleaning procedure [36], to remove the corrosion layers formed at 90 d in seawater. It can be seen that AA6061-T6 presents cracks (Fig. 4(a)) and pits; however, they are more pronounced and deeper on the surface of AA2219-T42 (Fig. 4(b)). An irregular distribution of intermetallic cathodic particles rich in Al and Fe (in the presence of Si, Cr, Mn and Cu) remains on AA6061-T6 surface (Fig. 4(a), Table 5), while on AA2219-T42 surface the intermetallic cathodic particles are rich in Cu (Fig. 4(b), Table 5) [14,16,39,40].
3.2 Free corrosion potential (��corr)
Figure 5 compares ��corr values of AA2219-T42 and AA60601-T6 samples exposed to Caribbean seawater in different periods of time during 90 d. It is notable that the initial ��corr value of AA6061-T6 is more negative than that of AA2219-T42; however, at 24 h ��corr shifts approximately 350 mV to a less negative value, similar to that of AA2219-T42.
This behavior of ��corr is usually associated with the formation of a passive film that acts as a physical barrier to the surface of the alloy [5], and SEM-EDX analysis revealed that particles on AA6061-T6 surface (Fig. 2(a), Table 3), probably correspond amorphous aluminum compounds (Al2O3 and Al(OH)3). On the other hand, the initial ��corr value (-0.659 V) of AA2219-T42 tended to a more negative value after 24 h of exposure, providing an indication of the breakdown of naturally airborne-formed aluminum oxide layer, owing to the first events of pitting caused by chloride ion attack. As mentioned above in the experimental part, anodic S-phase particles appeared on the surface of AA2219-T42, which altered the properties of aluminum oxide layer [41], facilitating the penetration of chlorides and initiation of localized piting corrosion process. This fact caused the shift of the potential to more negative value [14,39,40].
Over time, ��corr of AA6061-T6 suddenly started to displace to more and more negative values, with a shift of about -200 mV up to 30 d, because of the significant cracking process in this period, confirmed by SEM-EDX (Fig. 2(b), Table 3), and won again less negative values (with about 300 mV) at the end of this experiment of 90 d. The reason for this potential shift could be the formed more compact surface layer and flakes rich in CaCO3 (Fig. 2(c), Table 3).
On the other hand, the cumulus of amorphous aluminum compounds formed in the initially cracked areas of AA2219-T42 (Fig. 3(b)) are probably attributed to more stable ��corr potential up to 30 d. However, at 90 d ��corr shifted to more negative value, because of the chemical dissolution of the naturally airborne-formed aluminium oxide layer, as suggested by EDX analysis (Table 4). After removal of the corrosion layer, SEM image (Fig. 4(b)) showed more pronounced and deeper cracks on the surface of AA2219-T42 than that of AA6061-T6 (Fig. 4(a)). In this way, the variation of ��corr values was well supported by SEM-EDX analysis.

Fig. 4 SEM images of aluminum alloy surfaces after 90 d in Caribbean seawater (corrosion layers are removed)
Table 5 EDX analysis of aluminum alloy surfaces after 90 d in Caribbean seawater (corrosion layers are removed)


Fig. 5 Free corrosion potential ��corr values (at OCP) of AA2219-T42 and AA6061-T6 samples during their exposure to Caribbean seawater for 90 d
3.3 PSD analysis of ��corr fluctuations of aluminum alloys exposed to Caribbean seawater
It is known that over the time on the aluminum alloy surfaces, persistent processes of pits nucleation occur, which breakdowns the naturally airborne-formed passive layers, competing with repassivation phenomena. All these reflect the corrosion potential changes over time. The nucleation of pits on aluminum alloys is often unpredictable, tending to randomly disperse on the metal surface, though there is evidence of preferential localization at intermetallic inclusions. On the other hand, the detection of the pits is difficult in their initial stages.
The localized corrosion process of 2219-T42 and 6061-T6 aluminum alloys, during their immersion in seawater, was correlated with the fluctuations of the ��corr, recorded at different periods of time, to achieve additional information for the dynamics of the initial pitting events as surface phenomena. Considered as EN, data time series of ��corr were treated to minimize errors, subtracting the average value and removing the linear trend, according to ASTM G199-09 [42]. EN time data have been transformed in the frequency domain to obtain power spectral density (PSD) plots, which could deliver information for the release of energy and its changes in the system, as a consequence of the spontaneous corrosion processes. PSD graphs represent the power per unit frequency (V2/f, V is the power in V, f is the frequency in Hz) with respect to frequency (f) on a logarithmic scale. Their interpretation served to distinguish the persistent processes, which control the transformations occurring on the aluminum alloy surfaces during their exposure in seawater.
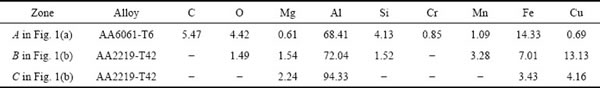
Figure 6 compares PSD graphs of ��corr fluctuations as a function of frequency on logarithmic scale, during the exposure of AA6061-T6 and AA2219-T42 in seawater over time. As examples, PSD plots are presented for periods of time of 1, 10, 30, and 90 d. All plots show a decrease in the �� exponent that could be associated with the spontaneous release of energy from the alloy surfaces with the advance of localized corrosion attack (pit formation) in seawater (Table 6). It can be noted that at the initial stage AA2219-T42 has an exponent of ��=1.83, higher than that (��=0.60) of AA6061-T6. In almost all periods of time, the exponent �� of AA2219-T42 maintains values of 1-3, which suggests that the localized corrosion (pit nucleation and growth) is a persistent and not stationary process, with the contribution of fractional Brownian motion (fBm) (Table 6). This behavior correlates well with the shift of the ��corr (Fig. 5) to more negative values, as from the first 24 h of immersion of AA2219-T42 in seawater and the deeper micro-cracks, and significant pitting corrosion (Fig. 4(a)), compared with that on AA6061-T6 surface (Fig. 2(a)). On the other hand, the values of exponent �� of AA6061-T6 (Table 6) indicate that up to 10 d and at the later stage of 90 d, the localized corrosion is considered as a weakly persistent process, controlled by fractional Gaussian noise (fGn), which is considered as a stationary process. However, at the medium period of time in seawater AA6061-T6 corrosion is advanced as persistent but non-stationary process, in a similar way to that of AA2219-T42, with the contribution of fractional Brownian motion (fBm) (Table 6). As is known, the corrosion process is not a result of static properties of the metal surface when localized corrosion is developed and the dynamics of the process results in EN. The data of PSD analysis are correlated well with the free corrosion potential values over time and new properties of the alloy surfaces (SEM-EDX characterization, discussed previously) acquired as a consequence of the advance in the corrosion process, helped considerably to distinguish the corrosion behavior of both aluminum alloys, when exposed to seawater.
Table 6 Experimental values of PSD slopes (exponent ��) characteristic of localized corrosion processes on surface of 2219-T42 and 6061-T6 aluminum alloys exposed to Caribbean seawater for 90 d

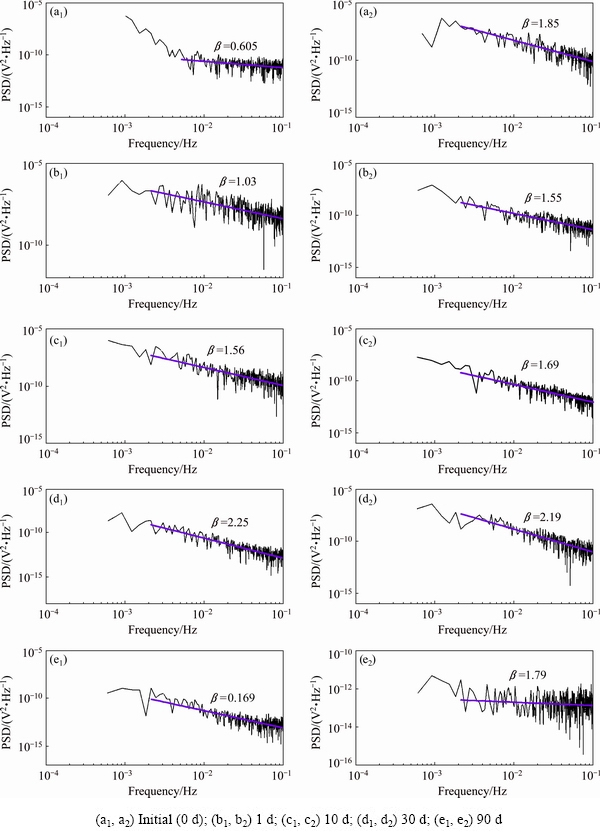
Fig. 6 PSD plots (V2/f) of ��corr fluctuations vs frequency (f) for AA6061-T6 (a1-e1) and AA2219-T42 (a2-e2) on logarithmic scale after exposure to Caribbean seawater for different time
4 Conclusions
(1) The values of free corrosion potential and the tendencies in its change are correlated well with the morphology and elemental composition of the surface layers. SEM-EDX analysis reveals that the observed difference in the corrosion behavior of the studied alloys is influenced mainly by the second phases as intermetallic particles, irregularly distributed in the matrix of aluminum, rich in Cu or Fe as potent cathodes.
(2) In the case of AA2219-T42, preferential dissolution of aluminum was observed, originated probably from the S-phase of Al2CuMn. At the end of 90 d experiment precipitates were observed, more significantly in the case of AA6061-T6, whose composition corresponds to several crystalline phases, losing adhesion to the alloy surfaces: CaCO3 (calcite), CaAl5O7 and AlCl3��6H2O compounds.
(3) Additional information of the dynamics of the corrosion process evolution was acquired, considering the fluctuations of the free corrosion potentials ��corr as electrochemical noise (EN). EN time data were transformed in the frequency domain to obtain PSD plots, which delivered information on the spontaneous release of energy over the period of corrosion.
(4) The values of �� slopes in PSD graphs suggest that on AA2219-T42 surface a persistent and non-stationary process of corrosion occurs, whose dynamics is controlled by fractional Brownian motion (fBm), while on AA6061-T6 in the major lapses of time the process is stationary and weakly persistent, with the contribution of fractional Gaussian noise (fGn).
Acknowledgments
The authors gratefully acknowledge the partial financial support of this study from CONACYT (Grant 179110). M. Sci. Gloria Acosta acknowledges CONACYT for the scholarship granted for her Ph.D. study. The authors gratefully thank to LANNBIO for allowing the use of SEM-EDX facility and to M. Sci. Dora Huerta and Biol. Ana Cristobal Ramos for their support in data acquisition.
References
[1] Pourbaix M. Atlas of electrochemical equilibria in aqueous solutions [M]. Houston, USA: NACE International, 1974.
[2] LaQue F L. Marine corrosion: Causes and prevention [M]. New York: John Wiley & Sons, 1975.
[3] Davis J R. ASM metals handbook [M]. Cleveland: ASM International, 1961.
[4] Ezuber H, El-Houd A, El-Shawesh F. A study on the corrosion behavior of aluminum alloys in seawater [J]. Materials and Design, 2008, 29: 801-805.
[5] Szklarska-Smialowska Z. Pitting and crevice corrosion [M]. Houston: NACE International, 2005.
[6] Guseva O, DeRose J A, Schmutz P. Modelling the early stage time dependence of localised corrosion in aluminium alloys [J]. Electrochimica Acta, 2013, 88: 821-831.
[7] Burstein G T, Liu C, Souto R M, Vines S P. Origins of pitting corrosion [J]. Corrosion Engineering, Science and Technology, 2004, 39: 25-30.
[8] SON I J, NAKANO H, OUE S, KOBAYASHI S, FUKUSHIMA H, HORITA Z. Effect of equal-channel angular pressing on pitting corrosion resistance of anodized aluminum-copper alloy [J]. Transactions of Nonferrous Metals Society of China, 2009, 19: 904-908.
[9] Bayoumi M R. The mechanics and mechanisms of fracture in stress corrosion cracking of aluminium alloys [J]. Engineering Fracture Mechanics, 1996, 54: 879-889.
[10] KIM S J, LEE S J, JEONG J Y, KIM K H. Electrochemical characteristics of Al-Mg and Al-Mg-Si alloy in sea water [J]. Transactions of Nonferrous Metals Society of China, 2012, 22(S): s881-s886.
[11] Grilli R, Baker M A, Castle J E, Dunn B, Watts J F. Localized corrosion of a 2219 aluminium alloy exposed to a 3.5% NaCl solution [J]. Corrosion Science, 2010, 52: 2855-2866.
[12] Blanc C, Lavelle B, Mankowski G. The role of precipitates enriched with copper on the susceptibility to pitting corrosion of the 2024 aluminium alloy [J]. Corrosion Science, 1997, 39: 495-510.
[13] Reboul M C, Baroux B. Metallurgical aspects of corrosion resistance of aluminium alloys [J]. Materials and Corrosion, 2011, 62: 215-233.
[14] Li Jin-feng, ZHENG Zi-qiao, Na Jiang, Tan Cheng-yu. Localized corrosion mechanism of 2XXX series Al alloy containing S(Al2CuMg) and q ��(Al2Cu) precipitates in 4.0% NaCl solution at pH 6.1 [J]. Materials Chemistry and Physics, 2005, 91: 325-329.
[15] Yasakau K A, Zheludkevich M L, Ferreira M G S. Role of intermetallics in corrosion of aluminum alloys [C]//MITRA R. Smart Corrosion Protection. Aveiro, Portugal: Woodhead Publishing, 2018: 425-462.
[16] Srinivasa Rao K, Prasad Rao K. Corrosion resistance of AA2219 aluminium alloy: Electrochemical polarisation and impedance study [J]. Materials Science and Technology, 2006, 22: 97-104.
[17] Guillaumin V, Mankowski G. Localized corrosion of 2024 T351 aluminium alloy in chloride media [J]. Corrosion Science, 1999, 41: 421-438.
[18] Alodan M A, Smyrl W H. Detection of localized corrosion of aluminum alloys using fluorescence microscopy [J]. Journal of the Electrochemical Society, 1998, 145: 1571-1577.
[19] Leblanc P, Frankel G S. A study of corrosion and pitting initiation of AA2024-T3 using atomic force microscopy [J]. Journal of the Electrochemical Society, 2002, 149: B239-B247.
[20] Dawson J L. Electrochemical noise measurement: The definitive in-situ technique for corrosion applications [C]//Kearns J, Scully J, Roberge P, Reichert D, Dawson J L. Electrochemical Noise Measurement for Corrosion Applications. West Conshohocken, PA: ASTM STP 1277, 1996: 3-35.
[21] Xia D H, Song S Z, Behnamian Y. Detection of corrosion degradation using electrochemical noise (EN): Review of signal processing methods for identifying corrosion forms [J]. Corrosion Engineering Science and Technology, 2016, 51: 527-544.
[22] Iverson W P. Transient voltage changes produced in corroding metals and alloys [J]. Journal of the Electrochemical Society, 1968, 115: 617-618.
[23] Loto C A. Electrochemical noise measurement technique in corrosion research [J]. International Journal of Electrochemical Science, 2012, 7: 9248-9270.
[24] WANG Xue-hui, WANG Ji-hui, FU Cong-wei. Characterization of pitting corrosion of 7A60 aluminum alloy by EN and EIS techniques [J]. Transactions of Nonferrous Metals Society of China, 2014, 24: 3907-3916.
[25] ZHANG Li-jun, ZHU Xu-bei, ZHANG Zhao, ZHANG Jian-qing. Electrochemical noise characteristics in corrosion process of AZ91D magnesium alloy in neutral chloride solution [J]. Transactions of Nonferrous Metals Society of China, 2009, 19: 496-503.
[26] Roberge P R. Quantifying the stochastic behavior of electrochemical noise Measurement during the corrosion of aluminum [C]//Kearns J R, Scully J R, Roberge P R, Reichert D L, Dawson J L. Electrochemical Noise Measurement for Corrosion Applications. West Conshohocken, PA: ASTM STP 1277, 1996: 142-156.
[27] Roberge P R, Lenard D R. Characterization of corroding aluminium alloys with electrochemical noise and electrochemical impedance spectroscopy [J]. Journal of Applied Electrochemistry, 1998, 28: 405-410.
[28] Burg J P. Maximum entropy spectral analysis [M]. California: Stanford University, 1975.
[29] Bertocci U, Gabrielli C, Huet F, Keddam M, Rousseau P. Noise resistance applied to corrosion measurements. II: Experimental tests [J]. Journal of the Electrochemical Society, 1997, 144: 37-43.
[30] Mandelbrot B B, van Ness J W. Fractional Brownian motions, fractional noises and applications [J]. SIAM Review, 1968, 10: 422-437.
[31] Eke A, Herman P, Bassingthwaighte J B, Raymond G M, Percival D B, Cannon M, Balla I, Ikrenyi C. Physiological time series: Distinguishing fractal noises from motions [J]. European Journal of Physiology, 2000, 439: 403-415.
[32] PlaninsiC P, Petek A. Characterization of corrosion processes by current noise wavelet-based fractal and correlation analysis [J]. Electrochimica Acta, 2008, 53: 5206-5214.
[33] Delignieres D, Ramdani S, Lemoine L, Torre K, Fortes M, Ninot G. Fractal analyses for ��short�� time series: A re-assessment of classical methods [J]. Journal of Mathematical Psychology, 2006, 50: 525-544.
[34] LOpez J L, Veleva L, LOpez-Sauri D A. Multifractal detrended analysis of the corrosion potential fluctuations during copper patina formation on its first stages in sea water [J]. International Journal of Electrochemical Science, 2014, 9: 1637-1649.
[35] Acosta G, Veleva L, LOpez J L. Power spectral density analysis of the corrosion potential fluctuation of aluminium in early stages of exposure to Caribbean sea water [J]. International Journal of Electrochemical Science, 2014, 9: 6464-6474.
[36] ASTM G1-90. Standard practice for preparing, cleaning, and evaluation corrosion test specimens [S].
[37] BIRBILIS N, BUCHHEIT R G. Investigation and discussion of characteristics for intermetallic phases common to aluminum alloys as a function of solution pH [J]. Journal of the Electrochemical Society, 2008, 155: C117-C126.
[38] OSORIO W R, MOUTINHO D J, PEIXOTO L C, FERREIRA I L, GARCIA A. Macrosegregation and microstructure dendritic array affecting the electrochemical behaviour of ternary Al-Cu-Si alloys [J]. Electrochimica Acta, 2011, 56: 8412-8421.
[39] LUO C, ZHOU X R, THOMPSON G E. Localized dissolution initiated at single and clustered intermetallic particles during immersion of Al-Cu-Mg alloy in sodium chloride solution [J]. Transactions of Nonferrous Metals Society of China, 2016, 26: 2800-2809.
[40] GHOSH R, VENUGOPAL A, RAMESH NARAYANAN P, SHARMA S C, VENKITAKRISHNAN P V. Environmentally assisted cracking resistance of Al-Cu-Li alloy AA2195 using slow strain rate test in 3.5% NaCl solution [J]. Transactions of Nonferrous Metals Society of China, 2017, 27: 241-249.
[41] LACROIX L, BLANC C, PEBERE N, THOMPSON G E, TRIBOLLET B, VIVIER V. Simulating the galvanic coupling between S-Al2CuMg phase particles and the matrix of 2024 aerospace aluminium alloy [J]. Corrosion Science, 2012, 64: 213-221.
[42] ASTM G199-09. Standard guide for electrochemical noise measurement [S].
Gloria ACOSTA1, Lucien VELEVA1, Juan Luis LOPEZ1, D. A. LOPEZ-SAURI2
1. Applied Physics Department, Research Center for Advanced Study CINVESTAV), Unidad Merida, km 6 Carr. Antigua a Progreso, AP 73 Cordemex, 97310 Merida, Yucatan, Mexico;
2. TecnolOgico Nacional de Mexico, Instituto TecnolOgico de Merida, Departamento de Quimica y Bioquimica, Av. TecnolOgico km 4.5 S/N, 97118 Merida, Yucatan, Mexico
ժ Ҫ����6061-T6��2219-T42���Ͻ���Ʒ��¶�ڼ��ձȺ�ˮ��90 d������·��λ�IJ�����Ϊ�绯ѧ����(EN)�����������ͱȽϺϽ����ij�ʼ��ʴ��Ϊ�����ù������ܶ�(PSD)��Ƶ�ʵĹ�ϵͼ���е绯ѧ����������PSDͼ��ָ���µļ�С���������ź�ˮ�����Ͻ��ʴ�Ľ��У������Է��������ͷš���·��λ�IJ������¸�ʴ������Ѻ��γ��йء�PSDͼ��ָ���µı仯���Ʊ�����AA2219-T42���Ͻ�ĸ�ʴ������һ�������ķ���̬���̣��䶯��ѧ��Ϊ�ܷ��β����˶�(fBm)���ƣ�AA6061-T6���Ͻ�ĸ�ʴ��������Ҫ���ֳ���̬�����־��Ե����ԣ��������ڷ��θ�˹����(fGn)�Ĺ��ס����Ͻ�¶�ں�ˮ�к����ɨ��羵-X��������(SEM-EDX)���������ֺϽ��ϴ��ڸ���Cu��Fe��������ֲ��IJ����Խ����仯���������AA2219-T42�Ͻ���Mg��Al�������ܽⷢ����S��(Al2CuMg)��
�ؼ��ʣ����Ͻ𣻸�ʴ���绯ѧ�����������仯�����������ˮ
(Edited by Wei-ping CHEN)
Corresponding author: Lucien VELEVA; Tel: +52-999-9429400 ext. 9447; E-mail: veleva@cinvestav.mx
DOI: 10.1016/S1003-6326(18)64912-X

