Trans. Nonferrous Met. Soc. China 29(2019) 157-164
Microstructure and photocatalytic activity of Ni-doped ZnS nanorods prepared by hydrothermal method
Wen-hua ZHAO1,2, Zhi-qiang WEI 1,2, Xiao-juan WU1, Xu-dong ZHANG2, Li ZHANG2, Xuan WANG1
1. State Key Laboratory of Advanced Processing and Recycling Nonferrous Metals, Lanzhou University of Technology, Lanzhou 730050, China;
2. School of Science, Lanzhou University of Technology, Lanzhou 730050, China
Received 31 December 2017; accepted 28 May 2018
Abstract: Pure ZnS and Ni2+-doped ZnS nanorods (Zn1-xNixS, x=0, 0.01, 0.03, 0.05 and 0.07, mole fraction, %) were synthesized by hydrothermal method. The effects of Ni2+ doping on the phase-structure, morphology, elemental composition and optical properties of the samples were investigated by X-ray diffraction (XRD), high-resolution transmission electron microscopy (HRTEM), X-ray energy dispersive spectrometry (EDS) and ultraviolet�Cvisible spectroscopy (UV-Vis), respectively. The photocatalytic activity of Zn1-xNixS nanorods was evaluated by the photodegradation of organic dyes Rhodamine B (RhB) in aqueous solution under UV light irradiation. The results show that all samples exhibit wurtzite structure with good crystallization. The morphologies are one-dimensional nanorods with good dispersion, and the distortion of the lattice constant occurs. The band gap of Zn1-xNixS samples is smaller than that of pure ZnS, thus red shift occurs. Ni2+-doped ZnS nanocrystals can enhance photocatalytic activities for the photodegradation of RhB. Especially, Zn0.97Ni0.03S sample exhibits better photocatalytic performance and photocatalytic stability for the decomposition of RhB.
Key words: Zn1-xNixS nanorods; phase-structure; microstructure; photocatalytic activity; hydrothermal method
1 Introduction
With the industry development, population growth and urbanization, the increasing pollution of natural water and air has become one of the considerable challenges to the modern human society and eco-system [1-3]. The main contamination source is artificial dyes which are non-biodegradable and toxic. The poisonous complexes in water media create awful hazard to the human health. Various treatment techniques have been applied for eradicating the dangerous pigments from wastewater, including coagulation-flocculation, centrifugation, ion exchange, sedimentation, membrane filtration, adsorption, photocatalysis and distillation. Compared with the traditional techniques, nanocrystalline semi- conductor photocatalysis is a promising and effective technique for photocatalytic degradation of the pollutants and toxins due to their advantages such as nontoxic, inexpensive, strong oxidizing activity and chemical stability [4].
ZnS is a multifunctional n-type semiconductor material with a wide direct band gap of 3.67 eV and a free exciting binding energy of 60 MeV [5,6]. ZnS semiconductor nanocrystals exhibit novel properties and wide application prospect such as solid state solar-cells, optoelectronic devices, energy storage, biosensors, ultraviolet detectors, gas-sensing devices and photocatalysis [7,8]. In recent years, some researchers have studied transition metal ions doped ZnS semi- conductor nanocrystals to explore photoluminescence properties and room-temperature ferromagnetism by providing extra positive carriers in the host material [9-11]. The crystal structure and band structure of ZnS nanocrystals can be modified by controlling the preparation process, changing the kinds and amount of doping elements, further improving the magnetic and optical properties [12,13]. Furthermore, doping with transition metal ion configurations could significantly improve the separation rate of photo-induced charge carriers in semiconductor photocatalysts, which inhibits the recombination of photogenerated electron-hole pairs and enhances the photocatalytic activity greatly.
However, to the best of our knowledge, there are rare reports about the effect of doping concentration on the photocatalytic properties of transition metal ions doped ZnS nanocrystals. Therefore, the main aim of this study is to investigate the influences of Ni2+ doping on the microstructure and photocatalytic activity of transition metal ions doped ZnS nanocrystals at different doping contents. In this study, Zn1-xNixS nanocrystals with different doping contents (x=0, 0.01, 0.03, 0.05 and 0.07, mole fraction, %) were synthesized by hydro- thermal method. The effects of Ni2+ doping content on the phase-structure, morphology, elemental composition, optical properties and photocatalytic activity of the as-prepared samples were studied and compared. Moreover, the possible photocatalytic mechanism was discussed.
2 Experimental
2.1 Synthesis mechanism
Zn1-xNixS (x=0, 0.01, 0.03, 0.05 and 0.07) nanocrystals were prepared by hydrothermal method [14]. All raw materials used were analytical grade without further purification. The manufacturing process was as follows: according to the chemical formula Zn1-xNixS and the mole ratio of the metal cation, weighed stoichiometric Zn(Ac)2��2H2O, (NH2)2CS and NiCl2��6H2O were dissolved in 80 mL ethylenediamine (C2H8N2) and deionized water (1:1 in volume ratio) to obtain a solution. The mixture was magnetically stirred at room temperature until the solution mixed uniformly for 1 h. Then, the resulting mixed solution was transferred into a 100 mL Teflon-lined stainless steel autoclave. The hydrothermal reaction process was conducted at 200 ��C for 12 h in an oven. At the end of the reaction, the autoclave was cooled to room temperature naturally. The resulting precipitate was separated centrifugally and washed with distilled water and absolute alcohol several times, respectively. The obtained products were dried in an oven at 60 ��C for 10 h. Thus, Zn1-xNixS nanocrystals were collected and used for further studies.
2.2 Characterization techniques
The crystal structure and phase of as synthesized samples were determined by a powder X-ray diffracto- meter (Japan Rigaku D/Max-2400) with Cu K�� radiation at l=1.54056  . The samples were scanned in a 2�� range from 10�� to 90�� with a scanning rate of 0.005 (��)/s and a step size of 0.02��. The average crystalline grain size of the products was estimated from the half maximum width and the peak position of an XRD line broadened according to the Scherer formula. The morphology and microstructure of the samples were observed by high-resolution transmission electron microscopy (HRTEM, JEM-2010). The mole fraction of the products was verified by X-ray energy dispersive spectroscopy (EDS). The absorption spectra were analyzed using ultraviolet�Cvisible (UV-Vis, TU-1901) spectrophotometer.
2.3 Measurement of photocatalytic activity
The photocatalytic activities of pure ZnS and Ni2+- doped ZnS nanorods were investigated by monitoring the decolorization of Rhodamine B (RhB) in an aqueous solution under UV light irradiation at room temperature. In a typical process, 50 mg of photocatalyst powder was added to 100 mL RhB aqueous solution with an initial concentration of 10 mg/L. The mixed suspension was magnetically stirred in a quartz beaker in the dark for 30 min to ensure the adsorption-desorption equilibrium of the prepared catalysts and organic dye molecules in the reaction system. Then, the colloidal solution was irradiated by using a UV light mercury lamp with the central wave length of 365 nm as the light source. The photocatalytic experiment was conducted at room temperature in a cylindrical glass vessel, and the colloid surface was maintained a distance of 30 cm from the light source to avoid heat effect. During the photo- catalytic process, approximately 3 mL irradiated suspension was sampled periodically. The UV-Vis spectrum of the supernatant after centrifugation was recorded to observe the adsorption and degradation performance. For the assessment of organic pollutant degradation, typical absorption peak of RhB at 554 nm was chosen as a reference point in absorption spectra. The photocatalytic degradation rate (��) is defined as the following equation: ��=(C0-Ct)/C0��100%, where C0 is the initial concentration of RhB and Ct means the concentration of RhB after light irradiation for time t.
3 Results and discussion
3.1 Phase composition
The XRD patterns of Zn1-xNixS (x=0, 0.01, 0.03, 0.05 and 0.07) nanomaterials are shown in Fig. 1. The diffraction peaks are well ascribed to the reflection of (100), (002), (101), (102), (110), (103) and (112) crystallographic planes of ZnS, respectively. The samples possess single-phase ZnS wurtzite structure (JCPDS card No. 36-1450) with lattice parameters a=3.829 and c=6.279 . No extra peaks of the secondary phases such as metal clusters or metal oxides are observed when the mole fraction of Ni2+ ranges from 1% to 5% in the XRD patterns, which indicates that all Ni2+ effectively substitute Zn2+ sites in the ZnS host lattice without changing the wurtzite structure of the parent ZnS. However, the NiS peaks appearing in the sample Zn0.93Ni0.07S reveal that doping 7% Ni is excessive.
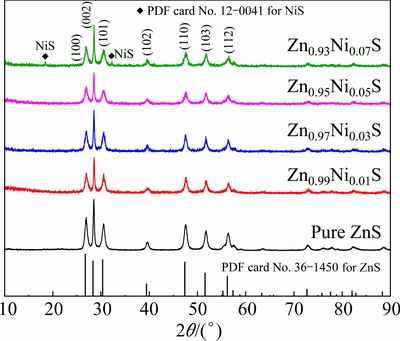
Fig. 1 XRD patterns of Zn1-xNixS (x=0, 0.01, 0.03, 0.05 and 0.07) nanorods
The average crystalline grain size of the products is estimated according to Scherrer formula as follows:
 (1)
(1)
where D represents the average crystalline size, K(=0.89) is the Scherrer constant, �� is the X-ray wavelength (Cu K��, ��=1.54056 ), �� is the Bragg angle and B represents the full width at half maximum of the (002) plane. The crystallite size of the samples is summarized in Table 1. It has been observed that the diffraction peak of the (002) plane gradually increases with increase of Ni2+ content and the crystallite size decreases from 35 to 29 nm with increase of Ni2+ content from 0 to 7%. The lattice constants a and c are calculated by the crystallographic formula:
 (2)
(2)
The corresponding parameters of the diffraction peak (002) for undoped and doped ZnS samples are shown in Table 1. The lattice constant and inter planar distance of Ni2+-doped ZnS samples decrease as the doped Ni2+ content increases. This indicates that the changes in peak position, peak width and peak intensity depend on the lattice parameter because the Ni2+ occupies Zn2+ sites in the wurtzite matrix.
3.2 Morphology
HRTEM is a versatile technique to estimate particle size distribution and structural information. The morphologies of the pure ZnS nanocrystals are high quality one-dimensional nanorod structures in Figs. 2(a) and (b). The diameter is in the range of 10-20 nm, and the average is approximately 15 nm. Meanwhile, the average length is about 100 nm. Compared with pure ZnS, the diameter and length of Zn0.97Ni0.03S nanorods slightly become shorter and wider in Figs. 2(c) and (d). The diameter of Zn0.97Ni0.03S sample is about 20 nm, and the length ranges from 100 to 200 nm, which reveals that a well oriented growth along the (002) direction possesses good crystallization with clear lattice fringe and no obvious defects. The fringe spacing is about 0.312 nm, which is close to the (002) inter planar distance of wurtzite ZnS structure. The shrink of crystal lattice occurs because the radius of Ni2+ (0.69 ) is smaller than that of Zn2+ (0.74 ).
Table 1 Parameters of XRD patterns for Zn1-xNixS (x=0, 0.01, 0.03, 0.05 and 0.07) nanorods

The corresponding selected area electron diffraction (SAED) patterns of pure ZnS and Zn0.97Ni0.03S samples consist of one center and many diffraction rings with different radii in insets of Figs. 2(b) and (d), respectively. The diffraction rings from inside to outside are corresponding to (100), (002), (101), (102), (110), (103) and (112) planes of wurtzite ZnS structure, which is in good agreement with the results of XRD patterns. This further indicates that all Ni2+ successfully substitutes the Zn2+ lattice site.
3.3 Chemical components
Figure 3 depicts the EDS spectra of the pure ZnS and Zn0.97Ni0.03S nanorods to determine the composition of the samples. The spectra reveal that only the expected characteristic peaks of Zn and S elements are present in pure ZnS in Fig. 3(a). For Zn0.97Ni0.03S nanorods, it also obviously confirms the presence of Ni element besides Zn and S elements. Within the detection limit of the instrument, no other impurity atoms are found in Fig. 3(b). The quantitative mole and mass fractions of the compositional elements are indicated in the inset of Fig. 3. The estimated mole fractions of Zn, Ni and S are very close to the nominal values. EDS results indicate that Ni2+-doped ZnS samples are successful synthesized by hydrothermal method, further verifying XRD conclusion. Ni2+ ions are successfully substituted as dopant in Zn0.97Ni0.03S matrix.
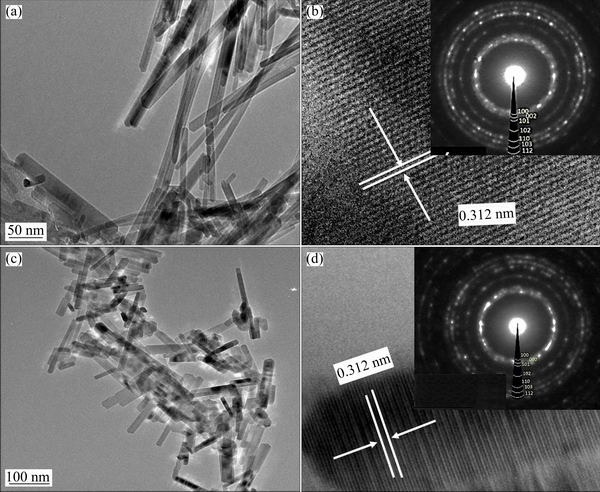
Fig. 2 HRTEM images (a, c) and SAED patterns (b, d) of pure ZnS (a, b) and Zn0.97Ni0.03S (c, d) nanorods
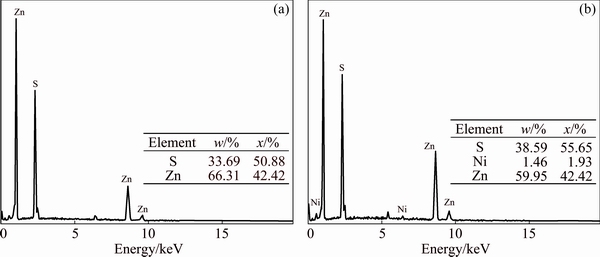
Fig. 3 EDS spectra of pure ZnS (a) and Zn0.97Ni0.03S (b) nanorods
3.4 UV-Vis spectra
The UV-Vis absorption spectra for Zn1-xNixS (x=0, 0.01, 0.03, 0.05 and 0.07) samples are recorded in Fig. 4. Ni2+-doped ZnS samples exhibit an obvious enhanced absorbance in the UV light region (<350 nm) compared with pure ZnS. The optical band gap is calculated according to Tauc relation as follows [15]:
 (3)
(3)
where h�� is the incident photon energy, �� is the photic frequency, Eg is the optical band gap, A(=4��k/��) represents the absorption coefficient, h is the Plank constant, k and �� represent the absorbance and wavelength, respectively, and �� is the absorption coefficient, which is obtained using the Kubelka�CMunk function:
��=F(R)=(1-R)2/(2R) (4)
where R is the percentage of reflected light. For direct band gap ZnS nanocrystals, n=1/2, (��h��)2 gives the best linear fitting curve in the band edge region. The relationship between (��h��)2 and h�� is represented by the inset of Fig. 4. The values of Eg are obtained by extrapolating the linear region of the curve on h�� axis at (��h��)2=0. The estimated optical band gaps of Zn1-xNixS (x=0, 0.01, 0.03, 0.05 and 0.07) samples are 3.79, 3.77, 3.74, 3.75 and 3.76 eV, respectively. It is obviously seen that the band gap of pure ZnS is higher than that of the doped ZnS, therefore red shift occurs. Furthermore, the band gaps of the doped ZnS decrease as Ni2+ doping content increases. It is critical that Zn0.97Ni0.03S sample exhibits the minimum band gap (3.74 eV). The s-d and p-d interactions create positive corrections to the valance band and conduction band edges, respectively, leading to the band gap narrowing.
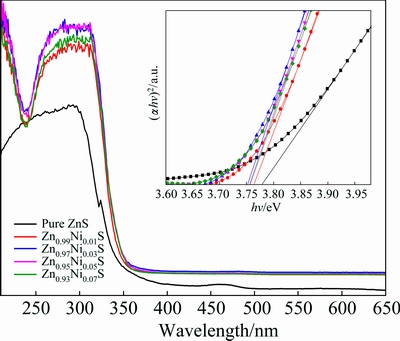
Fig. 4 UV-Vis absorption spectra of Zn1-xNixS (x=0, 0.01, 0.03, 0.05 and 0.07) nanorods
3.5 Photocatalytic activity
In order to study the influence of doping content on the degradation rate, the photocatalytic activities of Ni2+-doped ZnS nanorods were evaluated for the photodegradation of RhB in aqueous solution under UV light irradiation. Figure 5 shows the RhB degradation of Zn1-xNixS samples with different doping contents versus time (t) under UV light irradiation. The RhB cannot be disintegrated in aqueous solution under UV light irradiation for 180 min, which reveals good stability without catalyst, implying good photocatalytic activity of Zn1-xNixS (as catalyst) samples.
The degradation rate of pure ZnS for RhB after UV light irradiation for 180 min is 36.5%, exhibiting relatively high photocatalytic performance. Ni2+-doped ZnS samples display greatly higher photocatalytic activities pure ZnS. The degradation rates for Zn1-xNixS (x=0.01, 0.03, 0.05 and 0.07) are 94.04%, 98.53%, 91.21% and 86.82%, respectively. This demonstrates that the dopant in localized electronic states is served as photo-generated charge carrier traps under UV light irradiation. Furthermore, the photocatalytic activity of the doped ZnS increases with increasing the Ni2+ doping content from 0 to 3%, and it then decreases with further increasing Ni2+ doping content.
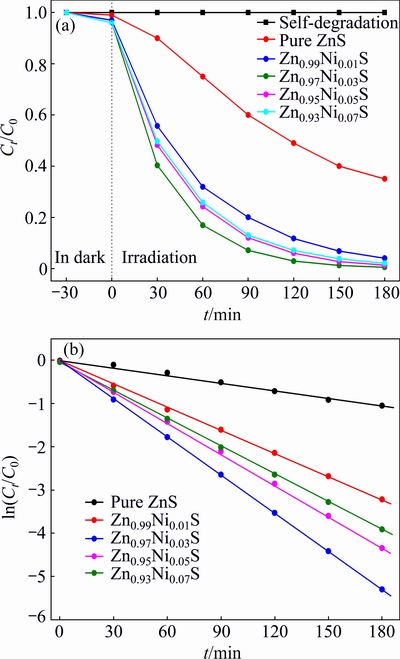
Fig. 5 Photocatalytic activities (a) and first-order kinetics plot (b) of Zn1-xNixS (x=0, 0.01, 0.03, 0.05 and 0.07) nanorods
Zn0.97Ni0.03S photocatalyst demonstrates the maximum degradation rate of 98.53%, which indicates that there exists an optimal doping content of 3% for catalysts to photodegrade RhB dyes. The increased photocatalytic activity of Ni2+-doped ZnS nanorods is ascribed to the crystal structure and band structure of the semiconductor adjusted by doping Ni2+ ions. The doped Ni2+ ions are help to enhance the separation efficiency of electron-hole pairs. In addition, they effectively increase the transport of photogenerated carriers and recombination of electrons and holes, which is beneficial to the photocatalytic activities of RhB. However, excessive Ni2+ ions have a negative effect on the photocatalytic activity when the Ni2+ doping content exceeds 3% owing to the increase of recombination probability of electron-hole pairs.
The first-order kinetics plot of Zn1-xNixS nanorods for the photodegradation of RhB is shown in Fig. 5(b). The degradation rate of the RhB accords well with pseudo-first-order kinetic equation:
ln(Ct/C0)=-kt (5)
where Ct and C0 are the concentrations at time t and initial concentration of RhB, respectively, t is the irradiation time, and k denotes the apparent first-order reaction rate constant. The rate constant k is determined from the plot of ln(Ct/C0) versus t. The k values of photocatalytic degradation rate for Zn1-xNixS (x=0, 0.01, 0.03, 0.05 and 0.07) are 0.0058, 0.0177, 0.0292, 0.0239 and 0.0215 min-1, respectively. The photocatalytic activities of Ni2+-doped ZnS samples increase with increasing the Ni2+ doping content until reaching the maximum value firstly, and then decline with further increase of Ni2+ concentration. It is worthy to mention that the rate constant of the Zn0.97Ni0.03S nanorods is 0.0292 min-1, which is about four times larger than that of pure ZnS. Meanwhile, it is much higher than those of Zn1-xNixS (x=0, 0.01, 0.05 and 0.07). Ni-doped ZnS samples could improve the photocatalytic performance under UV light irradiation, which is attributed to doped Ni2+ ions, predominantly narrowing the optical band gap and enhancing optical absorption intensity via recombination of electrons and holes.
The recycling reactions were carried out for the RhB photodegradation of Zn0.97Ni0.03S sample to study the stability and reusability, as shown in Fig. 6(a). Even though the RhB photodegradation rate slightly decreases in every cyclic process, the photocatalytic activity is retained over 90% of its original activity after five successive recycling experiments. The XRD patterns of Zn0.97Ni0.03S sample before and after five consecutive photocatalytic reactions without obvious change are shown in Fig. 6(b). Meanwhile, the synthesized Zn1-xNixS nanorods possess better photocatalytic activity for the degradation of RhB and are voluntarily reused in aqueous solution.
3.6 Photocatalytic mechanism
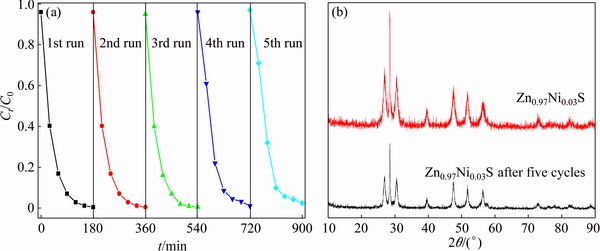
Fig. 6 Recyclability for photocatalytic degradation of RhB (a) and XRD patterns with and without five cycles (b) of Zn0.97Ni0.03S nanorods
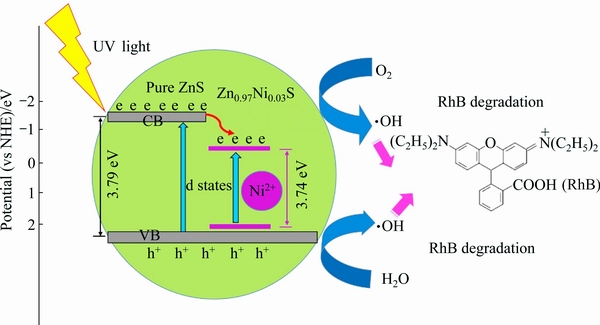
Fig. 7 Photocatalytic degradation mechanism of Zn0.97Ni0.03S nanorods for photodegradation of RhB under UV light irradiation
The possible mechanism of Zn0.97Ni0.03S nanorods for the photodegradation of RhB is proposed in Fig. 7, which illustrates the redox reactions of photo-generated carriers under UV light irradiation. The band edge positions of the conduction band (CB) and valence band
(VB) of the ZnS nanoparticles can be determined using the following equations [16]:
EVB=X-Ee+0.5Eg (6)
ECB=EVB-Eg (7)
where EVB is the VB energy, ECB is the CB energy, X is the electronegativity of the semiconductor, Ee is the free electron energy (4.5 eV, vs NHE), and Eg is the band gap. The CB and VB positions of ZnS and Zn1-xNixS nanorods are qualitatively calculated:
ECB(ZnS)=-1.51 eV, EVB(ZnS)=2.28 eV;
ECB(Zn1-xNixS)=-1.46 eV, EVB(Zn1-xNixS)=2.28 eV.
The electrons (e) in the VB of ZnS are excited to the CB under UV light irradiation, leading to the generation of holes (h+) in the VB of ZnS simultaneously. The doped ZnS effectively promotes the generation of photo- induced electron-hole pairs. The negative charge electrons in the VB jump to the CB by leaving positive charge holes on the VB (Eq. (8)). Because the doped ZnS reduces the average crystallite size and narrows the band gap, electrons from the CB move to the surface of the catalyst, which modifies the oxygen to superoxide anion radicals  The Ni2+ ions could facilitate the transfer of the photogenerated carriers by trapping the excited electrons. Conversely, the photo-generated holes on the VB are available to react with the water solution to form ��OH and H+ (Eqs. (9) and (10)). Hydrogen ions (H+) react with oxygen molecule to form hydrogen peroxide simultaneously (Eq. (11)). Furthermore, the generated hydrogen peroxide reacts with
  to form hydroxyl radicals (��OH), hydroxyl ions (OH-) and oxygen molecule (O2) (Eq. (12)).
These photo-generated hydroxyl radicals (��OH) acting as oxidant agents immensely react with the organic contaminates, which is favourable to the organic pollutant decomposition. Finally, ��OH and oxidize the RhB to CO2, H2O and other small molecule minerals (Eq. (13)) [17-19].
ZnS:Ni+hv��ZnS:Ni(e)+ZnS:Ni(h+) (8)
ZnS:Ni(e)+O2��ZnS:Ni+ (9)
ZnS:Ni(h+)+H2O��ZnS:Ni+��OH+H+ (10)
O2+H+��H2O2 (11)
H2O2+����OH+OH-+O2 (12)
��OH,+organic molecules��H2O+CO2+minerals (13)
4 Conclusions
(1) Zn1-xNixS nanorods with different Ni doping contents (x=0, 0.01, 0.03, 0.05 and 0.07) were synthesized by hydrothermal method. All Zn1-xNixS nanorods synthesized using this method possess wurtzite structure with good crystallization. Ni2+ ions occupy the lattice site of Zn2+ to generate single-phase ZnS nanocrystals.
(2) The morphologies of all the samples are uniform one-dimensional nanorods with good dispersion. The crystalline size decreases and the shrink of lattice constant occurs as Ni2+ doping content increases. The band gap of Zn1-xNixS nanocrystalline is smaller than that of pure ZnS, thus red shift occurs.
(3) The doped Zn1-xNixS samples enhance photo- catalytic activities for the photodegradation of RhB under UV light irradiation. The Zn0.97Ni0.03S sample exhibits the best photocatalytic performance and maximum rate constant.
References
[1] ASLAM S, MUSTAFA F, AHMAD M A, SALEEM M, IDREES M, BHATTI A S. Photovoltaic performance and impedance spectroscopy of ZnS-Cu-Go nanocomposites [J]. Ceramics International, 2018, 44: 402-408.
[2] WANG Jia-jia, TANG Lin, ZENG Guang-ming, ZHOU Yao-yu, DENG Yao-cheng, FAN Chang-zheng, GONG Ji-lai, LIU Ya-ni. Effect of bismuth tungstate with different hierarchical architectures on photocatalytic degradation of norfloxacin under visible light [J]. Transactions of Nonferrous Metals Society of China, 2017, 27: 1794-1803.
[3] ZHAO Wen-hua, WEI Zhi-qiang, WU Xiao-juan, ZHANG Xu-dong, ZHANG Li, WANG Xuan. Cr doped SnS2 nanoflowers: preparation, characterization and photocatalytic decolorization [J]. Materials Science in Semiconductor Processing, 2018, 88(4): 173-180.
[4] ZHAO Xin-xin, YANG Hua, LI Shuai-hu, CUI Zi-ming, ZHANG Cai-rong. Synthesis and theoretical study of large-sized Bi4Ti3O12 square nanosheets with high photocatalytic activity [J]. Materials Research Bulletin, 2018, 107: 180�C188.
[5] HOROZ S. Effect of Eu2+ doping on structural, optical, magnetic and photovoltaic properties of ZnS quantum dots [J]. Superlattices and Microstructures, 2017, 111: 1043-1049.
[6] LIU Kui-li, LI Ji-tao, LIU Quan-tao, MENG Ming, HU Ling-wei, XU Chun-xiang. Two-photon absorption induced photoluminescence from ZnS nanowires [J]. Journal of Alloys and Compounds, 2017, 718: 122-125.
[7] VIRPAL, KUMAR J, THANGARAJ R, SHARMA S, SINGH R C. Enhanced dielectric permittivity and photoluminescence in Cr doped ZnS nanoparticles [J]. Applied Surface Science, 2017, 416: 296-301.
[8] CAI Dong, YUAN Xi, ZHU De-hua, ZHOU Hong-ming, LI Hai-bo, ZHAO Jia-long. Al-doped ZnS shell as a surface shield for enhancing the stability of Cu: ZnInS/ZnS/ZnS: Al quantum dots and their application in light emitting diodes [J]. Materials Research Bulletin, 2017, 94: 241-246.
[9] SAHRAEI R, MOHAMMADI F, SOHEYLI E, ROUSHANI M. Synthesis and photoluminescence properties of Ru-doped ZnS quantum dots [J]. Journal of Luminescence, 2017, 187: 421-427.
[10] CHEN S Q, ZAEIMIAN M S, MONTEIRO J, ZHAO J L, MAMALIS A G, DE BETTENCOURT-DIAS A, ZHU X S. Mn doped AIZS/ZnS nanocrystals: Synthesis and optical properties [J]. Journal of Alloys and Compounds, 2017, 725: 1077-1083.
[11] TRUNG D Q, THANG P T, HUNG N D, HUY P T. Structural evolution and optical properties of oxidized ZnS microrods [J]. Journal of Alloys and Compounds, 2016, 676: 150-155.
[12] JOTHIBAS M, MANOHARAN C, JOHNSON JEYAKUMAR S, PRAVEEN P, KARTHARINAL PUNITHAVATHY I, PRINCE RICHARD J. Synthesis and enhanced photocatalytic property of Ni doped ZnS nanoparticles [J]. Solar Energy, 2018, 159: 434-443.
[13] BAI Jin-wu, LI Yun, JIN Peng, WANG Jun-feng, LIU Lu. Facile preparation 3D ZnS nanospheres-reduced graphene oxide composites for enhanced photodegradation of norfloxacin [J]. Journal of Alloys and Compounds, 2017, 729: 809-815.
[14] ZHAO Wen-hua, WEI Zhi-qiang, ZHU Xue-liang, ZHANG Xu- dong, JIANG Jin-long. Optical and magnetic properties of diluted magnetic semiconductors Zn0.95M0.05S nanorods prepared by hydrothermal method [J]. International Journal of Materials Research, 2018, 109(5): 405-412.
[15] ASHOK KUMAR M, MUTHUKUMARAN S. Effect of deposition time on structural, optical and photoluminescence properties of Cd0.9Zn0.1S thin films by chemical bath deposition method [J]. Journal of Materials Science: Materials in Electronics, 2013, 24: 2858-2865.
[16] SUBRAMANYAM K, SREELEKHA N, AMARANATHA REDDY D, MURALI G, RAHUL VARMA K, VIJAYALAKSHMI R P. Chemical synthesis, structural, optical, magnetic characteristics and enhanced visible light active photocatalysis of Ni doped CuS nanoparticles [J]. Solid State Sciences, 2017, 65: 68-78.
[17] SREELEKHA N, SUBRAMANYAM K, AMARANATHA REDDY D, MURALI G, RAHUL VARMA K, VIJAYALAKSHMI R P. Efficient photocatalytic degradation of rhodamine-B by Fe doped CuS diluted magnetic semiconductor nanoparticles under the simulated sunlight irradiation [J]. Solid State Sciences, 2016, 62: 71-81.
[18] REDDY D A, CHOI J, LEE S, KIM Y, HONG S, KUMAR D P, KIM T K. Hierarchical dandelion-flower-like cobalt-phosphide modified CdS/reduced graphene oxide-MoS2 nanocomposites as a noble- metal-free catalyst for efficient hydrogen evolution from water [J]. Catalysis Science & Technology, 2016, 6: 6197-6206.
[19] ISLAM M J, REDDY D A, CHOI J, KIM T K. Surface oxygen vacancy assisted electron transfer and shuttling for enhanced photocatalytic activity of a Z-scheme CeO2-AgI nanocomposite [J]. RSC Advances, 2016, 6: 1934-19350.
ˮ�ȷ��Ʊ�������ZnS���װ�������֯��������
���Ļ�1,2��κ��ǿ1,2��������1������2���� ��2���� �2
1. ����������ѧ ʡ��������ɫ�����Ƚ��ӹ��������ù����ص�ʵ���ң����� 730050��
2. ����������ѧ ��ѧԺ������ 730050
ժ Ҫ������ˮ�ȷ��ϳɴ�ZnS��Ni����ZnS���װ���ͨ��X��������(XRD)���߷ֱ����������(HRTEM)��ɫɢ������������(EDS)������ɼ����չ���(UV-Vis)�ȼ����ֱ��о�Ni���Ӷ���Ʒ������ṹ����ò��Ԫ����ɺ�ѧ���ܵ�Ӱ�죬��ͨ�������������ˮ��Һ�н����л�Ⱦ������B(RhB)�о�Zn1-xNixS���װ��Ĺ�����ԡ����������������Ʒ������п��ṹ���ᾧ���á���Ʒ����ò��Ϊһά���װ��ṹ����ɢ�ԽϺã��������������䡣����Zn1-xNixS�Ĵ�϶С�ڴ�ZnS�ģ���ˣ�������������Ni����ZnS ���ײ�������ǿ�����л�Ⱦ������B�Ĺ�����ԣ�������Zn0.97Ni0.03S��Ʒ������B���нϺõĹ�����ܺ���ȶ��ԡ�
�ؼ��ʣ�Zn1-xNixS���װ�������ṹ������֯��������ԣ�ˮ�ȷ�
(Edited by Wei-ping CHEN)
Foundation item: Project (51261015) supported by the National Natural Science Foundation of China; Project (1308RJZA238) supported by the Natural Science Foundation of Gansu Province, China
Corresponding author: Zhi-qiang WEI; Tel: +86-931-2973780; E-mail: qianweizuo@163.com
DOI: 10.1016/S1003-6326(18)64924-6

