α���Ƶ�����ŷ�����ǿ���ſ�����Ӧ��
��Դ�ڿ����й���ɫ����ѧ��(Ӣ�İ�)2020���3��
�������ߣ����� ����� Ԭ�� ������ ���ӽ�
����ҳ�룺774 - 788
�ؼ��ʣ�α����źţ�Ƶ�����ŷ����������ŷ���ǿ��Ÿ��ţ�����������������ɽͭ��
Key words��pseudo-random signal; frequency domain electromagnetic method; wide field electromagnetic method (WFEM); strong interference; anti-interference capability; Dongguashan copper deposit
ժ Ҫ��Ϊ��Ѱ��������ɽ��߲��ҿ�������ֶΣ��ڰ��ն���ɽͭ�������ж��ֵ�ŷ����ĶԱ��о������ڸõ����ܵ����ص����ĵ�Ÿ��ţ���ͳ�ĵ�ŷ���ȡ����Ч�����ݡ�Ȼ���������ŷ�(WFEM)����α����ź���Ϊ����Դ��ֻ�����һ����ų�������ɴﵽ��̽Ч�������п���������ǿ������Ч�ʸߵ��ŵ㡣�������ŷ�Ӧ���ڶ���ɽ�������Աȷ�����Ƶ��ص�ŷ�(AMT)���ɿ�Դ��Ƶ��ص�ŷ�(CSAMT)��WFEM��ԭʼ���ݡ����������WFEM��ǿ���ſ����ܻ�ø����������ݣ��䷴�ݽ����������λ�õķ�ӳ����֪���Ͻ���Ǻϣ�˵��WFEM��һ��ǿ���ſ�����߲��ҿ�������ֶΡ�
Abstract: Due to the strong electromagnetic interferences and human interference, traditional electromagnetic methods cannot obtain high quality resistivity data of mineral deposits in Chinese mines. The wide field electromagnetic method (WFEM), in which the pseudo-random signal is taken as the transmitter source, can extract high quality resistivity data in areas with sever interference by only measuring the electric field component. We use the WFEM to extract the resistivity information of the Dongguashan mine in southeast China. Compared with the audio magnetotelluric (AMT) method, and the controlled source audio-frequency magnetotelluric (CSAMT) method, the WFEM can obtain data with higher quality and simpler operations. The inversion results indicate that the WFEM can accurately identify the location of the main ore-body, which can be used for deep mine exploration in areas with strong interference.
Trans. Nonferrous Met. Soc. China 30(2020) 774-788
Yan-fang HU1,2,3, Di-quan LI1,2,3, Bo YUAN1,2,3, Guang-yun SUO1,2,3, Zi-jie LIU4
1. Key Laboratory of Metallogenic Prediction of Nonferrous Metals and Geological Environment Monitoring, Ministry of Education, Central South University, Changsha 410083, China;
2. Hunan Key Laboratory of Nonferrous and Geological Hazard Detection, Control South University, Changsha 410083, China;
3. School of Geosciences and Info-Physics, Central South University, Changsha 410083, China;
4. Research Institute No. 230, CNNC, Changsha 410011, China
Received 24 May 2019; accepted 28 December 2019
Abstract: Due to the strong electromagnetic interferences and human interference, traditional electromagnetic methods cannot obtain high quality resistivity data of mineral deposits in Chinese mines. The wide field electromagnetic method (WFEM), in which the pseudo-random signal is taken as the transmitter source, can extract high quality resistivity data in areas with sever interference by only measuring the electric field component. We use the WFEM to extract the resistivity information of the Dongguashan mine in southeast China. Compared with the audio magnetotelluric (AMT) method, and the controlled source audio-frequency magnetotelluric (CSAMT) method, the WFEM can obtain data with higher quality and simpler operations. The inversion results indicate that the WFEM can accurately identify the location of the main ore-body, which can be used for deep mine exploration in areas with strong interference.
Key words: pseudo-random signal; frequency domain electromagnetic method; wide field electromagnetic method (WFEM); strong interference; anti-interference capability; Dongguashan copper deposit
1 Introduction
The technologies based on the electromagnetic field with natural sources, such as the magnetotelluric (MT) method and the audio magnetotelluric (AMT) method, have been widely used in mineral resources exploration and regional geological structure research [1,2]. And the AMT method performs better than the MT method in the mineral resources exploration of shallow surface within 2.0 km, due to its higher frequency. However, the MT and AMT methods are both susceptible to electromagnetic interferences, because of their weak natural field source signals and random polarization directions. So, they cannot obtain reliable resistivity data in areas with sever interferences [3,4]. Some technologies based on controllable artificial field source have been developed to solve geological problems [5], such as the controlled source audio-frequency magneto- telluric (CSAMT) method and the transient electromagnetic method (TEM). The CSAMT method has been widely used in fields such as mining, geothermal resource exploring and environmental sciences [6-9]. The TEM, an artificial source time-domain electromagnetic method, has been successfully used to identify water-bearing geology, coal mine goafs, and deep irregular water bodies [10,11]. However, these methods cannot obtain reliable data in areas with strong interferences. Furthermore, some strong interferences cannot be removed by preprocessing methods, including smoothing, filtering, and data mining [12].
The wide field electromagnetic method (WFEM) based on the pseudo-random artificial field source was developed to obtain reliable resistivity information in areas with strong interferences [13]. The WFEM has many advantages. First, it can transmit multiple excitation signals of different frequencies simultaneously, and obtain multiple frequency geoelectric information at the same time, which avoids the electromagnetic interference caused by random signals. Second, WFEM is simple and efficient, since it only needs to measure the electric field component. Furthermore, with great transmission current, WFEM has strong anti-interference ability and has been widely used in metal ore and shale gas exploration. The WFEM can capture the low resistivity of carbonaceous shale and identify the electrical distribution patterns [14]. The WFEM could provide information about strata distribution, geological structures, and fracture zones to reveal the prospect of hydrocarbons, which may contribute to the shale gas exploration [15]. In addition, WFEM can be used to find some hidden gold deposits and delineate the favorable areas, which has been confirmed by excavation [16]. Thus, the method is effective and feasible in exploring deep metal mineral resources.
The Dongguashan copper deposit in Tongling city of southeast China has strong interferences caused by the geological structure and human activities. Traditional methods, such as the MT, AMT and CSAMT methods, cannot extract reliable resistivity information for mine exploration. In this study, we attempt to extract resistivity information using the WFEM. Firstly, we analyze the distribution and characteristics of electromagnetic interference sources near a profile, BD-1. Then, we analyze the influence of the electric current on the effectiveness of the WFEM in the test area. After that, we compare the quality of the raw data acquired by the WFEM with that by AMT and CSAMT methods. Finally, we inverse the data acquired by the WFEM and compare the results with the known information.
2 WFEM method
2.1 2n sequence pseudo-random signals
The source of the WFEM is the 2n sequence pseudo-random signal, which seems random and irregular but is actually regular [17-19]. The 2n sequence pseudo-random signal is a pseudo-random binary signal with the period of 2i (i=1, 2, ��, n). The number of its harmonic components increases with the period. The basic frequency and multiple harmonics are the main components of the 2n pseudo-random signal, and they have similar large amplitudes. Furthermore, the energy of 2n sequence pseudo-random signals in the frequency domain distributes uniformly in the logarithmic coordinates, which helps the exploration. Figure 1 shows the time series waveform and frequency spectrum of the 7-2 frequency group, in which the 7 main frequencies, 1, 2, 4, 8, 16, 32 and 64 Hz, have similar amplitudes.
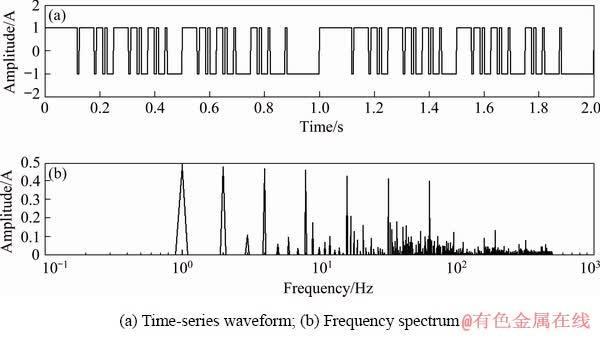
Fig. 1 2n sequence pseudo-random signal
The WFEM uses the 2n sequence pseudo- random signal as the source, which can transmit and receive 7 frequencies simultaneously, and thus avoid the electromagnetic interference caused by random signals. It also reduces the data collection time and improves the working efficiency.
2.2 WFEM apparent resistivity
The WFEM is a frequency domain electro- magnetic method, collecting data in a wide field using the 2n sequence pseudo-random signal as the transmission source. The WFEM uses horizontal electric dipoles or perpendicular magnetic dipoles as the field source and extracts the apparent resistivity by only measuring one electromagnetic field component. Taking the E-Ex measurement method as an example, the WFEM only needs to measure the horizontal x-direction electric field:
 (1)
(1)
where �� is the conductivity.
According to Eq. (1), the WFEM apparent resistivity is defined as
 (2)
(2)
 (3)
(3)
 (4)
(4)
 (5)
(5)
where ��a is the WFEM apparent resistivity, I is the transmitting current, dL is the distance between horizontal electric dipoles, r is the transmit-receive distance, k is the wave number, �� is the azimuth, ��VMN is the potential difference between Station M and Station N,  is the electromagnetic effect function with an unknown resistivity ��,
  is the coefficient only related to the geometry of the observing device, and MN is the distance between Station M and Station N. The WFEM employs the iterative method to solve the optimal value of apparent resistivity so that it can be used for mine exploration by only solving one electric field component. Therefore, the WFEM can effectively improve the data quality in ore cluster areas with strong interferences.
3 Experiment
3.1 Experiment area
The Dongguashan copper mine is located in the middle of the Shizishan mining area in southeast China. The elevation of this area gradually decreases from southwest to northeast (Fig. 2(a)). The highest point is Laoyaling, located in the southwest of the mining area, with an elevation of about 250 m. The elevation of the lakeside section in the northern part is between 10 and 15 m. We chose line BD-1 as the test profile (Fig. 2(b)), because the main ore body on this profile has been exposed by 4 drillings, providing information for validation. Line BD-1 is 2200 m long and has 45 test stations with a spacing of 50 m, including stations 78, 79, 88, 100, 101, 110 and 118. The distance between transmitter and receiver is 7850 m and the dipole length AB is 1100 m.
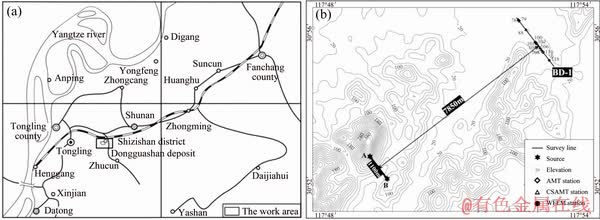
Fig. 2 Location of study area (a) and profile BD-1 (b)
The main orebody of the Dongguashan copper deposit is strictly controlled by the lithology of the ore-containing layer and belongs to the stratabound skarn-type copper deposit [20-22]. The gangue mineral mainly includes altered minerals, such as serpentine and talc, and skarn-type minerals, such as garnet and diopside. The ore mineral contains pyrrhotite, pyrite, chalcopyrite and magnetite. The main orebody is located in the axis and two wings of an anticline and is strictly controlled by the middle and upper Carboniferous Huanglong-Chuanshan Formation (C2+3) strata. The main orebody is stratified, and the occurrence of orebody is nearly consistent with the ore-control strata. The orebody possesses the highest elevation with an anticlinal uplift, showing an incomplete dome shape and undulations along the strike and dip.
According to the logging data (Table 1), all the strata have high resistivity (average 1000 ����m) and low polarization (2%-3%). However, the resistivity of the Permian Dalong Formation (P2d) and the Gufeng Formation (P1g) is much lower than that of other formations (10-350 ����m), and the polarizability of them is larger than 40%. So, these two formations may have impacts on electro- magnetic exploration. Invading rocks (diorite) have a resistivity of several hundred ����m and the polarizability of 2%-4%. The electrical properties of ore bodies vary with the mineralization properties and degree, and are mainly characterized by low resistivity (<100 ����m) and high polarizability (>60%) [23].
3.2 Interferences
The residential areas of miners usually closely distribute around the mining area in China. With the increase of human activities, the electromagnetic field induced by human activities grows in both the spatial and time domains. The number of frequency points increase in the frequency domain, and the energy of different spectra also becomes stronger. The 50 Hz frequency interference consists of the electric field interference and magnetic field interference. The former is mainly caused by high-voltage transmission lines near the well head. The latter is mainly due to the power supply line of ore cars. As Fig. 3 shows, the interferences within 2 km around the profile BD-1 include high-voltage lines, dressing plant, railways, and highways. There is a high voltage wire (110 kV) about 1 km southwest to the profile BD-1. WU et al [24] have tested electromagnetic interference characteristics of some measuring stations on the profile BD-1. The results showed that the electromagnetic interferences of the Dongguashan mining area are dominated by the power frequency odd harmonic interference, with strong even harmonics at some points. In addition, there is broadband background interference in the entire spectrum with a relatively stable amplitude. The long-term noise test showed that there is no weak interference period in the mining area [24].
Table 1 Physical properties of rock (ore) in logging
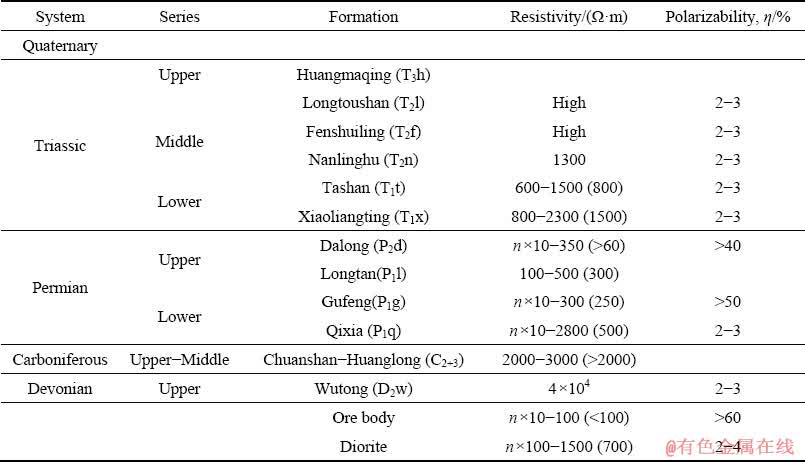

Fig. 3 Interference sources in area
Figure 4 shows the natural MT field time domain signals of Station 118 on profile BD-1 collected by V5-2000. The natural field signal is a kind of stationary random signal, which has random polarization with small amplitude, weak energy and irregularity [1]. However, the amplitude of the electromagnetic field signal is relatively large (up to 105 order) over the entire MT measurement band, which means that the range of interference bands in the work area is wide and has large energy. The time domain signal has obvious large-scale class-step waves, triangular waves and charge-discharge waves, which have large amplitudes and strong energy. Note that, the magnetic field signal is more susceptible to interference in the medium and low frequency bands. The natural field signal is completely covered by large-scale interference, resulting in extremely low signal-to- noise ratio (SNR), which seriously reduces the data quality.
As exhibited in Fig. 5, the apparent resistivity of Station 118 fluctuates severely, but the electric field shows a stable growing trend with the decreasing frequency, except the small fluctuations at frequency lower than 1 Hz. The SNR of electric field Ex is low, especially in the low frequency bands, so the signal cannot be a natural field signal, though the waveforms and characteristics of natural field signals cannot be accurately defined yet [25-27]. In addition, the sharp pulses in the signal may be caused by a floating current or the shut-off of a large power supply. Therefore, the analysis on the natural field signals in the time domain shows that there are strong electromagnetic interferences in the work area and passive source exploration methods will not be able to obtain reliable data. These strong interfering signals cannot be removed by time or space-domain based denoising methods, such as the remote- reference, robust estimation, wavelet transform, empirical mode decomposition, and morphological filtering [28-34].
3.3 Current test
In this study, the transmission currents of the WFEM and the CSAMT method were 100 and 18 A, respectively. In order to verify the anti-interference ability of the WFEM method itself rather than the high transmission current, we compared the apparent resistivity obtained by WFEM using different transmission currents (Fig. 6).
As shown in Fig. 6, the apparent resistivity curves of 100, 50 and 20 A overlap with each other and have a smooth and continuous trend, with a few ��flying points��, which means that the emission currents have no great influence on the performance of WFEM. Even the emission current of 20 A provides reliable apparent resistivity data. But in this study, we choose the 100 A emission current to suppress the strong electromagnetic interference more effectively and improve the SNR.
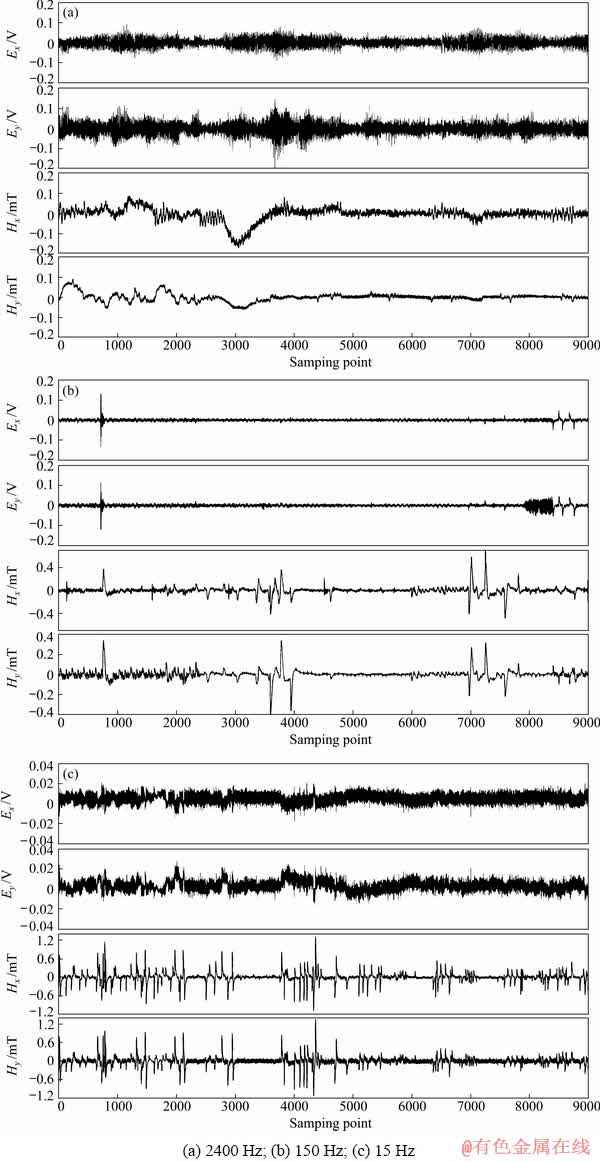
Fig. 4 Natural field time series at Station 118 on profile BD-1 recorded by V5-2000 with different sampling rates

Fig. 5 MT data of Station 118

Fig. 6 Comparison of apparent resistivity obtained by WFEM using different transmission currents
4 Raw data comparison
We compared the raw data acquired by the AMT method using natural source with that obtained by the CSAMT method and WFEM using controlled source. The mean square error (MSE) from data of some checkpoints collected by the three methods (Table 2) and the variations in the electric and magnetic fields before and after power supply show that the controlled source electro- magnetic methods, especially WFEM, perform better in mining area with strong interferences.
Table 2 MSE of three methods
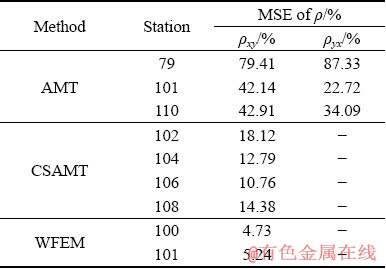

Fig. 7 Apparent resistivities of AMT checkpoints
In the comparison, the data of AMT Station 79 are from the hybrid field source high-frequency magnetotelluric measurements [12], which were collected with the conductivity imager EH4. In their experiment, tensor was used to measure the AMT, and the frequency ranged from 100 kHz to 10 Hz [12]. Artificial field sources were used within the frequency range to increase the SNR. Signals of natural fields were collected in the frequency range from 1 kHz to 10 Hz. At Station 79 of profile BD-1, the ��xy error is 79.41% (Fig. 7(a)) and the ��yx error is 87.33% (Fig. 7(d)). The natural field high- frequency magnetotelluric measurements of AMT stations 101 and 110 were also collected by EH4 (Fig. 7) [12]. The tensor measuring method was also used, with the operating frequency ranging from 92 kHz to 10 Hz. The MSE between stations 101 and 110 is shown in Table 2. It can be seen that the errors of second measurement and the first measurement of Station 79 are the largest, and the curves of the two measurements severely fluctuate. In comparison, the ��yx error of Station 101 and Station 110 is small, and the curves of the two measurements are smooth, but the measurement error still exceeds the specification requirements, 10%. The AMT method cannot obtain reliable data due to the strong electromagnetic interference in the mining area.
The data qualities of profile BD-1 before and after adding power supply to Stations 78 and 83 are compared in Fig. 8. The electromagnetic field values fluctuate severely before adding power supply, and they become stable after adding power supply. Furthermore, after adding the power supply, both the electric field and magnetic field curves are more continuous in the low frequency band than in the high frequency band.
Figure 9 shows the apparent resistivity of the CSAMT checkpoints [12]. Compared with the results of the AMT method (Fig. 7), the values of the CSAMT checkpoints are more stable and have less flying points. The curves of the two measurements almost overlap except for a few points. However, the mean square error (MSE) is greater than 10% (Table 2). The resistivity range is 106-108 ����m, which is inconsistent with the actual value. Although the CSAMT method can suppress part of the electromagnetic interference and strengthen the signal of some frequency bands, it cannot obtain the reliable data of the full frequency band in the area with strong interference.
The WFEM adopts the wide-field electro- magnetic observation system and uses a pseudo- random signal with 7-frequency wave as the transmitted signal. In this study, the emission current was 100 A and the transmit-receive distance was 7850 m. We adopted 28 frequencies ranging between 0.75 and 8192 Hz. Figure 10 compares the electric field of Stations 100 and 101 on profile BD-1 before and after adding the power supply. The electric field curves of artificial source are smooth and continuous, and have a similar trend at these two stations. The value increases with the decreasing frequency before it reaches the peak at 1��102 Hz, and then decreases. Due to the strong electromagnetic interference, the natural field data distort severely. So, the WFEM performs well in suppressing interference.

Fig. 8 Comparison of electromagnetic field value of profile BD-1
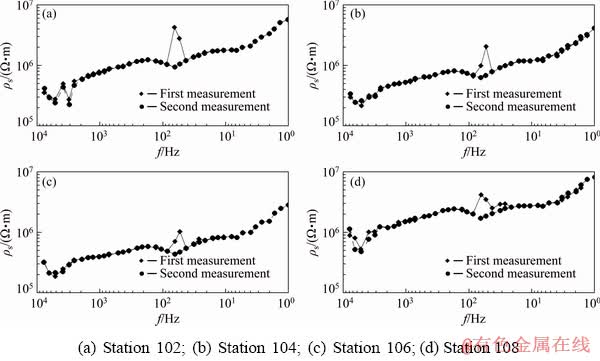
Fig. 9 Comparison of BD-1 line data collected by V8 instrument

Fig. 10 Comparison of electric field data before and after power supply
We measured the resistivity at Stations 100 and 101 on profile BD-1 by WFEM twice and compared the results. As Fig. 11 shows, all curves overlap with each other, which means that results of the two measurements are in good agreement, except a few points. The MSE values of Station 100 and Station 101 are 4.73% and 5.24%, respectively. This means that the results of WFEM are reliable.
The quality of the raw data collected by WFEM in the area with strong interference is better than that collected by the AMT and CSAMT methods. Even in areas with strong electromagnetic interferences, WFEM can select appropriate test parameters and obtain reliable data.
5 Inversion results
As has been illustrated in Section 4, natural field electromagnetic methods, such as the AMT method, cannot obtain effective data in mines with strong interferences. Although the CSAMT method performs better than the AMT method in reducing interference and obtaining high quality raw data, it cannot obtain reliable data in the full frequency band. The raw data obtained by the WFEM have better quality than those of other methods. Therefore, we inversed the raw data of the study area got by the WFEM using the GME_3DI software system [35]. In order to verify the inversion method, we established a five-layer theoretical geoelectric model using the logging resistivity information, the electrical characteristic of the specimen and the known geological profiles (Fig. 12(a)). The first layer is the high resistivity formation (1000 ����m). The second layer is an 80 m-thick low resistivity formation (100 ����m). The resistivity of the third layer is 500 ����m. The fourth layer is the target stratum of the ore body, with a thickness of about 100 m and a resistivity of 30 ����m. The fifth layer has the highest resistivity (5000 ����m). The grid is 10 m �� 20 m and the site spacing is 50 m. The frequency used is 0.0117-8192 Hz.

Fig. 11 Electric field (a, b) and resistivity (c, d) data collected by WFEM at checkpoints of Station 100 (a, c) and Station 101 (b, d)

Fig. 12 Five-layer geoelectric model (a) and inversion results (b)
Figure 12(b) shows the 2D inversion result of the geoelectric model. There are two low-resistance layers, one between -400 and -600 m, and the other between -800 and -1000 m. The upper low-resistance layer has a significant influence on the lower one, which brings errors to the interpretation of the ore body beneath it. The inversion reflects two low-resistance layers, and the layering is obvious, indicating the feasibility of the inversion method.

Fig. 13 Geological section and inversion results of data on line BD-1 collected by WFEM
Figure 13 shows the inversion results of the raw data collected by WFEM using the GME_3DI software system and the known geological sections of the BD-1 profile. According to the logging data and the statistical results of the rock ore specimens, there are two low-resistance layers in the BD-1 section: the layer of the Permian coal-bearing strata and the layer of the low-resistivity ore body. The main ore body is located on the axis and two wings of the Qingshan anticline, and it is controlled by the middle and upper layers of the Carboniferous Huanglong-Chuanshan Formation. The top of the ore body is about 1000 m deep and is located between stations 88 and 105. According to the electrical characteristics of rock ore in the mining area, the Triassic layer has high resistivity and low polarizability. As Fig. 13(c) shows, the Permian upper layers (P2d+P2l) and the lower Gufeng Formation layer (P1g) exhibit low resistivity. The Permian Qixia Formation (P1q) exhibits relatively high resistivity. The inversion results of the data collected by the WFEM show that there are two low-resistance layers between -200 and -1000 m (Fig. 13(b)). The one located between -550 and -400 m is interpreted as the Permian coal-bearing stratum. The other is located between -800 and -1000 m and is interpreted as the target ore body. The copper ore body of the mining area is controlled by the interbedded slippage of the Devonian and Carboniferous systems. The main ore body mainly distributes in the Carboniferous strata, which is consistent with the known information. There is obvious discontinuity among Stations 107-110 (Fig. 13(b)), which may be caused by diorite veins that correspond to the geological section diorite. Below and at the two sides of the inferred ore body, there are low-resistance anomalies, which is a sign of mineralization.
6 Conclusions
(1) The interference in the experiment area has wide band range and large energy. There are large-scale class-step waves, triangular waves and charge-discharge waves in the time domain, with large amplitudes and strong energy. These strong interfering signals cannot be removed by the time and space domain based denoising methods.
(2) The current test and the comparison between the WFEM and the AMT and CSAMT methods in terms of electric field before and after adding the power supply show that the WFEM can obtain data with a quality higher than other electromagnetic methods by much simpler operation. This also has been confirmed by the apparent resistivity data of the checkpoints.
(3) The inversion result shows that the location of the main ore-body identified by the WFEM is consistent with the known geological information. Therefore, the WFEM is a promising method for detecting large-depth, complex and concealed ore bodies in mine areas with serious interferences.
References
[1] KAUFMAN A A, KELLER G V. The magnetotelluric sounding method [M]. Amsterdam-Oxford-New York: Elsevier Science Publishing Company, 1981.
[2] STRANGWAY D W, SWIFT C M, HOLMER R C. The application of audio-frequency magnetotellurics (AMT) to mineral exploration [J]. Geophysics, 1973, 38(6): 1159- 1175.
[3] VOZOFF K. The magnetotelluric method in exploration of sedimentary basins [J]. Geophysics, 1972, 37(6): 98-141.
[4] GOLDSTEIN M A, STRANGWAY D W. Audio-frequency magnetotellurics with a grounded electric dipole source [J]. Geophysics, 1975, 40(4): 669-683.
[5] ZONGE K L, HUGHES L J. Controlled source audio- frequency magnetotellurics [M]. Tulsa: Society of Exploration Geophysicists, 1991.
[6] KELLETT R, BISHOP J, van REED E. The effects of source polarization in CSAMT data over two massive sulfide deposits in Australia [J]. Geophysics, 1993, 58(12): 1764-1772.
[7] SANDBERG S K, HOHMANN G W. Controlled-source audiomagnetotellurics in geothermal exploration [J]. Geophysics, 1982, 47(1): 100-116.
[8] BOERNER D E, WRIGHT J A, THURLOW J G, REED L E. Tensor CSAMT studies at the Buchans mine in central new found land [J]. Geophysics, 1993, 58(1): 12-19.
[9] HU X, PENG R, WU G, WANG W, HUO G. Mineral exploration using CSAMT data: Application to Longmen region metallogenic belt, Guangdong Province, China [J]. Geophysics, 2013, 78(3): B111-B119.
[10] DANIELSEN J E, AUKEN E, JORGENSEN F, SONDERGAARD V, SORENSEN K I. The application of the transient electromagnetic method in hydrogeophysical surveys [J]. Journal of Applied Geophysics, 2003, 53(4): 181-198.
[11] JORGENSEN F, SANDERSEN P B E, AUKEN E. Imaging buried Quaternary valleys using the transient electromagnetic method [J]. Journal of Applied Geophysics, 2003, 53(4): 199-213.
[12] DENG Xiao-hong, ZHOU Feng-tong, WU Jun-jie. The results report of crisis mines electric (magnetic) method validity comparison [R]. Beijing: The Chinese Academy of Geological Sciences Institute of Geophysical Geochemical Exploration, 2012. (in Chinese)
[13] HE Ji-shan, LIU Jian-xin. Pseudo-random multi-frequency phase method and its application [J]. The Chinese Journal of Nonferrous Metals, 2002, 12(2): 374-376. (in Chinese)
[14] HE Ji-shan, LI Di-quan, DAI Shi-kun. Shale gas detection with wide field electromagnetic method in North-western Hunan [J]. Oil Geophysical Prospecting, 2014, 49(5): 1006-1012. (in Chinese)
[15] YUAN B, LI D Q, BAYLESS R C. Wide field electromagnetic method for shale gas exploration in southern China: A case study [J]. Journal of Environmental and Engineering Geophysics, 2017, 22(3): 279-289.
[16] DENG Feng-hua, YANG Yang, LI Di-quan. The application of wide-field electromagnetic method to hidden gold deposit [J] Chinese Journal of Engineering Geophysics, 2013, 10(3): 357-362. (in Chinese)
[17] HE Ji-shan, TONG Tie-gang, LIU Jian-xin. Mathematical analysis and realization of an sequence pseudo-random multi-frequencies signal [J]. Journal of Central South University (Science and Technology), 2009, 40(6): 1666-1671. (in Chinese)
[18] HE Ji-shan. Wide field electromagnetic method and pseudo random signal method [M]. Beijing: Higher Education Press, 2010. (in Chinese)
[19] HE J S. Wide field electromagnetic methods [C]//SEG Technical Program Expanded Abstracts 2015. Tulsa: Society of Exploration Geophysicists, 2015: 1006-1011.
[20] LIU Z F, SHAO Y J, WEI H T, WANG C. Rock-forming mechanism of Qingshanjiao intrusion in Dongguashan copper (gold) deposit, Tongling area, Anhui province, China [J]. Transactions of Nonferrous Metals Society of China, 2016, 26(9): 2449-2461.
[21] MAO X C, ZHAO Y, DENG H, ZHANG B, LIU Z K, CHEN J, ZOU Y H, LAI J Q. Quantitative analysis of intrusive body morphology and its relationship with skarn mineralization-A case study of Fenghuangshan copper deposit, Tongling, Anhui, China [J]. Transactions of Nonferrous Metals Society of China, 2018, 28(1): 151-162.
[22] ZOU Y H, LIU Y, PAN Y, YANG K D, DAI T G, MAO X C, LAI J Q, TIAN H L. Numerical simulation of hydrothermal mineralization associated with simplified chemical reactions in Kaerqueka polymetallic deposit, Qinghai, China [J]. Transactions of Nonferrous Metals Society of China, 2019, 29(1): 171-183.
[23] CAI Yun-sheng, ZHANG Jin-guo, YANG Xue-ming. The application effect of EH4 electromagnetic measure in exploration comparison in Dongguashan copper mine region in Tongling, Anhui Province [J]. Mineral exploration, 2011, 2(1): 75-80. (in Chinese)
[24] WU Jun-jie, ZHANG Jie, WANG Xing-chun, YANG Yi, DENG Xiao-hong, CHEN Xiao-dong, ZHAO Yi. The analysis of electromagnetic noise characteristics in the Dongguashan ore district [J]. Geophysical and Geochemical Exploration, 2014, 38(5): 1003-1007. (in Chinese)
[25] TANG Jing-tian, XU Zhi-min, XIAO Xiao. Effect rules of strong noise on magnetotelluric (MT) sounding in the Luzong ore cluster area [J]. Chinese Journal of Geophysics, 2012, 55(12): 4147-4159. (in Chinese)
[26] TANG Jing-tian, LIU Zi-jie, LIU Feng-yi, XIAO Xiao, LI Jin, ZHANG Lin-cheng, XIE Yong. The denoising of the audio magnetlluric data set with strong interferences [J]. Chinese J Geophys, 2015, 58(12): 4636-4647. (in Chinese)
[27] TANG Jing-tian, LI Guang, XIAO Xiao, LI Jin, ZHOU Cong, ZHU Hui-jie. Strong noise separation for magnetotelluric data based on a signal reconstruction algorithm of compressive sensing [J]. Chinese J Geophys, 2017, 60(9): 3642-3654. (in Chinese)
[28] GAMBLE T D, GOUBAU W M, CLARKE J. Magnetotelluric with a remote magnetic reference [J]. Geophysics, 1979, 44: 53-68.
[29] EGBERT G D. Robust multiple-station magnetotelluric data processing [J]. Geophys J Int, 1997, 130: 475-496.
[30] TRAD D O, TRAVASSOS J M. Wavelet filtering of magnetotelluric data [J]. Geophysics, 2000, 65: 482-491.
[31] TANG Jing-tian, LI Jin, XIAO Xiao, ZHANG Lin-cheng, LV Qing-tian. Mathematical morphology filtering and noise suppression of magnetotelluric sounding data [J]. Chinese J Geophys, 2012, 55(5): 1784-1793. (in Chinese)
[32] LI J, ZHANG X, GONG J Z, TANG J T, REN Z Y, LI G, DENG Y L, CAI J. Signal-noise identification of magnetotelluric signals using fractal-entropy and clustering algorithm for targeted de-noising [J]. Fractals, 2018, 26(2): 1840011.
[33] LI J, ZHANG X, TANG J T, CAI J, LIU X Q. Audio magnetotelluric signal-noise identification and separation based on multifractal spectrum and matching pursuit [J]. Fractals, 2019, 27(1): 1940007.
[34] YANG Y, LI D Q, TONG T G, ZHANG D, ZHOU Y T, CHEN Y K. Denoising controlled-source electromagnetic data using least squares inversion [J]. Geophysics, 2018, 83(4): E229-E244.
[35] DAI Shi-kun, XU Shi-zhe. Rapid inversion of magnetotelluric data for 2-D and 3-D continuous media [J]. OGP, 1997, 32(3): 305-317. (in Chinese).
����1, 2, 3�������1, 2, 3��Ԭ ��1, 2, 3��������1, 2, 3�����ӽ�4
1. ���ϴ�ѧ ��ɫ�����ɿ�Ԥ������ʻ������������ص�ʵ���ң���ɳ 410083��
2. ���ϴ�ѧ ��ɫ��Դ������ֺ�̽�����ʡ�ص�ʵ���ң���ɳ 410083��
3. ���ϴ�ѧ �����ѧ����Ϣ����ѧԺ����ɳ 410083��
4. �˹�ҵ�������о�������ɳ 410011
ժ Ҫ��Ϊ��Ѱ��������ɽ��߲��ҿ�������ֶΣ��ڰ��ն���ɽͭ�������ж��ֵ�ŷ����ĶԱ��о������ڸõ����ܵ����ص����ĵ�Ÿ��ţ���ͳ�ĵ�ŷ���ȡ����Ч�����ݡ�Ȼ���������ŷ�(WFEM)����α����ź���Ϊ����Դ��ֻ�����һ����ų�������ɴﵽ��̽Ч�������п���������ǿ������Ч�ʸߵ��ŵ㡣�������ŷ�Ӧ���ڶ���ɽ�������Աȷ�����Ƶ��ص�ŷ�(AMT)���ɿ�Դ��Ƶ��ص�ŷ�(CSAMT)��WFEM��ԭʼ���ݡ����������WFEM��ǿ���ſ����ܻ�ø����������ݣ��䷴�ݽ����������λ�õķ�ӳ����֪���Ͻ���Ǻϣ�˵��WFEM��һ��ǿ���ſ�����߲��ҿ�������ֶΡ�
�ؼ��ʣ�α����źţ�Ƶ�����ŷ����������ŷ���ǿ��Ÿ��ţ�����������������ɽͭ��
(Edited by Bing YANG)
Foundation item: Project (2018YFC0807802) supported by the National Key R&D Program of China; Project (41874081) supported by the National Natural Science Foundation of China
Corresponding author: Di-quan LI; Tel: +86-15802637512; E-mail: lidiquan@csu.edu.cn
DOI: 10.1016/S1003-6326(20)65253-0

