��ѹ�Ͳĺ����������۵�ʵ�鷽���Ƚ�
��Դ�ڿ����й���ɫ����ѧ��(Ӣ�İ�)2020���3��
�������ߣ�B. REGGIANI L. DONATI
����ҳ�룺619 - 634
�ؼ��ʣ��������飻���죻��ѹ�������������飻Ш������
Key words��expansion test; seam welds; extrusion; aluminum; bulge test; wedge test
ժ Ҫ��Ϊ���������ּ�ѹ�ٶ��µĹ�״�Ͳĵĺ���ǿ�ȣ��Ƚ�Ш�����ͺ������������鷽������Ш�������У�������ͨ�����γ�ͷ�������ֱ������������ȷ���������������У�ͨ�������ڲ�����������ʩ�Ӿ�����Ӧ��״̬��ͨ�����Ͽ���ò�ͶϿ�λ�ã��Ƚ����ַ����ڶϿڴ����غɺͻ���Ӧ�䡣Ϊ�����������������Ŀɿ��ԣ��о�������Ʋ�����Ӱ�졣��������������������У�����λ�þ��������Զ��ѣ����������������Ш�������Ϊ�Ƚ��ͱ��أ����ݷ�ɢ�Խ�С����ˣ�ͨ����������ɹ�����Ϊ�Ż�������������Ƶĵڶ��ֹ�״�Ͳĵ����ܣ����ý����һ���µ���ֵ����ָ������õĽ�����бȽϣ����մﵽ���õ�ƥ�䡣
Abstract: The wedge and bulge expansion tests were compared in the assessment of the seam welds strength in a tubular profile extruded at two ram speeds. In the wedge test, the expansion was determined by moving a conical punch into the tube until the specimen fracture. In the bulge test, a hydrostatic tensile stress state was applied by expanding the specimen with an internal rubber plug. The two methodologies were compared in terms of load and hoop strain at fracture and by detecting the fracture morphology and location. Then, the effect of a number of design parameters was investigated in order to evaluate the robustness of the standard testing conditions. For both tests, ductile fractures appeared in the seam welds location, but the bulge test was more robust and conservative with respect to the wedge test, showing less scattered data. Thus, the performances of a second die for the tube profile, designed to optimize the seam welds quality, have been successfully assessed by the bulge test and results compared to those achieved by a novel numerical quality index, coming to a final good matching.
Trans. Nonferrous Met. Soc. China 30(2020) 619-634
B. REGGIANI1, L. DONATI2
1. DISMI-Department of Sciences and Methods for Engineering, University of Modena and Reggio Emilia, Via Amendola 2, 42122 Reggio Emilia, Italy;
2. DIN-Department of Industrial Engineering, University of Bologna, Viale Risorgimento 2, 40136 Bologna, Italy
Received 3 May 2019; accepted 4 December 2019
Abstract: The wedge and bulge expansion tests were compared in the assessment of the seam welds strength in a tubular profile extruded at two ram speeds. In the wedge test, the expansion was determined by moving a conical punch into the tube until the specimen fracture. In the bulge test, a hydrostatic tensile stress state was applied by expanding the specimen with an internal rubber plug. The two methodologies were compared in terms of load and hoop strain at fracture and by detecting the fracture morphology and location. Then, the effect of a number of design parameters was investigated in order to evaluate the robustness of the standard testing conditions. For both tests, ductile fractures appeared in the seam welds location, but the bulge test was more robust and conservative with respect to the wedge test, showing less scattered data. Thus, the performances of a second die for the tube profile, designed to optimize the seam welds quality, have been successfully assessed by the bulge test and results compared to those achieved by a novel numerical quality index, coming to a final good matching.
Key words: expansion test; seam welds; extrusion; aluminum; bulge test; wedge test
1 Introduction
Aluminum hollow sections cover an extended range of industrial applications (automotive, transports, building, solar, etc) and are usually manufactured by means of the hot extrusion process that responds to the emerging needs of productivity and quality. In order to manufacture a hollow profile, two different tools are required, the die and the mandrel respectively used to generate the outer and the internal shape of the profile. The mandrel is physically supported along the extrusion direction by a certain number of legs that force the billet material to split in a number of streams equal to that of portholes in the die and then to re-join in order to produce a continuous welded profile. During the re-joining phase, the so-called seam or longitudinal welds are generated and become part of the final product developing along the entire length, consequently potentially affecting its mechanical behaviour and performances, especially critical for structural applications [1-3]. Failure of a seam weld can happen at various stages of production chain (bending, stretching, machining, assembly) or even in service [2]. In particular, failure in post-extrusion high-deformation processes such as forming and hydro-forming represents a great limit to the application of direct-extruded products in the market.
Other types of extrusion defects can contaminate the extrudate such as the so called ��back-end�� defect and the charge welds. However, these two defects could be avoided in the final profile, if required, by means of a proper prediction of their onset and extension [4,5]. As charge welds and back-ends, seam weld represents an intrinsic defect of the extrusion process, even if affecting merely hollow profiles, but, opposite to the other defects, seam welds cannot be avoided and need to be accurately characterized before the final sale and delivery of the profile.
To date, in the industrial context, the discrimination between bad and good seam welds quality is still mainly based on qualitative rather than quantitative analyses. Usually, conical and conical�Ccylindrical expansion tests (wedge tests) are implemented and then the fracture morphology of the tested specimens was analysed by means of a simple visual inspection. As example, Fig. 1 shows three fracture morphologies as obtained by a wedge test for an AA7003 tubular profile. Figures 1(a, d) show what is considered a bad seam weld due to the small fracture strain and the 90�� of the fracture surface propagation with respect to the transverse section of the tube. A sound seam weld is shown in Figs. 1(b, e) proved by the high fracture strain (enlarged profile end) and a 45�� (ductile) fracture propagation. However, as for the former case, the fracture has run along the weld up to the end of the sample so that the seam weld seems to be still the weakest point of the profile. Figures 1(c, f) are something in between the two extreme cases with a medium fracture strain and a 45�� fracture line. In this case, fracture propagated deviating from the weld suggesting the same weld strength of the bulk material.
Even if this procedure allows making some preliminary considerations on the process effectiveness, it clearly presents the weaknesses of depending on the operator skills and to not allow for a clear demarcation between good and bad welds. In addition, it is difficult to transport this methodology to non-circular profiles since the wedge shape affects the insurgence of fractures. Thus, a quantitative analysis emerges to be not only a standard prescription but it furthermore would allow to more easily discriminate between good and bad seams and to directly correlate experimental data with the effect of process and the die parameters, thus serving as a guideline at the process and die design stage.
Literatures offer different examples of quantitatively experimental methodologies for the seam welds characterization such as tensile tests [6-14] and fatigue tests [13,15]. However, for the former, the resulting strength properties were found to be a not significant quantitative reference for the assessment of the seam welds integrity, with poor welds potentially showing full strength [12,13]. For the latter, standard fatigue techniques were strongly influenced by the specimen orientation with respect to the extrusion direction and by the investigated material and less affected by the presence or absence of the seam welds [13,15]. A further criticism is related to the fact that not all the hollow profiles shapes allow the extraction of specimens for standard tensile or fatigue tests.
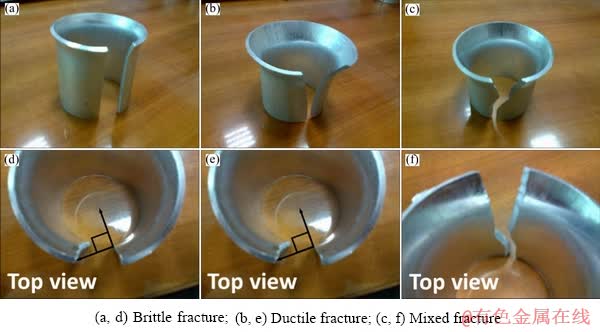
Fig. 1 Examples of fracture morphologies at seam weld location (courtesy of Hydro extrusion)
Out of the standard tensile and fatigue tests, GAGLIARDI et al [16] proposed, as an alternative indicator for the seam weld quality, the optical acquisition of the width, achieving reasonable correlations with die leg dimensions, extrusion speed and ratio. ENGELHARDT et al [17] proposed a non-destructive methodology for the seam and charge welds characterisation in aluminum and magnesium profiles by evaluating the welds influence on the electrical conductivity of flat profiles measured with a tactile eddy current sensor. Different results have been achieved depending on the investigated alloy, thus suggesting the need for further investigation.
In addition to the cited expansion test that makes use of a conical punch (wedge test) [18-20] and that is currently commonly industrially adopted, a possible alternative to characterize the seam welds is offered by the bulge test which is based on a working principle similar to that of the wedge test. In the bulge, an internal pressure is applied within the hollow portion of the profile generating a hydrostatic tensile state. Pressure can be exerted by a fluid, as in the hydroforming bulge test [21], or by a rubber plug involving a simplified experimental setting [22,23].
The wedge and the bulge expansion tests thus emerge to be potential good solutions for the quantitative evaluation of the seam weld strength, the former at least since representing the actual standard in industrial applications. Even if formerly investigated, no previous studies reported a direct comparison of the two methodologies on the same case study. Aim of the present work was therefore to compare the achieved results for a tubular hollow profile industrially extruded at two levels of ram speed. In detail, the two testing methodologies were initially compared in the standard operating conditions suggested by the extruder in terms of load and hoop strain at fracture and by detecting the fracture morphology and location.
As a further step of the work, a number of design parameters were investigated in order to evaluate and compare the robustness of the reference conditions. Specifically, for the wedge expansion test, the effects of lubricant, specimen length, punch speed, load axis and cone angle were evaluated. For the bulge test, the level of rubber plug wear and variations of the punch speed, rubber plug and specimen length, as well as the presence/lack of lubricant, were investigated as potential design test parameters affecting the output results. The overall purpose of the work was the assessment of the effect of the testing methodologies in order to define a standard and stable experimental condition for the seam weld characterization. As last step of the work, the performances of a second die for the tube profile manufacturing, specifically designed to optimize the seam welds quality, have been also assessed and the results compared to those achieved by a novel numerical quality index developed by the authors.
2 Experimental
2.1 Case study
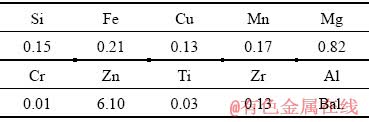
A porthole die having a three-leg mandrel spaced of 120�� was used to generate, at the Hydro Extrusion plant, a round tube profile that was then marked by three seam welds all along the length. The tube profile was made of AA7003 alloy, whose chemical composition is listed in Table 1.
Table 1 Chemical composition of aluminum alloy AA7003 (wt.%)
The profile thickness was 6 mm with an external diameter of 60 mm. The bearing length was 6.5 mm at the mandrel side and 6 mm at the die side. The extrusion ratio was 62.3 and the initial temperature of die was imposed at 400 ��C. The billet was non-homogeneously pre-heated to get an axial temperature gradient ranging between 520 ��C at the billet-end contacting with the die and 490 ��C at the end contacting with the ram. The experimental campaign involving the selected profile was performed in the industrial environment of Hydro plant and consisted in the extrusion of 16 consecutive billets at different ram speeds ranging from 1.8 to 3.66 mm/s. Figure 2(a) shows the die design while in Fig. 2(b) three seam welds locations are marked on a transverse section of the profile. Figure 2(c) indicates a microstructural analysis in polarized light that clearly shows the coarser grains in the welding zones.

Fig. 2 Die design (a), seam welds locations (b) and microstructural analysis of welding zones (c) (black arrows indicate the seam weld line)
Among the extruded billets, eight of them were selected for the specimen extraction scattered all over the production time. In detail, five representative sections from the head (E) to the tail (D) of the extruded profile were analyzed, as reported in Table 2. Sections E and D were selected far from the profile length potentially contaminated by transitory effects as charge welds and billet skin. However, according to the common labelling at industrial level, section E was marked as belonging to the previous billet, accounting for the possibility of a replacement zone extension. Before cutting the specimen, a line was drown longitudinally on the tube in order to retrieve orientation, and therefore fracture location, among different specimens of each batch.
For each condition, five repetitions were carried out for both the wedge and the bulge expansion tests. Both tests, described in detail in the following, were carried out till specimen fracture acquiring the load-stroke curves. Results and repeatability were analyzed in terms of fracture loads, fracture location and fracture morphology and in terms of hoop strain at fracture.
Table 2 Position, labeling and production ram speed of selected profile sections used for expansion tests (n.e.= not examined)

2.2 Wedge expansion test
The working principle of the wedge expansion test is sketched in Fig. 3(a).
The wedge was cone-shaped for the length affected by the test with a standard angle of 42�� and was fixed to the movable upper plate of the press. The cone was made of steel and a portion was manufactured with a radius less than that of the tube in order to guide the die pressing. Expansion tests were performed on a Metrocom-600kN testing machine under quasi-static conditions. The cross-head of the testing machine pressed the cone-shaped wedge into the tube at a constant speed of 0.5 mm/s. The average tubular specimen length was 168 mm with a maximum value of 170 mm and a total of 23 repetitions (expansions) were performed, 18 of which with specimens extracted from bars extruded at low speed (1.9 mm/s) and 5 at high speed (3.66 mm/s). Figure 4(a) shows the typical load-stroke history of the wedge test. It can be observed the first zone, for the punch stroke between 0 and 5 mm, in which the load increases rapidly with an almost linear trend suggesting an elastic material deformation. In the second zone, between 5 and 10 mm of the punch stroke, there is a load oscillation due to the yielding of the material. In the third zone, for a punch stroke exceeding 10 mm, the load continues to rise until the breaking point is reached. The final abrupt load decreasing was imposed as stop condition of the expansion test and used to evaluate its accuracy and robustness. The second parameter selected to compare and judge the wedge and bulge tests was the hoop strain at fracture computed as the natural logarithmic ratio between the final and the initial tube circumferences, both manually acquired as sketched in Fig. 4(b).
The aforementioned wedge testing conditions represented the standard adopted by the Hydro Extrusion company to check the seam welds quality. However, in order to evaluate the effect of the setting parameters on the test outcomes, additional specimens were prepared and the influences of the lubricant, specimen length, load axis, punch speed and cone angle were investigated. In detail, for the first parameter, two conditions were tested, with and without lubricant. Then, results achieved with the reference series of 170 mm in length were compared to those obtained by three series of specimens with 140, 215, 267 mm in length, each series consisting of five repetitions. In addition, a series of specimen was tested with the tube axis markedly tilted of 5�� with respect to the machine (Fig. 4(c)). Concerning the last two parameters, further tests were carried out at 0.2 and 1 mm/s of punch speed, thus remaining in the regime of quasi-static loading conditions, and with non-standard cone angles of 10��, 20�� and 30��. All the specimens used for the analysis were extracted from the bar extruded at low speed.

Fig. 3 Sketch (a) and experimental setup (b) for wedge test, and conical punch (c)

Fig. 4 Typical load-stroke history of wedge test (a), hoop strain at fracture measurement (b) and tilted specimen setting (c)
2.3 Bulge test

Fig. 5 Sketch (a) and experimental setup (b) of bulge test, and tools set (c)
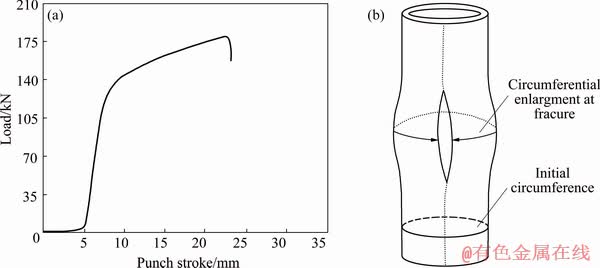
Fig. 6 Typical load-stroke history of bulge test (a) and hoop strain at fracture measurement (b)
Testing tools and methodology are reported in Fig. 5. Tests were carried out on the same press used for the wedge expansion test. A rubber plug of 45 mm in diameter was compressed within two punches inside the tube with a constant ram speed of 0.5 mm/s till the tensile state induced by rubber pressure on the inside wall of the tube generated fracture. The two punches were only constrained in the longitudinal displacement and the movement was given by the lower one (Figs. 5(a, b)). A specimen length taken as standard was properly selected in order to avoid any influence of two potential sources of disturbance. First, with the aim to guarantee no influence of the centering rims on both tube��s extremities, these were set to be longer than the diameter of the tube thus presenting an un-deformed length after an expected transient section. Second, a uniform deformation in the rubber plug and the absence of any buckling were ensured by selecting a useful length of about two times the diameter of the tube. Based on these requirements, the rubber plug initial length, the centering rims and the specimen length were set to be 100, 50 and 200 mm, respectively. The inner surface of tube specimens was oil lubricated before testing in order to guarantee an adequate friction reduction between punches or rubber and the specimens, which could otherwise generate tensions on the tube different from the sole hydrostatic solicitation. As for the wedge test, 23 repetitions in the reference conditions have been carried out (18 with specimens extracted from bars extruded at low speed (1.9 mm/s) and 5 at high speed (3.66 mm/s)) and the same output parameters (load and hoop strain at fracture) were used to evaluate the test accuracy and robustness (Fig. 6). For each single repetition, the internal rubber plug was changed. Figure 6(a) shows the typical load-stroke history of a bulge test and, again, three zones can be recognized. For a lower punch stroke between 0 and 5 mm, the load linearly increased with a slope corresponding to the elastic response of the rubber plug. In the second zone, the greater linear slope was related to the elastic deformation of the tube, while in the third zone, a further slope change occurred due to the tube material plastic deformation. Here, the load continued to increase until the test was interrupted once attained the peak load, after which a rapid decreasing occurred.
The effect of the rubber plug��s wear was investigated in order to exclude the influence of a potential variation in its elastic modulus on the test results. For this, 10 specimens were sequentially extracted from the same bar and tested without replacing the rubber plug. Then, in further three series, the specimen, the centering rim and the rubber length were varied. In the first series, the specimen length was kept at 200 mm while that of the rubber plug was set to be 70, 100 and 150 mm. For the 150 mm condition, a ring of 25 mm in height was used in order to have the same upper and lower centering rim extension (25 mm) (Fig. 7(a)). For the same reason, a 15 mm-height stopper was used for the tests with the rubber plug length of 70 mm (Fig. 7(b)). In the second series, the rubber plug length was fixed at 100 mm while the specimen was varied from 200 to 270 mm, thus also varying the centering rim from 50 to 85 mm (Fig. 7(c)). In the last series, what has been fixed was the centering rim length at the standard length of 50 mm while the specimen length was increased from 140 to 180, 200 mm (standard condition), 230 and 270 mm. Each series consisted of five repetitions. As for the wedge test, all the specimens used for the analysis were extracted from the bar extruded at low speed.
In addition, the punch speed was varied at the same levels used for the wedge test (0.2, 0.5 and 1 mm/s) and the lack of lubrication at the rubber- specimen interface was also evaluated.
3 Results and discussion
Figure 8 shows examples of the typical fracture morphologies for the wedge (Fig. 8(a)) and the bulge (Figs. 8(b, c)) tests. The same failure mode and appearance were detected for all the tested specimens with a ductile fracture that propagated at 45�� with respect to the profile surface without a marked necking. Fracture appeared, in each case, at the same circumferential location or at 120�� from this, thus confirming the seam weld characterization. Specimens extracted from profile portions nearby the profile head (labelled E in Table 2) showed two fracture surfaces at 45�� one each other but marked by an opposite orientation (Fig. 8(c)). This was reasonably related to the presence of a charge weld interacting with a seam weld, the discontinuity surface being that of the old-new billets welding.
3.1 Comparison of wedge and bulge expansion tests
The results for the two testing methods in standard conditions in a load-hoop strain at fracture graph were compared (Fig. 9(a)). None of the other conditions used for the analyses to the testing parameters has been included in this comparison that reports data of specimens of the same length and tested with the same load axis, lubricant condition, punch speed and rubber wear. As previously indicated, 23 test repetitions were performed, 18 with specimens extracted from bars extruded at a low speed of 1.9 mm/s and 5 at a high speed of 3.66 mm/s.
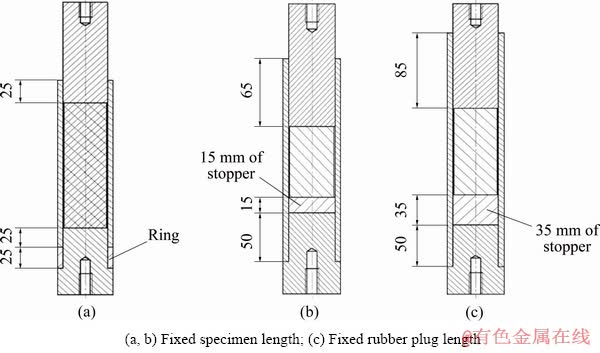
Fig. 7 Experimental settings for bulge test (Unit: mm)
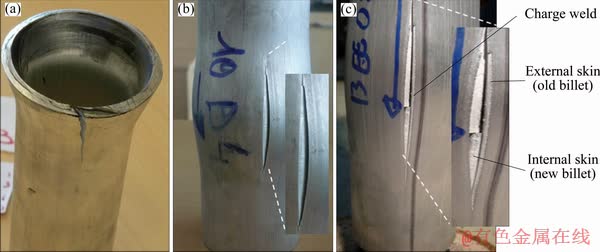
Fig. 8 Fracture morphologies of wedge (a) and bulge (b) tests and charge weld evidence in specimen expanded by bulge test (c)
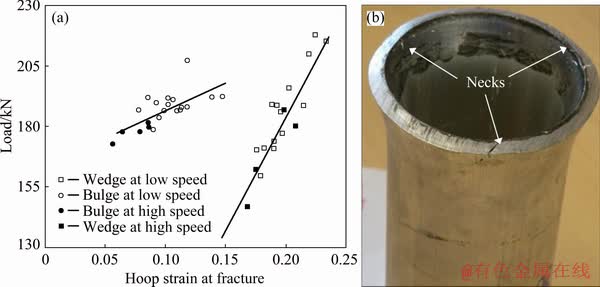
Fig. 9 Load-hoop strain at fracture of specimens extruded at two ram speeds and tested with bulge and wedge tests (a), and evidence of necks at profile transversal section extruded at high velocity expanded by wedge test (b)
The bulge test predicted an average load of (188.4��6.3) kN on the 18 repetitions at low extrusion speed and an average hoop strain at fracture of 0.11��0.02. The corresponding average values predicted in the same conditions by the wedge test were (186.7��18.1) kN and 0.20��0.02. Thus, both tests showed a certain amount of data scattering and a linear load-hoop strain at fracture correlation. However, if the scattering in terms of hoop strain at fracture was of the same order for the wedge and bulge tests ranging from 0.08 to 0.15 for the former and from 0.18 to 0.23 for the latter (minimum to maximum values), an important difference emerged in terms of load data. Indeed, the load of the wedge test spanned from 160 to 218 kN while the total drop for the bulge was less than 14 kN, except for a single point. In addition, the bulge test clearly highlighted a marked lower resistance of the seam welds for the specimen extracted from bars extruded at a high ram speed (black dots in Fig. 9(a)) than those extracted from bars extruded at low ram speed (white dots in Fig. 9(a)). The average load and hoop strain at fracture predicted by the wedge for the specimen extruded at high speed (3.66 mm/s) were (169.1��18.1) kN and 0.19��0.02, respectively, while those of the bulge were (177.4��3.6) kN and 0.07��0.01 respectively. The lower achieved seam weld resistance at higher ram speed can be explained as follows. A beneficial effect was expected with the rising of the extrusion speed related to the corresponding increment of the material temperature [18]. Nevertheless, two negative effects balanced this favorable outcome. Firstly, an increase in the ram speed involved a reduced exposure time of the material to the welding pressure and thus a reduced contact interval between the two welding flows. Then, a higher extrusion speed also resulted in an increased velocity spread in the welding zones over the die legs with the main drawback of reducing the resistance section of the profile by generating three necks in correspondence of the seam welds, as experimentally observed in Fig. 9(b). Thus, it can be reasonably supposed that the reduced resistance section and welding time, caused by an increased ram speed, led to lower mechanical properties of the seam welds, which is in agreement with Ref. [24]. The same result was achieved with the wedge test, even if data were less comprehensible due to their greater dispersion. Lastly, the bulge test predicted lower hoop strain at fracture, thus resulting to be more conservative than the wedge test.
3.2 Effect of testing parameters for wedge expansion test
In the following, the main outcomes of the analysis on the effect of the testing parameters are presented for the wedge test. Figure 10 shows the effect of the lubrication on the load and hoop strain at fracture.
It can be deduced a 30% of load increase in unlubricated condition if compared to the standard lubricated one due to the strong adhesion and a reasonable local damage at tube-cone interface. On the contrary, the same value of the hoop strain at fracture, 0.2, was detected for the two conditions in relation to the unchanged quote of work dissipated for plastic bending/stretching. As a result, a lower general data scattering was recorded both in terms of load and hoop strain at fracture for the unlubricated condition.
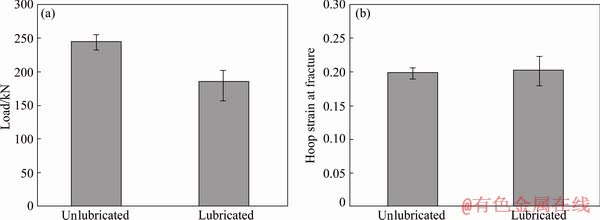
Fig. 10 Effect of lubricant on load (a) and hoop strain at fracture (b) for wedge test

Fig. 11 Effect of specimen length on load (a) and hoop strain at fracture (b) for wedge test (Reference specimen length: 170 mm)
The effect of the specimen length is shown in Fig. 11. Four series were compared: 140, 170 (reference series), 215 and 267 mm. Clearly, a negative correlation between the specimen lengths and both the load and hoop strain at fracture can be observed: with increase of the specimen length, the mechanical characteristics dropped with a proportional amount between load and hoop strain. However, if a significant drop of load and hoop strain was detected from 140 to 170 mm of specimen length, the discrepancy progressively decreased with increase of the length. This was reasonably attributed to the occurrence of some form of instability with the increase of the specimen length that exasperated the local stress and strain state leading to a steady-state damaging from around 200 mm. The scattering on the five repetitions was of the same order for the different tested lengths.
The response of the test to the speed of the conical punch was also evaluated (Fig. 12). The results show that both load and hoop strain at fracture are not influenced by the speed, at least in the investigated range. This is in agreement with the experimental observation that, at room temperature and in quasi-static loading conditions, the material has a negligible dependency on the strain rate.
Figure 13 shows the analysis of the wedge expansion test to the load axis misorientation. There was not a significant variation in terms of load and hoop strain at fracture between the reference and tilted series (5�� of tilting), meaning that the local damage conditions were not affected by a potential specimen misorientation.
The effect of the cone angle was evaluated and three different angles were compared to the standard condition of 42�� (Fig. 14). It can be appreciated an almost inverse linear effect of the cone angle on both the load and hoop strain at fracture. This was explained by an increased stress concentration effect induced in the tube fibres by a higher cone angle.
3.3 Effect of testing parameters for bulge expansion test

Fig. 12 Effect of conical punch speed on load (a) and hoop strain at fracture (b) for wedge test
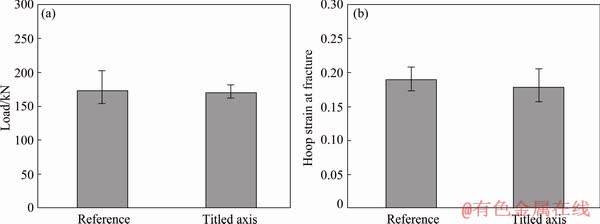
Fig. 13 Effect of axis misorientation (5��) on load (a) and hoop strain at fracture (b) for wedge test

Fig. 14 Effect of cone angle on load (a) and hoop strain at fracture (b) for wedge test

Fig. 15 Effect of rubber plug wear for 10 repetitions (a, a��), lubrication (b, b��) and ram speed (c, c��) on load (a, b, c) and hoop strain at fracture (a��, b��, c��)for bulge test
Figures 15(a, a��) show the influence of the rubber plug wear on the bulge test outputs with the x-axis reporting the 10 sequential tested specimens. The origin of the load data has been set to be 150 kN instead of 0 in order to amplify the eventual influence of the investigated parameter. However, it demonstrates the lack of any effect of the rubber wear both on load and on hoop strain highlighted by any detectable trend. Concerning the effect of the lubricant conditions, Figs. 15(b, b��) clearly show a lack of influence of this parameter on the output results. This can be reasonably motivated by the fact that, during the test, almost no relative displacement occurs at the rubber plug-specimen interface. Concerning the punch speed, the same expected result from the wedge test was also gained for the bulge test with any evident effect, once again attributed to the testing room temperature that excludes for a strain rate influence (Fig. 15(c, c��)).

Fig. 16 Effect of specimen length, rubber plug length and centering rim length on load (a, b, c) and hoop strain at fracture (a��, b��, c��) for bulge test at fixed specimen length of 200 mm (a, a��), rubber length of 100 mm (b, b��) and centering rim length of 50 mm (c, c��)
The last investigated parameters for the bulge test were the specimen length, the rubber plug length and the centering rim length. Figure 16 shows the achieved results for the three series of data in which a single parameter was fixed at time. Data were in each case compared to the reference series of standard conditions (200, 100 and 50 mm of specimen, rubber plug and centering rim length respectively). It can be stated that: at the same specimen length (200 mm), as the length of the rubber plug increases, and therefore as the centering rim length decreases, the load and the hoop strain at fracture decrease; at the same rubber plug length (100 mm), with varying the length of the specimen and therefore the centering rim length, the load and the hoop strain at fracture remain constant; at the same centering rim length (50 mm), with the increase of the rubber plug, and therefore the specimen length, the load and the hoop strain decrease.
It can be concluded that both the load and the hoop strain at fracture are not influenced either by the height of the specimen or by the centering rim length, but only by the length of the rubber plug. This can be explained by observing that, when the length of the rubber plug varies, the global length of the deforming fiber changes. With the increase of the deforming length, a greater amount of fibers are subjected to a high stress and strain state thus leading to reduced load and hoop strain at fracture.
As a concluding remark for the analysis on the effect of the testing parameters, on the base of the investigated set, the bulge test was found less sensible to the testing conditions if compared to the wedge test. Indeed, while for the wedge test the specimen length, the lubricant condition as well as the cone angle led to significant load and hoop strain at fracture variations, the bulge test was proved to be unaffected by the lubricant conditions, the rubber plug wear and the specimen length. The only sensible parameter for the bulge test was found to be the rubber plug length. In addition, also the general data scattering was lower for the bulge than for the wedge test thus confirming the greater robustness and reliability, as previously assessed in standard testing conditions. Furthermore, the standard length of the rubber plug (100 mm) returned results (load and hoop strain at fracture) well within the region of an almost steady-state behavior, thus confirming the validity and robustness of the reference selected conditions.
4 Verification of case study
Accounting for the greater bulge test robustness in standard conditions if compared to the wedge test, the former was selected to experimentally evaluate the seam weld quality of an optimized version of the die used to generate the round tube profile. As reported in Ref. [25], the second design was defined according to the best die design rules by modifying a specific set of geometric variables (height of welding chamber and legs, width of ports, die entry angle, degree of undercut on ports and fillet radius on mandrel-legs). Goal of the optimization was double: increase the die lifetime and the seam welds quality. Figures 17(a, b) show two die designs (starting and optimized in the following named as v0 and v1 respectively) while the corresponding variables are detailed in Table 3. The optimized design was experimentally manufactured and tested at the industrial press and at the high speed of 3.66 mm/s, the same high level selected for the starting configuration. It resulted in the production of a free-defect profile and to an extended die lifetime if compared to the v0 solution. Indeed, while the starting design (v0) showed marked propagated cracks at the mandrel-legs location after 64 extruded billets (Fig. 17(c)), the v1 configuration, even if small cracks were detected by means of penetrant liquids after only a few cycles, it properly worked without any additional propagation for more than 190 billets (Fig. 17(d)). Concerning the profile quality, the round tube profile manufactured with the v1 configuration was found internally smoother and free of pick-up defects if compared to that produced with the v1 design (Figs. 17(e, f)). Due to the well-consolidated use of finite element analyses in the extrusion framework [25-31], the two configurations were also numerically simulated by means of the COMSOL Multiphysics code and the following global seam weld quality index used:
 (1)
(1)
with Pi representing the nodal contact pressure, si the effective nodal stress, vi the nodal velocity magnitude along the welding path, vmax the peak velocity magnitude in the welding chamber and A the welding chamber area. Details of the numerical campaign can be found in Ref. [25]. The performed simulations returned a quality index of 0.36 for the v0 configuration and of 0.58 for v1 thus suggesting an increase of 61% in the seam welds quality.
From the tube profile extruded at high speed (3.66 mm/s) with the v1 configuration, 5 specimens were extracted and examined with the bulge test. They resulted in a value of the load at fracture of (182��4.1) kN and a hoop strain at fracture of 0.12��0.011. If these values are compared with the performances of the v0 configuration previously reported for the profile extruded at the same high speed (Fig. 18), it clearly experimentally displays the higher seam weld quality of the second design (v1), marked by an higher level of strain at fracture [1,13]. In addition, the experimental ratio between the strain at fracture of the v1 and v0 configurations (1.71) resulted in a good agreement with that numerically predicted (1.61), thus also suggesting a reliable predictability of the proposed index.
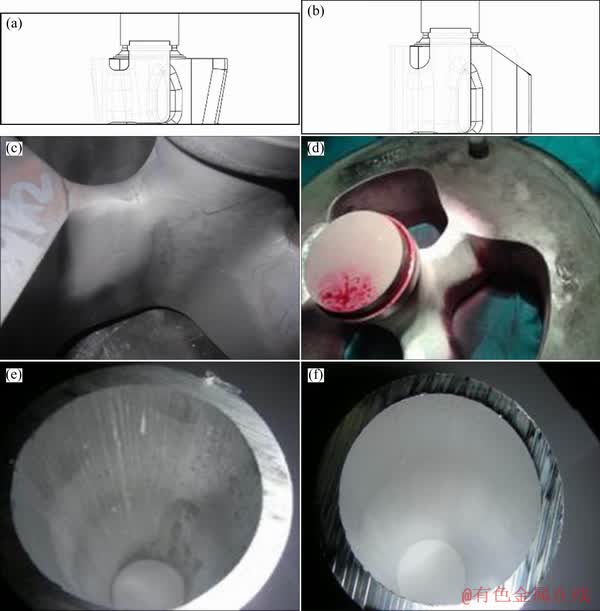
Fig. 17 Comparison of experimental tested configurations v1 and v0 used to produce round profile in terms of design (a, b), crack appearance at mandrel-legs position (c, d) and internal profile quality (e, f)
Table 3 Geometric input variables for v0 and v1 configurations
5 Conclusions
(1) The wedge and the bulge tests always showed ductile fractures in the seam welds location thus confirming their characterization.
(2) Both the wedge and the bulge tests pointed out a decreased strength of the seam welds with the raising of the ram speed. However, the bulge test was found more robust and conservative with respect to the wedge test and more sensitive to the effect of the ram speed.
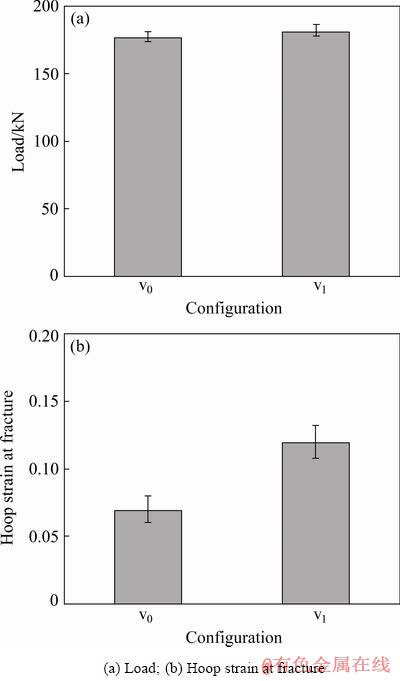
Fig. 18 Comparison of experimental tested configura- tions v1 and v0 used to produce round profile
(3) The load and hoop strain at fracture of the wedge test were found significantly affected by the specimen length, the lubricant condition and the cone angle while for the bulge test only the rubber plug length markedly influenced the outputs.
(4) The overall general scattering of the output data was less pronounced for the bulge than for the wedge test, confirming the achieved results in standard conditions.
(5) The bulge test, applied to the second die, clearly proved the higher seam weld quality of the optimized design showing a higher hoop strain at fracture than the initial one. The load was not considered accounting for its less sensitivity to the weld quality evaluation.
(6) The experimental ratio between the strain at fracture of the optimized and the initial die configurations resulted in good agreement with that numerically predicted by a novel index for the seam weld quality assessment.
References
[1] AKERET R. Extrusion welds-quality aspects are now center stage [C]//Proc 5th Extrusion Technology Seminar (ET�� 92), Chicago (IL), USA: AEC, 1992: 319-336.
[2] LI Shi-kang, LI Luo-xing, HE Hong, LIU Zhi-wen, ZHANG Long. Influence of dynamic recrystallization on microstructure and mechanical properties of welding zone in Al-Mg-Si aluminum profile during porthole die extrusion [J]. Transaction of Nonferrous Metals Society of China, 2019, 29: 1803-1815.
[3] SAHA P K. Quality issues of hollow extrusions for aerospace applications [C]//Proc 9th Extrusion Technology Seminar (ET�� 08), Orlando, USA: ET, 2008.
[4] REGGIANI B, DONATI L. Experimental, numerical, and analytical investigations on the charge weld evolution in extruded profiles [J]. International Journal of Advanced Manufacturing Technology, 2018, 99(5-8): 379-1387.
[5] KIM Y T, IKEDA K K. Flow behaviour of the billet surface layer in porthole die extrusion of aluminium [J]. Metallurgical and Materials Transactions A, 2000, 31(6): 1635-1643.
[6] den BAKKER A J, WERKHOVEN R J, SILLEKENS W H, KATERMAN L. The origin of weld seam defects related to metal flow in the hot extrusion of aluminium alloys EN AW-6060 and EN AW-6082 [J]. Journal of Material Processing Technology, 2014, 14(11): 2349-2358.
[7] YU Jun-quan, ZHAO Guo-qun, CHEN Liang. Analysis of longitudinal weld seam defects and investigation of solid state bonding criteria in porthole die extrusion process of aluminium alloy profiles [J]. Journal of Material Processing Technology, 2016, 237: 31-47.
[8] YU Jun-quan, ZHAO Guo-qun, CHEN Liang. Investigation of interface evolution, microstructure and mechanical properties of solid state bonding seams in hot extrusion process of aluminium alloys profiles [J]. Journal of Material Processing Technology, 2016, 230: 153-166.
[9] BAI Sheng-wen, FANG Gang, ZHOU Jie. Analysis of the bonding strength and microstructure of AA6082 extrusion weld seams formed during physical simulation [J]. Journal of Material Processing Technology, 2017, 250: 109-120.
[10] LOUKUS A R, SUBHASH G, IMANINEJAD M. Mechanical properties and microstructural characterization of extrusion welds in AA6082-T4 [J]. Journal of Material Science, 2004, 39: 6561-6569.
[11] ZHANG Xin-ming, FENG Di, SHI Xing-kuan, LIU Sheng-dan. Oxide distribution and microstructure in welding zones from porthole die extrusion [J]. Transactions of Nonferrous Metals Society of China, 2013, 23(3): 765-772.
[12] DONATI L, TOMESANI L, MINAK G. Characterization of seam weld quality in AA6082 extruded profiles [J]. Journal of Material Processing Technology, 2007, 191: 127-131.
[13] den BAKKER A J, EDWARDS S, HOEN-VELTEROP L, UBELS R. Static and dynamic mechanical properties of longitudinal weld seam [C]//Proc 9th Extrusion Technology Seminar (ET�� 08), Orlando, USA: ET, 2008.
[14] HSIANG Su-hai, LIAO Chao-shun. Study on hot extrusion of tubes [J]. Journal of Material Processing Technology, 1997, 63: 254-259.
[15] NANNINGA N E, WHITE C, MILLS O P, LUKOWSKI J T. Effect of specimen orientation and extrusion welds on the fatigue life of an AA6063 alloy [J]. International Journal of Fatigue, 2010, 32: 238-246.
[16] GAGLIARDI F, CITREA T, AMBROGIO G, FILICE L, MISIOLEK W Z. Relationship between process conditions and seam weld width in extruded shapes through a porthole die with customized geometry [J]. Materials Today Proceedings A, 2015, 2(10): 4874-4881.
[17] ENGELHARDT M, BEHNE D, GRITTNER N, NEUMANN A, REIMCHE W, KLOSE C. Non destructive testing of longitudinal and charge weld seams in extruded aluminium and magnesium profiles [J]. Materials Today Proceedings A, 2015, 2(10): 4866-4873.
[18] JO H, JEONG C S, LEE S K, KIM B M. Determination of welding pressure in the non-steady-state porthole die extrusion of improved Al7003 hollow section tubes [J]. Journal of Material Processing Technology, 2003, 139: 428-33.
[19] YANG Jia-ling, LUO Min, HUA Yun-long, LU Guo-xing. Energy absorption of expansion tubes using a conical-cylindrical die: Experiments and numerical simulation [J]. International Journal of Mechanical Sciences, 2010, 52: 716-725.
[20] DAXNER T, RAMMERSTORFER F G, FISCHER F D. Instability phenomena during the conical expansion of circular cylindrical shells [J]. Computer Methods in Applied Mechanics and Engineering, 2005, 194: 2591-2603.
[21] IMANINEDJAD M, SUBHASH G, LOUKUS A R. Experimental and numerical investigation of free-bulge formation during hydroforming of aluminum extrusions [J]. Journal of Material Processing Technology, 2004, 147: 247-254.
[22] DEN BAKKER A, SILLEKENS W H, WERKHOVEN R J. Experimental study of longitudinal weld seam properties in tubular AA6060 and AA6082 extrusions [C]//Proc 9th Extrusion Technology Seminar (ET�� 08), Orlando, USA: ET, 2008.
[23] SEGATORI A, REGGIANI B, DONATI L, PINTER T, RAMI Y, TOMESANI L. Effect of process parameters on seam weld quality of ZM21 tubes [J]. Key Engineering Materials, 2002, 504-506: 487-492.
[24] LU Xing, ZHANG Cun-sheng, ZHAO Guo-qun, GUAN Yan-jin, CHEN Liang, GAO An-jiang. State-of-the-art of extrusion welding and proposal of a method to evaluate quantitatively welding quality during three-dimensional extrusion process [J]. Materials & Design, 2016, 89(5): 37-748 254.
[25] REGGIANI B, DONATI L, TOMESANI L. Multi-goal optimization of industrial extrusion dies by means of meta-models [J]. International Journal of Advanced Manufacturing Technology, 2017, 88(9-12): 3281-3293.
[26] DONATI L, TOMESANI L. Seam welds modeling and mechanical properties prediction in the extrusion of AA6082 alloy [J]. Key Engineering Materials, 2008, 367: 125-136.
[27] YI Jie, WANG Zen-hu, LIU Zhi-wen, ZHANG Jian-ming, HE Xin. FE analysis of extrusion defect and optimization of metal flow in porthole die for complex hollow aluminium profile [J]. Transactions of Nonferrous Metals Society of China, 2018, 28(10): 2094-2101.
[28] HE You-feng, XIE Shui-sheng, CHENG Lei, HUANG Guo-jie, FU Yao. FEM simulation of aluminum, extrusion process in porthole die with pockets [J]. Transactions of Nonferrous Metals Society of China, 2010, 20(6): 1067-1071.
[29] REGGIANI B, DONATI L, TOMESANI L. Evaluation of process speed effect in aluminium extrusion by experiment and simulations [C]//Proc 139th Annual Meeting and Exhibition. Seattle, WA, USA: TMS, 2010: 65-70.
[30] HE Zhao, WANG He-nan, WANG Meng-jun, LI Guang-yao. Simulation of extrusion process of complicated aluminium profile and die trial [J]. Transactions of Nonferrous Metals Society of China, 2012, 22(7): 1732-1737.
[31] LI Luo-xing, LOU Yan. Ram speed profile design for isothermal extrusion of AZ31 magnesium alloy by using FEM simulation [J]. Transactions of Nonferrous Metals Society of China, 2008, 18(S): s252-s256.
B. REGGIANI1, L. DONATI2
1. DISMI-Department of Sciences and Methods for Engineering, University of Modena and Reggio Emilia, Via Amendola 2, 42122 Reggio Emilia, Italy;
2. DIN-Department of Industrial Engineering, University of Bologna, Viale Risorgimento 2, 40136 Bologna, Italy
ժ Ҫ��Ϊ���������ּ�ѹ�ٶ��µĹ�״�Ͳĵĺ���ǿ�ȣ��Ƚ�Ш�����ͺ������������鷽������Ш�������У�������ͨ�����γ�ͷ�������ֱ������������ȷ���������������У�ͨ�������ڲ�����������ʩ�Ӿ�����Ӧ��״̬��ͨ�����Ͽ���ò�ͶϿ�λ�ã��Ƚ����ַ����ڶϿڴ����غɺͻ���Ӧ�䡣Ϊ�����������������Ŀɿ��ԣ��о�������Ʋ�����Ӱ�졣��������������������У�����λ�þ��������Զ��ѣ����������������Ш�������Ϊ�Ƚ��ͱ��أ����ݷ�ɢ�Խ�С����ˣ�ͨ����������ɹ�����Ϊ�Ż�������������Ƶĵڶ��ֹ�״�Ͳĵ����ܣ����ý����һ���µ���ֵ����ָ������õĽ�����бȽϣ����մﵽ���õ�ƥ�䡣
�ؼ��ʣ��������飻���죻��ѹ�������������飻Ш������
(Edited by Xiang-qun LI)
Corresponding author: Barbara REGGIANI; Tel: +39-0522-522652; E-mail: barbara.reggiani@unimore.it
DOI: 10.1016/S1003-6326(20)65241-4

