J. Cent. South Univ. Technol. (2010) 17: 1395-1402
DOI: 10.1007/s11771-010-0648-4
Control effect of fluid entry pressure on hydrocarbon accumulation
NIE Hai-kuan(聂海宽)1, 2, ZHANG Jin-chuan (张金川)1
1. Key Laboratory for Marine Reservoir Evolution and Hydrocarbon Accumulation Mechanism,
Ministry of Education, China University of Geosciences (Beijing), Beijing 100083, China;
2. Research Institute of Petroleum Exploration and Production,
China Petro-Chetral Corporation (SINOPEC), Beijing 100083, China
? Central South University Press and Springer-Verlag Berlin Heidelberg 2010
Abstract: The micromigration of oil-drive-water and gas-drive-water in oil and gas fields was studied, by using core slices and micro-experimental technology, and the migration processes and characteristics of oil and gas in pores and throats were observed, as well as entry pressures of oil/gas migration. Research shows that entry pressures of both oil-drive-water and gas-drive-water increase obviously as porosity decreases, and the statistical regularity observes the power function variation. However, there is a complex changing relationship between porosity and different entry pressure values of the two replacement processes, forming three curve sections, each representing a different accumulation significance. When the porosity is over 10%-12%, the difference between oil-drive-water and gas-drive-water entry pressures is small. Both oil and gas can migrate and accumulate in this kind of reservoir. The probabilities of oil and gas reservoir formation are nearly equal, forming conventional oil/gas pools. When porosity is between 5% and 10%-12%, the difference between the two is obvious, which indicates that this kind of reservoir can seal oil, but can also be a reservoir for gas, easily forming unconventional hydrocarbon pools (deep-basin gas pools). When porosity is less than 5%, the difference is indistinct and the entry capillary pressures show the same sealing function for oil and gas. In this condition, both oil and gas pools are difficult to form. Experimental results give a rational explanation for the difference of accumulation probability between deep-basin gas and deep-basin oil, and also for the mechanism of tight sand acting as cap rock.
Key words: oil/gas-drive-water; entry pressure; micro-experiment; secondary migration; hydrocarbon accumulation
1 Introduction
Hydrocarbon migration and accumulation are two important aspects of petroleum geology. As known to all, the pores and throats of the reservoir formation are saturated with water before it is charged with oil/gas. The oil/gas accumulation is a process of oil/gas drive and oil/gas displacement. But what are the oil-driven and gas-driven processes? What are the oil-drive-water and gas-drive-water entry pressures, and what are the differences between them? These are all urgent problems to be solved. Solving these problems will help to understand the paths of oil/gas migration and the sites of oil/gas accumulation. Physical experimental simulation is the beginning of development of the theory for the secondary migration of oil/gas [1], and an important means and method in oil/gas migration and accumulation research [2]. As early as 1921, EMMONS [3] used various particle sizes of sandstones to study oil/gas migration, mainly observing and qualitatively depicting oil/gas migration phenomenon. At present, there are many physical models of oil/gas secondary migration and accumulation, which can be easily divided into microscopic and macroscopic models.
Microscopic models include the single-hole model [4-5], the light-etched glass model [6-10] and core slices [11-15]. Through the study of microscopic models, hydrocarbon secondary migration phenomena, such as high-speed migration, replacement-style migration, piston-style migration, and secondary migration mechanisms, including fingering jump mechanisms, jumps, and snap-off mechanisms, can be well observed. However, the former two models of this kind are too simple, and they can only reflect the reservoir’s character to a certain extent, but cannot reflect the actual porosity, permeability and other characteristics. The results of the single-hole model and light-etched glass model, only giving a simple concept of oil/gas migration, are not widely used. The core microscopic model, using core slices, provides the actual porosity and permeability of the reservoir.
Macroscopic models include the pipe model [16-19], the box model [20-27], the real core model [28] and large-scale simulation with high temperature and pressure [29-30]. The pipe model includes the glass-tube model and the steel-tube model; these can be made easily and have been widely used to study oil/gas migration and accumulation. The box model was made by pouring glass beads, sands or other materials (broken glass shavings, cone cryolite, fluorite grains, quartz grains, etc.) into two flat panels, as a sandwich-style single-layer close- packing model. This model is always filled with sands of different granularities, which are called sand-body models. These can allow one to observe the process directly and the pathway of hydrocarbon migration and accumulation. However, these models are too simple, because they are different from actual core and can only be used to depict phenomena and study oil/gas migration and accumulation qualitatively, and cannot produce substantive and quantitative research. The sandstone-core model overcomes the defects of the pipe model and box model, and can reflect the actual porosity, permeability, and other characters of the reservoir. Recently, large-scale physical simulation has been tried to study the oil/gas migration and accumulation in high temperature and high pressure conditions.
Although oil/gas migration and accumulation are on large-scale, the migration actually occurs in microscale, mainly at the level of porosity. It is necessary to use the core in microscale to study oil/gas migration. The choice and fabrication process of experimental model are the critical parts of the physical experiment. Based on other physical experimental models, we used the core slice, which has strongly three-dimensional visibility, good fidelity, and low cost, and objectively reflects the natural properties of subsurface sandstone reservoirs and the complexity of porosity and permeability. The model integrates the macroscale and microscale research of oil/gas migration. At present, this model is the closest model of the subsurface sandstone reservoirs. This model will contribute to in-depth understanding of oil/gas migration in sandstone reservoirs. We used a microscope to observe migration process, a pressure gauge to measure entry pressures, and a computer to take pictures. The migration processes and characteristics of oil-drive-water and gas-drive-water in pores and throats were observed, the relationship between oil-drive-water/ gas-drive-water entry pressure and porosity and the relationship of different entry pressures between oil-drive-water and gas-drive-water to porosity were studied, and different migration and accumulation patterns of oil/gas of the same reservoir were analyzed. The micromechanisms of oil/gas migration were also discussed.
2 Experimental principle, design and process
2.1 Principle
Oil/gas migration and accumulation are processes of oil/gas drive and oil/gas displacement. Some cases(oil displaces gas-water phase state or gas displaces oil-water phase state) are three-phase-system displacements, which are quite complicated. This experiment only considers the simple instance, namely the two-phase system displacement (oil-drive-water and gas-drive-water) in the hydrostatic condition. Different types of reservoir have different reservoir characteristics, such as porosity, permeability, which largely determine the basic method and style of hydrocarbon migration and accumulation.
Nonwetting-phase fluid must overcome the capillary pressure to enter the reservoir [31]. The porosity has a direct proportionate relation to the throat radius. According to the capillary pressure formula (formulas (1)-(2)), in a certain rock-fluid system, the entry pressure is inversely proportionate to the throat radius. The oil/gas can easily enter the reservoir which has larger throat radius (larger porosity). Conversely, the smaller the throat radius (smaller porosity), the larger the oil/gas-drive-water entry pressure.
 (1)
(1)
 (2)
(2)
where Pc is the capillary entry pressure; σ is the surface tension; θ is the wetting angle; r is the throat radius; and Φ is the porosity.
2.2 Installation
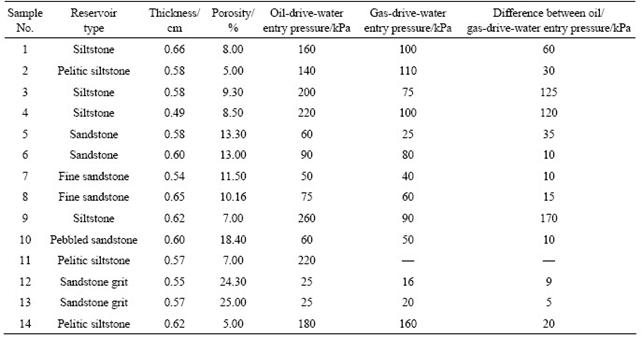
The core slices were made by QU et al [32] (Fig.1). The length, width, and thickness of the core slices are respectively 2, 2, and 0.49-0.66 cm (Table 1). The model can not only be applied to the microscale and three- dimensional study of oil/gas migration, but also be applied to large-scale study, that is, under core-scale, to depict oil/gas migration phenomena. Therefore, it can be considered as a combination of both microscopic and macroscopic models. The highest pressure of this model can reach 0.3 MPa. The 14 cores that the core slices made from were selected from the Western Depression, Liaohe Basin. For getting ideal observation results, these samples were selected from the oil-bearing strata but without hydrocarbon, so as to simulate the original reservoir conditions before charging with hydrocarbons (originally water-wet before hydrocarbon charging). The oil, gas, and water in this experiment were represented by kerosene (1.84 mPa?s in viscosity and 0.85 g/cm3 in density, 20 ℃), nitrogen, and distilled water(1 mPa?s in viscosity and 1 g/cm3 in density, 4 ℃). Blue ink was added to the water to distinguish water and gas during the experiment.
The experimental equipment includes core slices, oil, microscope, nitrogen cylinder, valve, pipe, pressure gauge, computer, micro-calipers, etc. The experimental design connected the nitrogen cylinder, pressure gauge, and core slice by the pipe (Fig.1). The nitrogen was the drive force of hydrocarbon migration, serving as the buoyancy and expansive force of hydrocarbon generation. We used different pressure gauges to measure the entry pressures, different multiple microscope to observe the hydrocarbon migration processes, and a computer which was connected with the microscope to take pictures.
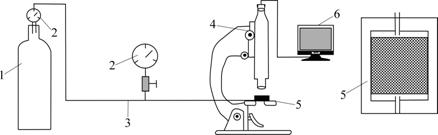
Fig.1 Experimental installation of hydrocarbon migration and accumulation micro-processes: 1―Nitrogen cylinder; 2―Pressure gauge; 3―Pipe; 4―Microscope; 5―Core slice; 6―Computer
Table 1 Entry pressure of oil/gas-drive-water experiment
2.3 Process
The whole experiment was carried out under a constant temperature of about 25 ℃. The experiment is a stably increasing pressure process, and the oil/gas migration rate is slow, thus avoiding sandstone pore-structure damage. The experimental steps are as follows.
(1) Vacuuming and water saturation. In order to simulate the original condition of the subsurface reservoir before it is charged with hydrocarbon, the core slices should be saturated with water firstly. Before they are charged with water, the core slices should be vacuumed for more than 2 h until there is no residual air, and then filled with water.
(2) Gas-drive-water charging. Connect the core slice with the experimental installation, adjust the valve of the nitrogen cylinder, and increase pressure slowly, observe whether the gas has migrated into the model using the microscope and note the entry or starting pressure (the pressure when the gas migrates into the model) (Table 1). Observe the whole process of gas-drive-water and gas-displacement water, note the phenomena of the processes and take photos if necessary. In this process, the pressure should increase slowly and steadily, to avoid too rapid gas migration, which can result in sandstone pore structure damage; additionally, the observer may not be able to catch and note the entry pressure. After this process, saturate the slices with water again.
(3) Oil-drive-water charging. Follow the same process as above with kerosene instead of nitrogen for all 14 core slices. The gas-drive-water simulation should come first to reduce the cleaning times and improve the accuracy because oil may remain in the slice.
3 Experimental result analysis
3.1 Observation
The migration processes and characteristics of oil-drive-water and gas-drive-water in pores and throats were observed. Oil/gas always migrates along the pathway where the capillary force is the lowest. As the experiment shows, when porosity is great enough, the oil-drive-water and gas-drive-water migration are by replacement style (Fig.2), and oil/gas migration follows the high-speed pathway. When the porosity is great, the reservoir is conventional, and the capillary pressure is smaller than that of a reservoir with low porosity (nonconventional reservoir). Oil/gas is driven by buoyancy force [5, 31, 33-34]. Migration speed is inhomogeneous and migration pathways are usually dendritic because the reservoir heterogeneity (porous structure or fractures) is unevenly developed. This often leads to the migration of oil/gas through the largest porosity, pore throats and high-permeability regions with the lowest capillary pressure, forming the high-speed migration pathway. The snap-off, fingering jump, and jump phenomena can also be observed. The snap-off is prevalent in water-wet media where the ratio of pore to throat is large and is disadvantageous for gas migration because of increasing migration resistance. It is also observed that a sudden shake can promote gas migration. The migration drive force also affects oil/gas migration speed and pathway.
On the contrary, when porosity is small enough for tight reservoir conditions (relatively small porosity and pore throats and sharply high capillary pressure), it may be quite difficult for oil and gas to enter this reservoir and migration difficulty increases suddenly. The oil and gas migrate into this reservoir but not driven by buoyancy, but in the piston-style (Fig.2); all of the water is displaced by oil and gas, and the summation of upward forces is greater than or equal to those of resistances to movement caused by the tight-reservoir capillary entry pressure [5]. This process occurs mainly in the tight reservoirs close to the source rocks, and is different from the traditional style of buoyancy-driven migration, being instead driven by the expansive force of hydrocarbon generation. The pressure needed is much higher, and must be long-term and sustained. If the pressure is too high, gas migration may occur through high-speed pathways, producing the breakthrough-flow phenomenon. The process also needs a relatively homogeneous reservoir. There may be a fingering phenomenon in local areas, but overall migration is piston-style. The main reason for this phenomenon is the denser capillary pressure in the reservoir. As a result, the deep-basin gas reservoir [35] is formed, where the gas and water are inversed (water is above gas); that is also known as a tight-gas reservoir [36] (in most cases equivalent to basin-centered gas system [37]), or source-contacting gas [38]. Statistics shows that, nearly all of these reservoirs are gas accumulations, and only a few are oil accumulations.
These two kinds of migration styles (replacement and piston, driven by buoyancy and expansion during hydrocarbon generation, respectively) and the changes of oil-drive-water and gas-drive-water entry pressure can be observed clearly in the experiment.
3.2 Relationship between oil/gas-drive-water entry pressure and porosity
For normal entry pressure research, especially core microscopic study, it is difficult to exactly measure the throat radius and correlate it to the capillary entry pressure.
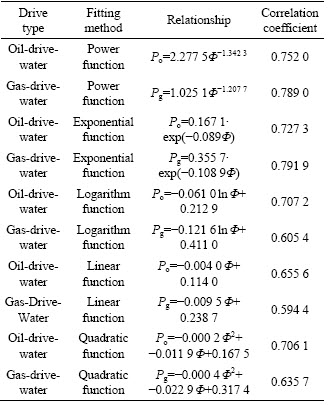
The relationship between entry pressure and porosity of oil-drive-water and gas-drive-water was studied (Table 1). The results show that for both oil and gas the entry pressure obviously rises along with the porosity reduction (Fig.3) and can be described as a power function contrast to other fitting methods (Formulas
(3)-(4) and Table 2). The correlation coefficients (R2) between oil-drive-water entry pressure and porosity and gas-drive-water entry pressure and porosity are respectively 0.752 0 and 0.789 0, which means that oil/gas entry pressure and porosity are related fairly well.
Po=2.277 5Φ-1.342 3 (3)
Pg=1.025 1Φ-1.207 7 (4)
where Po is the oil-drive-water entry pressure, MPa; and Pg is the gas-drive-water entry pressure, MPa.
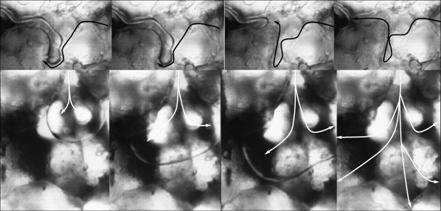
Fig.2 Two kinds of migration: Piston fashion (Upper) and replacement fashion (Lower) of oil-drive-water
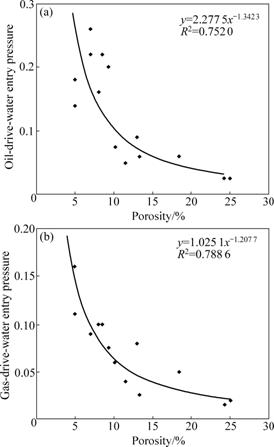
Fig.3 Relationship between oil/gas-drive-water entry pressure and porosity: (a) Oil-drive-water; (b) Gas-drive-water
Table 2 Comparison of fitting connection between oil/gas- drive-water and porosity
3.3 Relationship of different entry pressures between oil-drive-water and gas-drive-water along with changing porosity
Further observation shows that the oil-drive-water entry pressure is usually greater than the gas-drive-water entry pressure in the same core slice. According to the capillary pressure formula, this is primarily because the oil surface tension (σo) is greater than the gas surface tension (σg). At the same time, the wetting angle (θ) also has an effect to some degree. The basic relationship between oil-drive-water entry pressure and gas-drive-water entry pressure can be further studied by evaluating changes with changing porosity.
The oil-drive-water entry pressure minus the gas-drive-water entry pressure of the same core slice is the difference under different porosities (Table 1 and Fig.4). There is a complex changing relationship between entry pressure difference and porosity, forming three curve fragments in Fig.4 that represent different migration and accumulation significances.
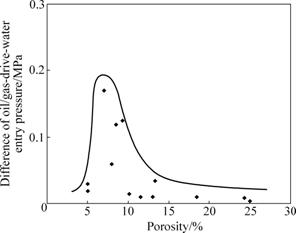
Fig.4 Relationship between difference of entry pressure between oil-drive-water and gas-drive-water along with porosity
(1) When the porosity is over 10%-12%, the reservoir is conventional, and the difference between the entry pressures is small; the biggest difference is 0.035 MPa. The small difference suggests that when porosity is great enough, the reservoir capillary pressure has no different effects on oil or gas migration resistance; oil and gas have nearly the same migration and accumulation probability in this kind of reservoir. If the oil or gas supplies condition and all other key geological conditions are equal, the probabilities of oil and gas reservoir pool formation are nearly equal.
(2) When the porosity is between 5% and 10%- 12%, the difference between oil-drive-water and gas-drive-water entry pressures is greater. The oil entry pressure is obviously larger than gas entry pressure, and the biggest difference is 0.170 MPa. The point at 10%-12% porosity forms an obvious inflection point of the curve, which suggests that it may be more difficult for oil to migrate than gas. Oil may be sealed from this kind of reservoir, but gas may migrate and accumulate in it.
(3) When porosity is less than 5%, the difference between oil-drive-water and gas-drive-water entry pressures is also small, and the biggest difference is 0.030 MPa. The capillary entry pressure shows the same sealing function for oil and gas. Both oil and gas pools will not be formed easily.
3.4 Reservoir classification
The porosity value 10%-12% is considered the boundary between tight reservoirs (unconventional reservoirs) and nontight reservoirs (conventional reservoirs). For example, SPENCER [39] considered 13% porosity as a conventional-gas sandstone cutoff and found that most of tight-gas reservoirs were either blanket or lenticular sandstones, YUAN et al [40] considered 8%-10% porosity as the upper limit of the tight reservoir, DAI and JI [41] suggested that porosity of 5%-10% was a general tight-reservoir threshold value, and ZHANG and JIN [5] integrated the deep-basin gas accumulation characteristics and suggested 9%-12% porosity as the boundary between tight reservoirs and conventional reservoirs.
From the experimental result analysis, we can reach the conclusion that 10%-12% porosity can be the boundary between tight reservoirs and conventional reservoirs. Furthermore, 5% porosity is an important threshold for further division of tight reservoirs. In reservoirs with different porosities and permeabilities, the migration and accumulation of oil and gas should be very different.
4 Discussion
4.1 Deep-basin gas and deep-basin oil
According to the statistical surveys of JIN and ZHANG [42], and ZHANG et al [43], the hydrocarbon- water inversion accumulation (the hydrocarbon is under the water) mainly was a gas-water inversion accumulation forming a deep-basin gas reservoir, but with little deep-basin oil. The experimental results give a rational explanation for different accumulation probabilities of deep-basin gas reservoirs and deep-basin oil reservoirs. When the reservoir is tight, with porosity between 5% and 10%-12%, gas can easily migrate and accumulate in the reservoir, driven by the piston-style expansion force of hydrocarbon generation and displacement water, and the gas-water inversion phenomena occur. It may be very difficult for oil to enter the reservoir, and oil-water inversion phenomena can hardly appear. One should thus be cautious about deep-basin oil reservoirs.
4.2 Tight sand seal
According to a recent report, the seal rock is tight sandstone (not conventional mudstone or gypsum rock) in the Jurassic gas reservoir of the Yingnan 2 well, Tarim Basin, Xinjiang province [44], representing a new type of special mechanism of the cap rock. These phenomena exist widely in the basins of Western China. The experimental results, i.e., different behaviors between oil-drive-water and gas-driven, give a rational explanation of the mechanism of the tight sandstone acting as seal rock. When the porosity is between 5% and 10%-12%, the gas can easily enter and migrate in the reservoir, but oil needs higher expulsive force (may be one time greater than that of gas) to enter the reservoir and oil may accumulate under the sandstone cap. Statistical regularity of the relationship between oil-drive-water entry pressure and porosity (power function variation regularity, formula (3)) can be used to calculate the capillary entry pressure of the tight sandstone. Oil column height can be calculated by capillary entry pressure. The tighter the tight sandstone is, the higher the column of oil it can seal (Fig.5).
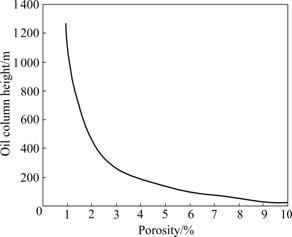
Fig.5 Relationship between tight sand porosity and its seal oil column height
4.3 Conventional and unconventional gas reservoir exploration
When the porosity of reservoir is over 10%-12% and other migration and accumulation conditions are nearly the same, there is almost the same probability for oil and gas to form conventional pools. The operator must consider not only oil pools, but also gas pools. When the porosity is between 5% and 10%-12%, unconventional gas pools may be found (deep-basin gas pools), but oil pools can hardly be found. The oil pools may be found under these tight rocks. When porosity is less than 5%, the oil and gas neither migrate nor accumulate in the tight reservoirs, not to mention the formation of oil and gas pools.
5 Conclusions
(1) The physical experimental simulation is the beginning and foundation of the oil/gas secondary migration research. There are many physical models studying oil/gas secondary migration and accumulation; these can be divided into microscopic models and macroscopic models. The former includes the single-hole model, the light-etched glass model, and core slices, and the later includes the pipe model, the box model, the real core model, and large-scale high-temperature high-pressure simulation. The development trend of physical experimental simulation is from qualitative study to quantitative study, microscopic/macroscopic model to a combination model, study of secondary migration of conventional hydrocarbons to that of unconventional hydrocarbons, study of oil/gas secondary migration in nonmarine clastic reservoirs to that of marine carbonate reservoirs, and study of oil/gas-water two-phase behavior to oil-gas-water three-phase behavior, etc.
(2) Based on a core slice model and an experiment of oil/gas-drive-water that simulates the secondary migration in the sandstone porous media is studied. The core model has strongly three-dimensional visibility, good fidelity, low cost, objectively reflects the natural properties of subsurface sandstone reservoirs, and which reflects the complexity of porosity and permeability more objectively than any other models. Research shows that entry pressures of both oil-drive-water and gas-drive-water obviously increase according to porosity reduction. The relation can be fitted to a power function with good statistical agreement. However, there is a complex changing relationship between porosity and the difference between oil-drive-water and gas-drive-water entry pressures, and three curve fragments with different accumulation significances are formed. When the porosity is over 10%-12%, the difference between the entry pressures is small. Both oil and gas can migrate and accumulate in this kind of reservoir. The probabilities of conventional oil and gas reservoir formation are nearly equal. When the porosity is between 5% and 10%-12%, the difference between the entry pressure is large, which indicates that this kind of reservoir can seal oil, but can be a reservoir for gas and easily form unconventional hydrocarbon pools (deep-basin gas pools). When porosity is less than 5%, the difference in entry pressure is small and the entry capillary pressures show the same sealing function for oil and gas. It is difficult for both oil and gas pools to form. Experimental results give a rational explanation for the difference of accumulation probability between deep-basin gas and deep-basin oil, and also for the mechanism problem of tight sand acting as cap rock.
Acknowledgements
The authors would like to thank the following people for valuable discussion on the physical experiment model of oil/gas migration and accumulation: XU Bo, SONG Xiao-wei, LI Xue-chao, XUE Hui, JUN Pu, LI Jing-han and WANG Zong-yu. LI Xue-chao also helped to do the experiment.
References
[1] JIN Zhi-jun, ZHANG Fa-qiang. Status and major advancements in study of hydrocarbon migration [J]. Oil and Gas Geology, 2005, 26(3): 263-270. (in Chinese)
[2] JIN Zhi-jun, ZHANG Yi-wei, WANG Jie. Hydrocarbon accumulation mechanism and oil/gas distribution [M]. Beijing: Petroleum Industry Press, 2003: 130-185. (in Chinese)
[3] EMMONS W H. Experiments on accumulation of oil in sands [J]. AAPG Bulletin, 1921, 5(1): 103-104.
[4] ROOF J G. Snap-off of oil droplets in water-wet pores [J]. Soc Petroleum Eng, 1970, 10: 85-95.
[5] ZHANG Jin-chuan, JIN Zhi-jun. Accumulation and distribution of deep basin gas [M]. Beijing: Petroleum Industry Press, 2005: 22-127. (in Chinese)
[6] MATTAX C C, KYTE J R. Imbibition oil recovery from fractured, water-drive reservoir [J]. SPE Journal, 1962, 2(6): 177-184.
[7] WEIDNER D E, SCHWARTZ L W. An experimental and numerical investigation of buoyancy-driven two-phase displacement [J]. Physics Fluids A, 1991, 3(9): 2076-2080.
[8] MEAKIN P, WAGNER G, VEDVIK A, AMUNDSEN H, FEDER J. Invasion percolation and secondary migration: Experiments and simulations [J]. Marine and Petroleum Geology, 2000, 17(7): 777-795.
[9] KANG Yong-shang, ZHU Jiu-cheng, CHEN Lian-ming. Results of physical experiment on petroleum migration in water saturated fractured media and their geological significance [J]. Earth Science―Journal of China University of Geosciences, 2002, 27(6): 736-740. (in Chinese)
[10] KANG Yong-shang, GUO Qian-jie, ZHU Jiu-cheng, CHEN Lian-ming, ZENG Lian-bo. Light etched physical simulation experiment on oil migration in fractured media [J]. Acta Petrolei Sinica, 2003, 24(4): 44-47. (in Chinese)
[11] KONG Ling-rong, QU Zhi-hao. Two-phase-drive experiment in sandstone model [J]. Petroleum Exploration and Development, 1991, 18(4): 79-85. (in Chinese)
[12] JIA Hong-yu, QU Zhi-hao, KONG Ling-rong. Formation scaling mechanisms for low permeability oil fields―An experimental study in sandstone pore micro-models [J]. Petroleum Exploration and Development, 1997, 24(5): 104-107. (in Chinese)
[13] ZHU Yu-shuang, KONG Ling-rong, QU Zhi-hao, SUN Wei, LIU Bao-jun. Using the natural sandstone micromodel to study viscous instability fingering [J]. Journal of Northwest University: Science and Technology, 1998, 28(2): 166-168. (in Chinese)
[14] ZHU Yu-shuang, QU Zhi-hao, KONG Ling-rong, CHEN Rong, LI Jin-feng. Determination of oil reservoir wettability in two phase displacement experiment of sandrock model [J]. Oil and Gas Geology, 1999, 20(3): 220-223. (in Chinese)
[15] TANG Xuan, JIN Zhi-jun, YANG Ming-hui, MING Hai-hui. Experimental study on water-oil migration and accumulation in 2-D micro-model of carbonate fractures media [J]. Geological Review, 2006, 52(4): 570-576. (in Chinese)
[16] DEMBICKI H, ANDERSON M J. Secondary migration of oil: Experiments supporting efficient movement of separate, buoyant oil phase along limited conduits [J]. AAPG Bulletin, 1989, 73(8): 1018-1021.
[17] CATALAN L, FU X W, CHATZIS I, FRANCIS A L D. An experimental study of secondary oil migration [J]. AAPG Bulletin, 1992, 76(5): 638-650.
[18] ZHANG Fa-qiang, LUO Xiao-rong, MIAO Sheng, WANG Wei-min, ZHOU Bo, HUANG Yan-zhang. The patterns and its effect factors of secondary hydrocarbon migration [J]. Experimental Petroleum Geology, 2003, 25(1): 69-75. (in Chinese)
[19] SHI Ji-an, SUN Xiu-jian, WANG Jin-peng, WANG Qi, WANG Lei. Physical simulating experiment of natural gas migration and its characteristics of composition differentiation and carbon isotope fractionation [J]. Petroleum Geology and Experiment, 2005, 27(3): 293-298. (in Chinese)
[20] CHATENEVER A, CALHOUN J C. Visual examinations of fluid behavior in porous media (Part 1) [J]. AIME Petroleum Transactions, 1952, 195: 149-156.
[21] CHATZIS I, DULLIEN F A L. Dynamic immiscible displacement mechanisms in pore doublets: Theory versus experiment [J]. Journal of Colloids and Interface Science, 1983, 91(1): 199-222.
[22] KIMBER K D, ALI S M F. Scaled physical modeling of steam-injection experiments[J]. Society of Petroleum Engineers Reservoir Engineering, 1991, 18(8): 467-469.
[23] THOMAS M M, JAMIE A C. Scaled physical model of secondary oil migration [J]. AAPG Bulletin, 1995, 79(1): 19-29.
[24] ILLING V C. The migration of oil and natural gas [J]. J Inst Petrol, 1933, 19(4): 229-260.
[25] ZENG Jian-hui. Experimental simulation of impacts of vertical heterogeneity on oil migration and accumulation in fining upwards sands [J]. Petroleum Exploration and Development, 2000, 27(4): 102-105. (in Chinese)
[26] XIN Ren-chen, JIANG Zhen-xue, LI Si-tian. Physical modeling of secondary oil migration and accumulation in deltaic sandstone reservoir and its result analysis [J]. Earth Science―Journal of China University of Geosciences, 2002, 27(6): 780-782. (in Chinese)
[27] JIANG Zhen-xue, CHEN Dong-xia, MIAO Sheng, ZENG Jian-hui, QIU Nan-sheng. Model test and mechanism interpretaion of the petroleum accumulation of lenticular sandstone in Jiyang depression [J]. Oil and Gas Geology, 2003, 24(3): 223-227. (in Chinese)
[28] ZENG Jian-hui, JIN Zhi-jun, WANG Wei-hua. Status and advances of the studies on the experimental simulation of secondary hydrocarbon migration and accumulation [J]. Journal of the University of Petroleum, China, 1997, 21(5): 94-97. (in Chinese)
[29] ZHANG Yi-gang, CHEN Yan-hua, LU Jia-yan. Research of hydrocarbon migration and its accumulation [M]. Nanjing: Hohai University Press, 1997: 1-40. (in Chinese)
[30] ZENG Jian-hui, JIN Zhi-jun. An experiment of hydrocarbon secondary migration and accumulation [M]. Beijing: Petroleum Industry Press, 2000: 1-20. (in Chinese)
[31] LI Ming-cheng. Migration of oil and gas [M]. Beijing: Petroleum Industry Press, 2004: 1-200. (in Chinese)
[32] QU Zhi-hao, WAN Fa-bao, KONG Ling-rong, SUN Wei. Micro pore model and its production technology of real reservoir rock: CN11048 [P]. 1995-04-05.
[33] SCHOWALTER T T. Mechanics of secondary hydrocarbon migration and entrapment [J]. AAPG Bulletin, 1979, 63(5): 723-760.
[34] MCAULIFFE C D. Oil and gas migration-chemical and physical constraints [J]. AAPG Bulletin, 1979, 63(5): 761-781.
[35] MASTERS J A. Deep basin gas trap, western Canada [J]. AAPG Bulletin, 1979, 63(2): 152-181.
[36] SPENCER C W. Geologic aspects of tight gas reservoirs in the Rocky Mountain region [J]. Journal of Petroleum Geology, 1985, 37(7): 1308-1314.
[37] LAW B E. Basin-centered gas systems [J]. AAPG Bulletin, 2002, 86(11): 1891-1919.
[38] ZHANG Jin-chuan. Source-contacting gas: Derived from deep basin gas or basin-centered gas [J]. Natural Gas Industry, 2006, 26(2): 46-48. (in Chinese)
[39] SPENCER C W. Review of characteristics of low-permeability gas reservoirs in western United States [J]. AAPG Bulletin, 1989, 73(5): 613-629.
[40] YUAN Zheng-wen, ZHU Jia-wei, WANG Sheng-lang. Natural gas reservoir characteristics and classification of Shahejie Formation, East Depression [J]. Atural Gas Industry, 1990, 10(3): 6-11. (in Chinese)
[41] DAI Qi-de, JI You-liang. Oil and gas reservoir geology [M]. Dongying: Petroleum University Press, 1996: 1-100. (in Chinese)
[42] JIN Zhi-jun, ZHANG Jin-chuan. Exploration strategy for deep basin gas reservoirs [J]. Petroleum Exploration and Development, 1999, 26(1): 4-5. (in Chinese)
[43] ZHANG Jin-chuan, JIN Zhi-jun, ZHANG Yi-wei. Definition of deep basin gas accumulation and its geological characteristics [J]. Journal of the University of Petroleum, China, 2001, 25(6): 25-28. (in Chinese)
[44] YU He-zhong, ZHANG Li-xia, HAN Shou-hua, ZHU Guo-hua, SI Chun-song. The formation of the dense sandstone cap in the well Yingnan 2, Tarim Basin [J]. Petroleum Exploration and Development, 2004, 31(5): 133-135. (in Chinese)
(Edited by YANG You-ping)
Foundation item: Projects(40672087; 40472073) supported by the National Natural Science Foundation of China
Received date: 2010-02-05; Accepted date: 2010-06-30
Corresponding author: NIE Hai-kuan, PhD; Tel: +86-10-82284807; E-mail: niehk@pepris.com

